SciELO - Scientific Electronic Library Online

 
vol.28 issue6Environment and genotype: Effects on yield and its components, and phenology in common beansThermal ecology of the Rattlesnake Crotalus catalinensis from Santa Catalina Island, Gulf of California author indexsubject indexsearch form
Home Pagealphabetic serial listing  

Services on Demand

Journal

Article

Indicators

Related links

  • Have no similar articlesSimilars in SciELO

Share


Acta universitaria

On-line version ISSN 2007-9621Print version ISSN 0188-6266

Acta univ vol.28 n.6 México Nov./Dec. 2018

https://doi.org/10.15174/au.2018.2182 

Articles

Fischerella sp. biomass measurement by using graphite electrodes

Cuantificación de biomasa de Fischerella sp. a través de electrodos de grafito

José Martín Márquez-Villa* 

Juan Carlos Martínez-Espinosa*  º 

Juan Carlos Rodríguez-Sierra* 

*Unidad Profesional Interdisciplinaria de Ingeniería Campus Guanajuato, Instituto Politécnico Nacional. Av. Mineral de Valenciana 200, Fracc. Industrial Puerto Interior, Silao de la Victoria, Guanajuato, México. C.P. 36275.


Abstract

For several decades, the electrical admittance has been very useful for the determination of physical quantities, such as the characterization of some electrical properties of interest in organic samples. In this work, an electrical system based on graphite electrodes to determine the amount of living biomass of the cyanobacteria Fischerellasp. is proposed. Cyanobacteria are phototrophic microorganisms with applications on bioremediation, pharmaceutics, medicine, among others. The strain was characterized in BG-11 medium and cultured at different biomass concentrations. Samples were evaluated by electrical admittance and contrasted by the technique of dry weight in order to correlate the results registered by the/a proposal electric circuit. Scanning frequencies from admittance went in an order from 10 Hz to 1 000 000 Hz. Also, they showed a reproducibility, getting deviations of 6.45 × 10⁻⁵. This electrical system can be used to evaluate Fischerella sp. living biomass concentrations with high reliability.

Keywords: Cyanobacteria; quantification; admittance; photobioreaction

Resumen

Desde hace varias décadas la impedancia eléctrica ha sido de gran utilidad para la determinación de cantidades físicas, así como la caracterización de algunas propiedades eléctricas de interés en muestras orgánicas. En este trabajo se propone un sistema eléctrico basado en electrodos de grafito para determinar la cantidad de biomasa viva de la cianobacteria Fischerella sp. Las cianobacterias son microorganismos fotoautótrofos con aplicaciones de biorremediación, farmacéuticas, médicas, entre otros. La cepa fue caracterizada en medio de cultivo BG-11 y a diferentes porcentajes de biomasa. Las muestras evaluadas por impedancia eléctrica fueron contrastadas mediante la técnica de peso seco con la finalidad de correlacionar los resultados registrados por el circuito eléctrico propuesto. Las frecuencias de barrido en la impedancia fueron en un orden de 10 Hz a 1 000 000 Hz. También mostraron una reproducibilidad alcanzando desviaciones de 6.45 × 10⁻⁵. Este sistema eléctrico puede ser utilizado para evaluar concentraciones de biomasa viva de Fischerella sp. con una alta confiabilidad.

Palabras Clave: Cyanobacteria; quantification; admittance; photobioreaction

Introduction

Cyanobacteria make up a very diverse group of prokaryotic organisms belonging to the Bacteria domain, capable of performing oxygenic photosynthesis (Lewis, Joseph & Woodward, 2016; Rantamäki et al., 2016; Whitton, 1992). Recently, researchers from different parts of the world have been interested in working with green biotechnology; they have studied microalgae and cyanobacteria such as Dunaliella salina, Chlorella vulgaris, Anabaena sp., and Fischerella sp., among others (Higo, Katon, Ohmori, Ikeuchi & Ohmori, 2006; Rungaroon, Hakuto & Teruhiro, 2016; Widjaja, Chien & Ju, 2009). Applications have been diverse, examples are Agricultural crops protection, secondary sewage treatment, nanotechnology and pharmaceutics (Dhar, Saxena & Singh, 2009; Ghosh, Paliwal, Maurya & Mishra, 2015; Luangpipat, Beattie, Chisti & Haverkamp, 2011; Singh & Dhar, 2007; Singh, Dhar & Tabassum, 2014). The control of the operating variables in a photobioreactor system is of great importance, in order to recreate the kinetic parameters of reaction. Thus, monitoring the growth rate and production of metabolites of interest is implicit in the control of bioreaction (Su, Mennerich & Urban, 2016). Determining the biomass concentration allows obtaining information to make key decisions about the process conditions such as light intensity, temperature and substrate concentration (Ducat, Way & Silver, 2011; Markov, Weaver & Seibert, 1997; Santos, Fernandes, Wagner, Jacob-Lopes & Zepka, 2015; Taskan, 2016). Nowadays, in situ quantification techniques for microbial cultures can be classified as direct and indirect, impacting from dielectric spectroscopy, dry weight, wet weight, fluorescence, packed cell volume, cells number, infrared spectroscopy, mass of cellular component, measurements of generated heat, and optical methods, among others (Erdle, Mistele & Schmidhalter, 2011; Heidari, Yoon, Park & Lin, 2011; Herbert, 1990; Kiviharju, Salonen, Moilanen & Eerikäiren, 2008; Krommenhoek et al., 2008; Nichol & Sarker, 2011). However, the indirect measurements problem is that the devices do not distinguish between viable and non-viable cells. The electrical impedance is represented as the opposition of a conductor to the flow of alternate current, as the same current is composed by the resistive and reactant vector. Thus, bioelectric impedance is a technique used to quantify body compositions, based on the ability of the organism to conduct an electric current. So, the electrical admittance is a technique to solve the limitations that conductivity techniques present through variations in the frequency. It has been used to validate inter-tissue interactions, to evaluate different biological systems, to generate correlations between their fluids and their conductance, resistivity, and admittance, among others (Boukamp, 1984; Ching, Sun, Jheng, Tsai & Shien, 2015; Chumlea & Guo, 1994; Dimeas & Aspragathos, 2016; Kottam et al., 2006; Kutty et al., 2013; Oh, Lee, Seo, Kim & Woo, 2007; Rodríguez-Sierra & Soria, 2016; Yonamine & Sampaio, 2006). In this work, a technique to determine the concentration of living biomass by electrical admittance for the cyanobacteria Fischerella sp. through the use of graphite electrodes is proposed.

Materials and methods

Photobioreactor system

The bioprocess was taken on 400 mL of photobioreactors with a volume operation of 300 mL, and the strain was maintained under a 12:12 light:dark photoperiod with a light intensity of 73 µmol/m-2s-1 provided by cool white fluorescent tubes (Trademark MAGG) and a constant air flow of 1.5 vvm. No axenic samples from Fischerella sp. were taken.

Samples preparation

There were 105 samples prepared, where 30 were combined with BG-11 medium (Rippka, Dervelles, Waterbury, Herdman & Stanier, 1979; Stanier, Kunisawa, Mandel & Cohen-Bazire, 1971) and distilled water, 60 with living biomass prepared with BG-11 medium, and 15 with inactivate biomass (DBM) or dead biomass prepared with BG-11 medium too. Table 1 specifies the making of each sample analyzed. DBM was obtained from a 250 Ml cyanobacteria culture that was sterilized under the conditions of 15 psi, 15 min, at 121 °C. The supernatant was retired, and dead biomass was washed with distilled water and resuspended in fresh medium BG-11.

Table 1 Liquid samples evaluated using different concentrations of distilled water, fresh medium and biomass. Abbreviations: FM: Fresh medium; DW: Distilled water; BM: biomass; DBM: Inactive biomass. 

# Fresh medium Distilled water Living biomass Inactive biomass
FM [%] V[mL] DW [%] V[mL] BM [%] V[mL] DBM [%] V[ml]
3 0% 0 100 % 2.8 X X X X
3 75% 0.7 75% 2.1 X X X X
3 50% 1.4 50% 1.4 X X X X
3 75% 2.1 25% 0.7 X X X X
3 100% 2.8 0% 0 X X X X
5 0% 0 X X 100% 2.8 X X
5 75% 0.7 X X 75% 2.1 X X
5 50% 1.4 X X 50% 1.4 X X
5 75% 2.1 X X 25% 0.7 X X
5 100% 2.8 X X 0% 0 X X
3 0% 0 X X X X 100% 2.8
3 75% 0.7 X X X X 75% 2.1
3 50% 1.4 X X X X 50% 1.4
3 75% 2.1 X X X X 25% 0.7
3 100% 2.8 X X X X 0% 0

Source: Author's own elaboration.

Electric system preparation

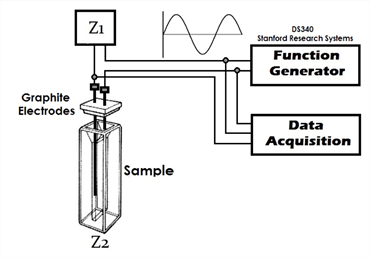
The characterization of the system was achieved using graphite electrodes with a length of 3 cm and a diameter of 0.07 cm. The electrodes were placed on a plastic cover which has an area of 0.81 cm2. The cover was used to seal the plastic cuvette containing the sample to evaluate. The cells volume was 2.8 mL and a signal generator (Stanford Research Systems, Mod. DS340) was used to supply a sine signal with an amplitude of 5 Vpp to the electric circuit varying the frequency of the sine signal in 10 Hz, 50 Hz, 100 Hz, 500 Hz, 1000 Hz, 5000 Hz, 10 000 Hz, 50 000 Hz, 100 000 Hz, 250 000 Hz, 500 000 Hz, 750 000 Hz and 1 000 000 Hz. In Figure 1, the used experimental setup is shown.

Source: Author's own elaboration.

Figure 1 Experimental electrical setup used to evaluate the concentrations of biomass deposited in plastic cells and characterized by graphite electrodes. Abbreviations. Z: Impedance. 

Data characterization and processing

All samples were run in triplicate, both at the electric system and at its dry weight determination. A comparative analysis of each sweep was performed with different concentrations of biomass; this was done in order to observe the response of the system in each frequency sent by the function generator. The data obtained were processed through the software Origin version 8.0.

Living Biomass dry weight measurements

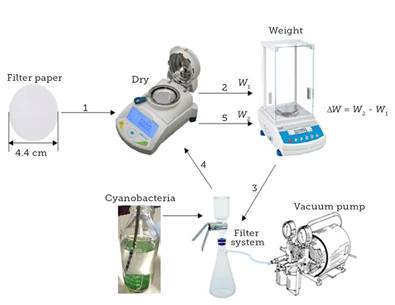
Dry weight measurements were given through drying the filter with a humidity balance PMB (Adam Equipment, Mod.17250) at 140 °C for 5 min; next, it was weighed in an analytical balance (RADWAG Wagi Elektroniczne, Mod. AS 220.R2). The biomass was filtered with the equipment KG 47 GLASS SUPPORT (Advantec MFS, Inc., Mod. 311400) of 300 mL and a Kitasato flask (KIMAX, Mod. 27060) of 1000 mL, as well as with a vacuum pump (WACO, Mod. 73021-00). The filter with living biomass was dried using the humidity balance PMB at 140 °C for 5 min, then it was weighed in the analytical balance. Figure 2 shows the flow of the drying process of the biomass evaluated by electrical admittance.

Source: Author's own elaboration.

Figure 2 Experimental flow of the drying process to evaluate the dry weight of the characterized biomass. Abbreviations. W: Weight; ΔW: Difference in weight. 

Results and discussion

Samples scanning

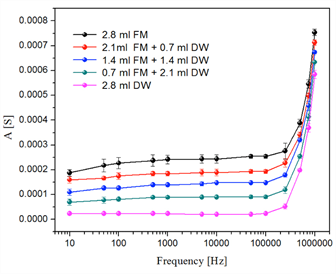
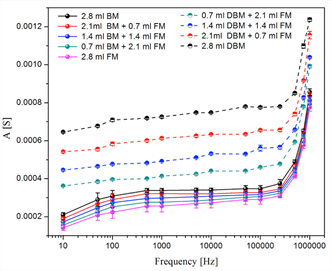
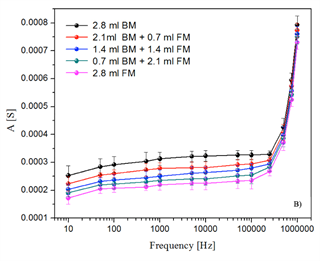
All samples were evaluated with different frequencies included in the range from 1 × 10⁻¹ Hz to 1 × 10⁻⁶ Hz. All the sweeps reflect the resistive, capacitive and inductive regions. Figure 3 shows the electrical behavior of the solutions without Fischerella sp. biomass (only fresh medium and distilled water, with different concentrations), and where the electrical response was relatively very low. On the other hand, Figure 4 shows the response of the electrical system for living and inactive biomass solutions prepared with fresh medium at different concentrations. In the comparative analysis between non-active biomass and living biomass, Figure 4 shows a higher variability with non-activated biomass with respect to living or activated biomass; that is, the electrical impedance values were higher when the dead cyanobacteria Fischerella sp. was analyzed. However, the only focus of this research is the quantification of the living biomass. For this, in Figure 5 only the electrical response of the living biomass for the different frequencies evaluated is shown.

Source: Author's own elaboration.

Figure 3 Sample’s experimental scanning with graphite electrodes for fresh medium with distilled water scanning. Abbreviations. FM: Fresh medium; DW: Distilled water. 

Source: Author's own elaboration.

Figure 4 Comparative response of the electrical system for the evaluated Fischerella sp. samples of inactive biomass and live biomass. Abbreviations. FM: Fresh medium; BM: Living biomass; DBM: Inactive biomass. 

Source: Author's own elaboration.

Figure 5 Response of the electrical system for the samples evaluated from Fischerella sp. living biomass with fresh medium scanning. Abbreviations. FM: Fresh medium; BM: Living biomass. 

Our results are supported by studies (Deurenberg, 1992) which postulate that when the frequency results to be lower or equal to 1 kHz (<10 kHz), the current does not pass through the cell membrane, and therefore the resistance obtained is only related to the extracellular mass. Otherwise, with 50 kHz-100 kHz the current crosses the membrane and allows determining the total cell mass (intra and extracellular components).

Therefore, for the calibration curves preparation, it was necessary to select a frequency under which the sweeps did not show high variability, whereby the frequency of 50 kHz was chosen. In Figure 5, the electrical behavior of the activated biomass prepared with fresh medium is shown. In comparison with the response of the system in the samples of distilled water and fresh medium, a higher electrical response was presented for the living biomass.

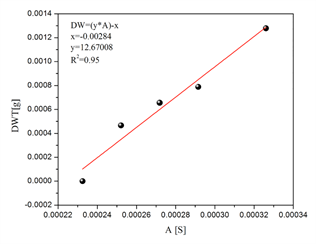
Considering the admittance values obtained from the response of the electric system at 50 kHz, we adjusted to a linear system to determine concentrations of biomass in fresh culture medium. The linear behavior reflects an R2 = 0.95. In Figure 6, the constants for the slope and the intercept for the calibration system are verified.

Source: Author's own elaboration.

Figure 6 Linear fit calibration curve of Fischerella sp. living biomass obtained at 50 kHz. Abbreviations. A: Admittance; DWT: Dry weight. 

Conclusions

The scale measurement system used sinusoidal, electrical signals provided by a function generator where, by modifying the excitation frequencies from 1 × 101 Hz to 1 × 10⁶ Hz, it was capable to generate transduction responses in Fischerella sp. along the sweeps, generating correlated voltage variations in the different percentages of living biomass concentration. Derived from these sweeps, the frequency with the best response for the characterization of the biomass concentrations was selected, allowing to quantify, by an indirect method, the existing cell density in the sample under study. The design opts for low-cost materials by the use of graphite electrodes with adequate polarization, allowing suggesting the integration of more robust embedded electrical systems, capable of adapting to the industrial needs that demand it. In future research work, it is necessary to study the behavior of the electrical system with non-activated biomass when it interacts with the activated biomass, in addition to transferring this quantification system to other species of cyanobacteria.

Acknowledgments

The authors wish to thank the Secretaria of research and postgraduate (SIP-IPN) for financial support under grant number 20171217 and 20180174.

References

Boukamp, B. A. (1984). A microcomputer-based system for frequency dependent impedance/admittance measurements. Solid State Ionics, 11(4), 339-346. doi: https://doi.org/10.1016/0167-2738(84)90025-0Links ]

Ching, C., Sun, T., Jheng, D., Tsai, H., & Shieh, H. (2015). A creatinine biosensor based on admittance measurement. Proceedings of the SPIE, 9550. doi: https://doi.org/10.1117/12.2187305Links ]

Chumlea, W. C., & Guo, S. S. (1994). Bioelectrical impedance and body composition: Present status and future directions. Nutrition Reviews, 52(4), 123-131. [ Links ]

Deurenberg, P. (1992). The assessment of body composition: use and misuse. Annual Report Nestlé Foundation, 35-72. [ Links ]

Dhar, D. W., Saxena, S., & Singh, N. K. (2009) BGA biofertilizer: production, constraints and future perspectives. In: Mallik, C. P., Wadhwani, C., Kaur, B. (Eds.). Crop breeding and biotechnology (209-226). Jaipur: Pointer Publishers. [ Links ]

Dimeas, F., & Aspragathos, N. (2016). Online stability in human-robot cooperation with admittance control. IEEE Transactions on Haptics, 9(2), 267-278. doi: https://doi.org/10.1109/TOH.2016.2518670Links ]

Ducat, D. C., Way, J. C., & Silver, P. A. (2011). Engineering cyanobacteria to generate high-value products. Trends in Biotechnology, 29(2), 95-103. doi: https://doi.org/10.1016/j.tibtech.2010.12.003Links ]

Erdle, K., Mistele, B., & Schmidhalter, U. (2011). Comparison of active and passive spectral sensors in discriminating biomass parameters and nitrogen status in wheat cultivars. Field Crops Research, 124(1), 74-84. doi: https://doi.org/10.1016/j.fcr.2011.06.007Links ]

Ghosh, T., Paliwal, C., Maurya, R., & Mishra, S. (2015). Microalgal rainbow colours for nutraceutical and pharmaceutical applications. In: Bahadur, B., Venkat Rajam, M., Sahijram, L., Krishnamurthy, K. (Eds.). Plant Biology and Biotechnology (pp. 777-791). New Delhi: Springer. doi: 10.1007/978-81-322-2286-6_32 [ Links ]

Heidari, A., Yoon, Y. J., Park, W. T., & Lin, J. T. M. (2011). Developing high sensitivity biomass sensor using Lamé-mode Square Resonator. Advanced Materials Research, 254, 46-49. doi: https://doi.org/10.4028/www.scientific.net/AMR.254.46Links ]

Herbert, R. A. (1990). Methods for enumerating microorganisms and determining biomass in natural environments. In: Grigorova, R., Norris, J. R. (Eds.). Methods in Microbiology (pp. 1-39). Scotland: Elsevier. [ Links ]

Higo, A., Katoh, H., Ohmori, K., Ikeuchi, M., & Ohmori, M. (2006).The role of a gene cluster for trehalose metabolism in dehydration tolerance of the filamentous cyanobacterium Anabaena sp. PCC 7120. Microbiology, 152, 979-987. doi: https://doi.org/10.1099/mic.0.28583-0Links ]

Kiviharju, K., Salonen, K., Moilanen, U., & Eerikäinen, T. (2008). Biomass measurement online: The performance of in situ measurements and software sensors. Journal of Industrial Microbiology and Biotechnology, 35(7), 657-665. doi: https://doi.org/10.1007/s10295-008-0346-5Links ]

Kottam, A. T. G., Porterfield, J., Raghavan, K., Fernandez, D., Feldman, M. D., Valvano, J. W., & Pearce, J. A. (2006). Real time pressure-volume loops in mice using complex admittance: Measurement and implications. Conference Proceedings: Annual International Conference of thr IEEE Enginering Medicine and Biology Society, 1, 4336-4339. [ Links ]

Krommenhoek, E. E., Van Leeuwen, M., Gardeniers, H., Van Gulik, W., Berg, A. Van den Berg, A. , Li, X., Ottens, M., Van der Wielen, L., & Heijnen, J. J. (2008). Lab-Scale fermentation tests of microchip with integrated electrochemical sensors for pH, temperature, dissolved oxygen and viable biomass concentration. Biotechnology and Bioengineering, 99(4), 884-892. doi: https://doi.org/10.1002/bit.21661Links ]

Kutty, S., Kottam, A. T., Padiyath, A., Bidasee, K. R., Li, L., Gao, S., Wu, J., Lof, J., Danford, D. A., & Kuehne, T. (2013). Validation of admittance computed left ventricular volumes against real-time three-dimensional echocardiography in the porcine heart. Experimemntal Physiology, 98(6), 1092-1101. doi: https://doi.org/10.1113/expphysiol.2012.070821Links ]

Lewis, M. W., Joseph, L. K., & Woodward W. F. (2016). Timescales of oxygenation following the evolution of oxygenic photosynthesis. Origins of Life and Evolution Biospheres, 46(1), 51-65. doi: https://doi.org/10.1007/s11084-015-9460-3Links ]

Luangpipat, T., Beattie, I. R., Chisti, Y., & Haverkamp, R. G. (2011). Gold nanoparticles produced in a microalga. Journal of Nanoparticle Research, 13(12), 6439-6445. [ Links ]

Markov, S. A., Weaver, P. F., & Seibert, M. (1997). Spiral tubular bioreactors for hydrogen production by photosynthetic microorganisms: design and operation. Applied Biochemistry and Biotechnology, 63-65(1), 577-584. doi: https://doi.org/10.1007/BF02920455Links ]

Nichol, J. E., & Sarker, M. L. R. (2011). Improved biomass estimation using the texture parameters of two high-resolution optical sensors. IEEE Transactions on Geoscience and Remote Sensing, 49(3), 930-948. doi: https://doi.org/10.1109/TGRS.2010.2068574Links ]

Oh, T. I., Lee, J., Seo, J. K., Kim, S. W., & Woo, E. J. (2007). Feasibility of breast cancer lesion detection using a multi-frequency trans-admittance scanner (TAS) with 10 Hz to 500 kHz bandwidth. Physiological Measurement, 28(7), 71-84. doi: https://doi.org/10.1088/0967-3334/28/7/S06Links ]

Rantamäki, S., Meriluoto, J., Spoof, L., Puputti, E. M., Tyystjärvi, T., & Tyystjärvi, E. (2016). Oxygen produced by cyanobacteria in simulated Archaean conditions partly oxidizes ferrous iron but mostly escapes-conclusions about early evolution. Photosynth Research, 130(1-3), 103-111. doi: https://doi.org/10.1007/s11120-016-0231-4 (ANTES SUSANNE) [ Links ]

Rippka, R., Deruelles, J., Waterbury, J. B., Herdman, M., & Stanier, R. Y. (1979). Generic assignments, strain histories and properties of pure cultures of cyanobacteria. Journal of General Microbiology, 3, 1-61. doi: https://doi.org/10.1099/00221287-111-1-1Links ]

Rodríguez-Sierra, J. C., & Soria, A. (2016). Two models of electrical impedance for electrodes with tap water and their capability to record gas volume fraction. Revista Mexicana de Ingeniería Química, 15(2), 543-551. [ Links ]

Rungaroon, W. S., Hakuto, K., & Teruhiro, T. (2016). Halophilic microorganism resources and their applications in industrial and environmental biotechnology. AIMS Microbiology, 2(1), 42-54. [ Links ]

Santos, A. B., Fernandes, A. S., Wagner, R., Jacob-Lopes, E., & Zepka, L. Q. (2015). Biogeneration of volatile organic compounds produced by Phormidium autumnale in heterotrophic bioreactor. Journal of Applied Phycology, 28, 1561-1570. doi: https://doi.org/10.1007/s10811-015-0740-0Links ]

Singh, N. K., & Dhar, D. W. (2007). Nitrogen and phosphorous scavenging potential in microalgae. Indian Journal of Biotechnology, 6(1), 52-56. [ Links ]

Singh, N. K., Dhar, D. W., & Tabassum, R. (2014). Role of cyanobacteria in crop protection. Proceedings of the National Academy of Sciences, India Section B: Biological Sciences, 86(1), 1-8 doi: https://doi.org/10.1007/s40011-014-0445-1Links ]

Stanier, R. Y., Kunisawa, R., Mandel, M., & Cohen-Bazire, G. (1971). Purification and properties of unicellular blue-green algae (order Chroococcales). Bacteriological Reviews, 35(2), 171-205. [ Links ]

Su, Y., Mennerich, A., & Urban, B. (2016). A comparison of feasible methods for microalgal biomass determinations during tertiary wastewater treatment. Ecological Engineering, 94, 532-536. doi: https://doi.org/10.1016/j.ecoleng.2016.06.023Links ]

Taşkan, E. (2016). Effect of tetracycline antibiotics on performance and microbial community of algal photo-bioreactor. Applied Biochemistry and Biotechnology, 179(6), 947-958. doi: https://doi.org/10.1007/s12010-016-2042-7Links ]

Whitton, B. A. (1992). Diversity, ecology and taxonomy of the cyanobacteria. In: N. H. Mann, N. G. Carr. (Eds.). Photosynthetic Prokaryotes. (pp. 1-51) London: Plenum Press. [ Links ]

Widjaja, A., Chien, C. C., & Ju, Y. H. (2009). Study of increasing lipid production from fresh water microalgae Chlorella vulgaris. Journal of the Taiwan Institute of Chemical Engineers, 40(1), 13-20. [ Links ]

Yonamine, M., & Sampaio, M. C. (2006). A high-performance thin-layer chromatographic technique to screen cocaine in urine samples. Legal Medicine, 8(3), 184-187. doi: https://doi.org/10.1016/j.legalmed.2005.12.005Links ]

Cómo citar: Máquez-Villa, J. M., Martínez-Espinosa, J. C., & Rodríguez-Sierra, J. C. (2018). Fischerella sp. biomass measurement by using graphite electrodes. Acta Universitaria, 28(Online First), 33-38. doi: 10.15174/au.2018.2182

Received: December 30, 2017; Accepted: September 21, 2018

°Corresponding author jcmartineze@ipn.mx.

Creative Commons License This is an open-access article distributed under the terms of the Creative Commons Attribution License