INTRODUCTION
Polycarbonate (PC) resins can generally be divided into two categories based on their chemical structure: aliphatics and aromatics. The most common and widely used aromatic PC is poly (bisphenol A carbonate) (Antonakou & Achilias, 2013; Depelch, Coutinho & Habibe, 2002). Polycarbonate is one of the most important engineering plastics, being employed in a wide variety of applications due to its mechanical properties, high impact strength, toughness and transparency (Cao, Ma, Zhang, Wang & Wang, 2010; Katajisto, Pakkanen, Pakkanen & Hirva, 2003; Krawczak, 2009; Liu, Li, Yu, Lv & Ge, 2011; Ronkay, 2013), despite its disadvantages (Antonakou & Achilias, 2013; Elmaghor, Zhang, Fan & Li, 2004).
The use of PC has increased rapidly, with a 7% rise in annual consumption. 2.3 Mt were produced in 2004, 3 Mt in 2006, and 3.3 Mt in 2008 (Antonakou & Achilias, 2013). With prices ranging from commodity plastics to special engineering thermoplastics, PC is the second most popular (in terms of volume) engineering thermoplastic after the polyamides (Antonakou & Achilias, 2013).
In recent years, reprocessing of polymers has been widely carried out in plastics-converting industries (Al-Salem, Lettieri & Baeyens, 2009; Pegoretti, Kolarik & Slouf, 2009; Shent, Pugh & Forssberg, 1999). As a result of a variety of factors, including an increasing awareness of environmental issues, the desire to save resources, and finally the high levels of scrap material generated during plastics conversion. Also, demand for the recycling of scraps can be considerable if the relatively high cost of polymer production is considered. To solve this latter problem, scrap recycling often involves mixing scrap with virgin material, and the recycling of such plastic material after the first life cycle recently attracting increased attention (Krivtsov et al., 2004; Ronkay, 2013; Saravía-Sánchez, 2007).
PC recycling may be carried out in three main ways: direct recycling (mechanical recycling or blending with other materials), recycling via chemical methods, and finally thermochemical recycling (pyrolysis). PC produced after mechanical recycling exhibits several deteriorated properties when compared to virgin PC polymer. One solution to this problem can be achieved via blending with other materials in order to modify impact resistance in the recycled PC (Liu et al., 2011). Although degradation after chemical treatment can yield a high percentage of the monomer; it requires a complex product separation process involving a series of environmental and safety problems. Thermochemical degradation has been suggested as a promising alternative for polymer treatment since it can deal with high molar mass organic molecules, with its major disadvantages associated with its low selectivity (Antonakou & Achilias, 2013).
However, PC recycling does have some drawbacks, such as the severe reduction of certain physical and mechanical properties. For instance, Pérez et al. (2010) reported a reduction in tensile strength of 30% after ten recycling cycles. Injection molding is one of the most efficient processes, with mass production via automation feasible and products with complex geometry easily obtained. Injection molding process cycle can be divided into three stages: filling, packing, and cooling. Rheological behavior of polymers during these molding processes is complicated, making the quality characteristics of injected products highly unpredictable (Tsai, Hsieh & Lo, 2009). A number of studies have been conducted aimed at understanding the effect of multiple polycarbonate injection moldings, results revealed that with an increase in the number of injection moldings, PC’s tensile strength initially rises slightly before remaining constant. The other quality parameters, determined in tensile tests, were found to essentially stay unchanged (Chrysostomou & Hashemi, 1996; Gruber, Berger, Pacher & Friesenbichler, 2011). Shea and Nelson examined the effect of recycling on the properties of injection molded polycarbonate, evaluating the extent of degradation by measuring melt flow rate, impact strength and molecular weight (Ronkay, 2013). Latter authors found that after ten recycling cycles the value of the melt flow rate has increased fivefold. In another study, molecular mass changes were investigated during the repetitive injection molding of polycarbonate, with the observed rapid decrease in molecular weight explained by two simultaneous degradation mechanisms (Ronkay, 2013).
Whereas the Melt Flow Rate (MFR) of PC increases as the number of injection moldings rises, no variation in glass temperature takes place. Degradation of PC during accelerated aging tests has recently been studied by several researchers. Examined areas included durability and predictability of the properties throughout the whole lifecycle of the PC, and degradation mechanism taking place at molecular level as well (Ronkay, 2013).
A number of papers have been published concerning effect of recycling on the mechanical properties of polycarbonate, several focus on the effect of reprocessing on PC tensile properties and flow ability (Völkel et al., 2011; Żenkiewicz et al., 2009b). For example, studies by Antonaku & Achilias (2013) and Völkel et al. (2011) have shown that while reprocessing has no significant effect on tensile strength, it can influence the flow ability of such materials quite considerably. These studies have also indicated that a significant amount of chain scission occurs during reprocessing, resulting in a material with a lower molecular weight Numeral Molecular weight, Number average molar mass (Mn) and lower impact strength.
Experiments such as those outlined above have concluded that it is possible to recycle PC without a loss in performance, with only a few changes in the processing temperature profile required to compensate for degradation (Żenkiewicz et al., 2009; 2009b). The main advantage of recycled PC is the mechanical properties of the produced shredded and reinjected molded soft-touch parts, which exhibit around 80% of original elongation at the break of the original layer (Meza, Vega & Pérez, 2013; Szczepanik, Stabik, Wróbel & Wierznicki, 2008).
One of the most important applications of PC is its use in the automotive industry. Light fittings are essentially composed of polymer blends and pigments which are usually molded via an injection process in which influential parameters are difficult to identify due to all the factors involved (Artham & Doble, 2009; Feller & Bourmaud, 2003).
Automotive lighting systems are an essential part of a vehicle in terms of security and styling. Their optical properties are evidently essential in these aspects. Plastics parts are basically made of polymer blends and pigments, which are usually molded by an injection process where influential factors are difficult to identify by all the factors involved. Additionally, injection molding process is basically controlled by: mold and nozzle temperature, holding and packing pressure, holding and packing time, melt temperature, screw speed, dry material, and clamp pressure (Artham & Doble, 2009).
Automobile outer lens needs to satisfy several international legal requirements. Besides legal requirements, the design of an automobile represents an especially important selling point for buyers.
The aim of the present study was to investigate the effects of different percentages of recycled polycarbonate polymer in the optical component (bezel) of an automotive headlamp. Mechanical and chemical effects were evaluated via an industrial process in order to determine the acceptability of the recycled material in terms of the mechanical properties of the final product compared to those of the original polycarbonate product. In this detailed study we analyzed the Molecular Weight Distribution (MWD) of the samples, searching for any presence of unwanted polymeric species or cross-linking. Chemical analysis was also carried out by employing Fourier Transformation Infrared Spectroscopy (FTIR) and 1H, 13C Nuclear Magnetic Resonance (NMR) to look for any structural change. Finally, mechanical and surface analysis was undertaken in order to observe any significant change in material physical properties.
MATERIALS
High heat AG Makrolon 2405 Polycarbonate (Bayer Injection Grade) was employed for the component bezels, with High-Performance Liquid Chromatography (HPLC)-grade tetrahydrofuran (THF) purchased from Sigma Aldrich. The component bezels were produced in an injection molding machine (Krauss Maffei), with a diagram of a typical example shown in Figure 1.
Mixtures of virgin and recycled polycarbonate were obtained using a Wittman pellet mixer (Austria, 2011), producing samples containing 0%, 20%, 50% and 100% recycled material, respectively.
In order to fulfill legal requirements for the pieces obtained, the bezels were analyzed in a Hella goniometer (Germany, 2002) and an ISOXT3411 humidity chamber (USA, 2007), with vibration tests performed using Hartmann vibration equipment (Germany, 2008).
The molded pieces (Figure 1) were obtained as construction elements of the optical component of a headlamp and were produced in a Krauss Maffei 850/1000T industrial injection press (Germany). Process parameters were as follows: temperatures along the cylinder of injection molding press were 250 ºC, 265 ºC and 275 ºC, head temperature 285 ºC, mold temperature 95 ºC, injection molding pressure 7 MPa, and injection molding cycle time 60 s, including a cooling time of 24 s.
EXPERIMENTAL
FTIR Characterization
For FTIR, 1 cm2 samples were cut from the component bezels, with all samples then washed prior to analysis. For measurements PC polymer samples were put in diamond crystal in a Perkin Elmer model 100 FTIR spectroscope, with maximum equipment pressure (1000 passes for good contact with the crystal). Produced spectra were normalized in order to eliminate the effect of sample quantity. In the case of analyzed PC the signal used for normalization was the triplet between 1165 cm-1 and 1228 cm-1, corresponding to the C-O bond.
1H, 13C NMR (Nuclear Magnetic Resonance) Characterization
1H NMR and 13C NMR spectra were obtained in a Bruker Ascend (400 MHz) instrument operating at 400 (1H) and 100 (13C) MHz. Parameters for 1H were a scan number (NS) of 16 and a pulse length (P1) of 8.5 microseconds. For 13C analysis these figures were 1024 microseconds and 10 microseconds, respectively. Samples were dissolved in CDCl3 and chemical shifts expressed in ppm via comparison with Tetramethylsilane (TMS) signal used as an internal standard.
Gel Permeation Chromatography (GPC) Characterization
For GPC characterization, 1 × 10⁻³ g/cm3 solutions were placed in a Waters 2695 ALLIANCE model with separation module, integrated Waters 2414 refraction index detector, online de-gasifier, and a bank of two Waters HPLC columns: Styragel HR 4E (Mw range: 50 to 1 × 10⁵) and Styragel HR 5E (Mw range: 2 × 10³ to 4 × 10⁶). Tetrahydrofuran (THF) was employed as an eluent, with a flow speed of 0.3 mL/min and a temperature of 35 °C. Fourteen polystyrene standards were injected twice in order to produce a calibration curve.
GPC/LS Characterization
In order to obtain a more in-depth analysis of their MWD values, the PC materials were examined using a GPC/Static Light Scattering (SLS) coupled system. Sample molecular weights were determined in a GPC-LS coupled system comprising a DAWN F multi-angle light-scattering detector (Wyatt Technology) coupled with a Waters 2410 refractive index detector and a Varian 9012Q pump. This system permits the measurement of the scattered intensity at 15 angles during sample elution. As a result, the molecular weight can be evaluated across the whole chromatographic concentration-sensitive detector, usually a Refractive Index (RI) detector, connected in line with a multi-angle laser Light Scattering (LS) photometer. This technique eliminates the need for column calibration. In the GPC-LS system, the mobile phase used was high-performance liquid chromatography (HPLC)-grade THF at a constant flow speed of 1 ml min-1. This system uses increment in the refractive index (dn/dc) to calculate concentration at each elution volume and mass recovery of the columns. A PC dn/dc value of 0.1855 cm3/g was used for characterization of the molecular weights. Accuracy of the mass recovery depends on the RI constant and flow rate being correct, while injected mass must also be accurate. Solutions ranging from 1.25 to 10 × 10-3 g/cm3 were used in the analysis.
DMA Characterization
PC visco-elastic properties were measured using a dynamic mechanical analyzer (DMA-8000 Perkin-Elmer) in dual cantilever bending mode, with a displacement amplitude of 0.1 mm in constant strain mode. Specimens used were rectangular sheets of dimensions 11.3 mm width, 2.6 mm thickness and 42 mm length in all cases. Temperature dependence of storage modulus and tan δ. The phase angle δ is the difference between dynamic tension and dynamic deformation of a visco-elastic material subjected to a sinusoidal oscillation, and allows the observation of transitions such as Tg, in which the value of tan δ against Temp is 0. For example, where one can observe a maximum on the graph were measured at 1 Hz across a temperature range from 30 ºC to 210 ºC at a heating rate of 3 °C/min. The purpose of this analysis was to obtain information regarding influence of recycled polycarbonate percentage on virgin polycarbonate mechanical properties. Three samples were analyzed (100% virgin polycarbonate, 100% recycled polycarbonate, and a 50% w/w blend).
MFI Characterization
The melt flow index (MFI) was measured according to ASTM D 1238 using a Tinius Olsen (EOPA-2096) plastometer. Experimental conditions were based on temperature and load specified by raw material, in this case a dry temperature of 130 °C, a dry time of 4 h, a test temperature of 330 °C, an applied load of 2.16 Kg, and a material density of 1.2 g/cm3.
AFM Characterization
Topographic and phase images were obtained via Atomic Force Microscopy (AFM) (Dimension Edge Scanning Probe Microscope, Bruker) in tapping mode by using an antimony (n) doped Si tip (RTESP, Bruker), whose nominal frequency and spring constant ranged between 324 kHz and 377 kHz, and 20 N/m - 80 N/m, respectively. Image analysis was carried out using the software program Nanoscope Analysis V1.4
Quality Specifications
All samples were evaluated according to typical quality tests required for its approval by United Nations Economic Commission of Europe (ECE), Federal Motor Vehicle Safety Standards (FMVSS), which are based on proposals of the Society of Automotive Engineers (SAE) and Canada Motor Vehicle Safety Standards (CMVSS) regulations.
Vibration and impact test
Vibration and impact test were made according to the SAE J575e, in which table adapter plate shall be of sufficient size to hold the device base. Vibration should be applied to vertical axis of coordinate system and is mounted on the vehicle, and filaments must not be energized.
Test requirements are as follows: All areas of the part must be free of major defects such as cracks, loose parts, breakage or game of each portion of the parties. Breaking filament is allowable, and dust caused by abrasion.
Sample was vibrated with the following parameters:
Photometry tests
According to the photometry tests made, headlamp shall meet photometric requirements for each evaluated functions, these functions contain their tables of values and measurements must be greater than the minimum value and the maximum value under each of the points evaluated.
Photometric measurements were made with the light source on. Measurement of luminous intensity in candela, was recorded for each test point and areas specified for the function or test device.
Focus: unless otherwise specified, calibrated bulbs shall be used and shall be operated at the specified output luminous flux.
Voltage test: If a luminous flux is not available or applicable, operate the bulbs to their design voltage.
Distance test: The test distance is 3.16 m for signal lights and 25 m for headlights.
Temperature cycle
After the test should not exist deformations, cracks, moisture or deterioration of the material, colorfast or deformed lens greater than 3 mm and comply with photometric values applicable to headlamp under test.
Headlights will be subjected to 10 consecutive cycles to profile of the event: during the heat cilo energize the lighthouse starting point A (-34 °C) and de-energize at point B (34 °C). All drain holes, breathing devices or other ventilation tubes to count the lighthouse, should remain in their original position.
Internal Heat Test
After the test shall be no greater than 3 mm on lens surface deformation and shall meet photometric values applicable to headlamp under test.
Surface of headlight lens that would normally be exposed to dirt from street shall be uniformly sprayed with any specific mixture of dust, water or other materials to reduce photometric output at the test point HV high light (or test point 1/2D-1/2R low light as indicated) at 25 ± 2% of the output originally measured in the photometric test made pursuant to paragraphs S7.4 (i), or S7.5 (a) to (e) of the FMVSS 108 standard.
Lighthouse will be exposed to a temperature of 35 ºC ± 4 °C - 0 °C for one hour and then energize headlamp according to paragraph S8.6 for one hour, allowing the temperature to increase.
Lamp will be returned to ambient temperature of 23 ºC ± 4 °C - 0 °C and relative humidity of 30% ± 10%.
RESULTS AND DISCUSSION
FTIR Characterization
Spectra were first analyzed in terms of their variation with different quantities of recycled material, as shown in Figure 2.

Source: Author’s own elaboration.
Figure 2 FTIR Spectra of extruded PC samples containing recycled PC. a) enlarged view at 2920 cm-1; b) enlarged view at 1610 cm-1; c) enlarged view at 761 cm-1.
As can be observed in Figure 2, all samples present the following spectral characteristics: a triplet signal corresponding to C-O stretching (1165-1228 cm-1); a signal correlated to the C-O bond at 1014 cm-1; a characteristic carbonyl signal at 1774 cm-1; and a typical signal corresponding to aromatic ring vibration (1506 cm-1). These peaks have previously been reported elsewhere (Antonakou & Achilias, 2013; Feller & Bourmaud, 2003).
When all spectra are superposed, no significant changes can be appreciated (Figure 2). In particular, no significant decrease in intensity of signals corresponding to aromatic ring (1506 cm-1) are apparent, a fact in agreement with literature, since aromatic ring is the most stable structure within the PC molecule (Feller & Bourmaud, 2003). Therefore, no appreciable molecular changes take place when a different percentage of recycled PC is employed.
However, some differences can be observed between 2800 cm-1 and 3200 cm-1 region, where bands 2970 cm-1 and 2920 cm-1 are commonly assigned to CH3 and CH2 asymmetrical stretching, respectively. In addition, the band at 2850 cm-1 that corresponds to CH2 symmetrical stretching is also present. In order to analyze these bands, a zoom in this region was applied and presented in Figure 2a.
This enlarged view shows a decrease in signals at 2920 cm-1 and 2970 cm-1 as percentage of recycled PC increases. As mentioned above, these bands are related to asymmetrical stretching of the CH2 and CH3 groups, respectively (Feller & Bourmaud, 2003). Similar behavior was observed for the band at 2850 cm-1. Thus, these changes are directly related to PC degradation and suggest the occurrence of scission at both isopropylidene and carbonate groups, with scission of latter being more feasible considering that samples were processed at temperatures below 400 °C (Yoon, Hunter & Paul, 2003). Nevertheless, these differences are not appreciable.
A further search on the degradation products was carried out involving the analysis of another spectral region; Zoom B) shows a close up of the region between 1500 cm-1 and 1700 cm-1.
It can be observed in this figure that there is no significant increase in signals at 1650 cm-1 and 1610 cm-1, suggesting that degradation of recycled material does not produce any unwanted products such as phenylsalicylate and dihydroxybenzophenone which are detectable in this region (Liang, Cook, Tcharkhtchi & Sautereau, 2011; Okuyama et al., 2003; Pérez et al., 2010). It is also important to note that difference between aromatic ring bands (1506 cm-1) of the raw and highly recycled PC samples was about 3%, indicating that no significant changes took place in terms of the inner structure of the PC chains.
An additional signature of PC degradation is the signal decrease at 761 cm-1, an area which corresponds to the out-of-plane skeletal vibration of -OCOO- and CH deformation. Such a decrease indicates that polymer degradation has taken place in recycled material; this band is shown in detail in zoom C).
However, Figure 2C presents only a small signal decrease, with the overall difference between the signals of the 0% and 100% recycled PC samples being only 3%. This indicates that recycling process does not lead to appreciable PC degradation, since neither significant change in the molecular structure of the PC nor the production of unwanted species was observed.
NMR Characterization
1H NMR: Full 1H spectra of samples are depicted in Figure 3, with chemical shifts corresponding to each proton type presented. In the latter figure following chemical shifts for each of the different kinds of proton present in the PC molecule can be observed: Proton type 1 (δ: 7.15 ppm), type 2 (δ: 7.25 ppm), type 3 (δ: 1.68 ppm), type 4 (δ: 7.26 ppm), and type 5 (δ: 7.18 ppm). These results are in accordance with data reported elsewhere (Bolton & Wooley, 1997; Williams, Cargioli & Hobbs, 1977).

Source: Author’s own elaboration.
Figure 3 Sample 1H NMR Spectra; Spectra labeled as number 1 are that of the sample containing 0% Recycled Polymer, number 2 (20%), number 3 (50%) and number 4 (100%).
13C NMR: Full 13C spectra of samples are depicted in Figure 4, with the chemicals corresponding to the type of carbon presented in same figure as follows: Carbons of type 1 (δ: 120 ppm), type 2 (δ: 128 ppm), type 3 (δ: 30 ppm), type 4 (δ: 128 ppm), type 5 (δ: 120 ppm), type 6 (δ: 149 ppm), type 7 (δ: 148 ppm), type 8 (δ: 42 ppm), and type 9 (δ: 152 ppm). These chemical shifts are in agreement with data reported in literature for this type of macromolecule (Bolton & Wooley, 1997; Lixin, Xiang, Zhang, & Riguang, 2006; Williams et al., 1977; ). We can infer from the presented results that no significant change in macromolecule structure took place with varying recycled PC percentage, since no chemical shift is present that would indicate any possible molecular branching or degradation.
GPC characterization
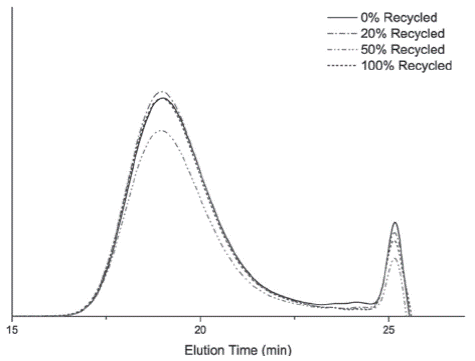
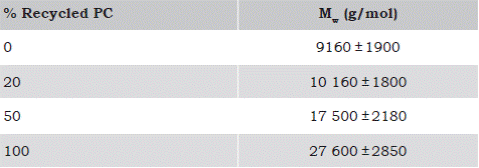
Molecular weight distribution of the PC samples is shown in Figure 5, with Mn, Mw, Peak molar mass (Mp), Z average molar mass (Mz) and Polydispersity Index (PDI) values displayed in Table 1.
Table 1 Variation in molecular weight and PDI with increasing recycled PC percentage.

Source: Author’s own elaboration.
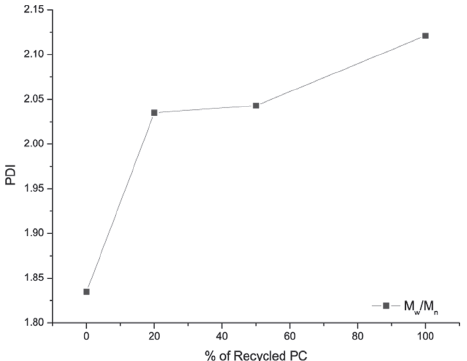
From Figure 5 it can be observed that the amount of additive identified in chromatogram tends to be lower for samples containing recycled materials than for that comprising only virgin material. Analysis of Figures 6, 7 and Table 1 reveals that PDI values increase with rising recycled PC percentage employed for sample extrusion, while molecular weight (Mn) decreases with rising recycled PC percentage. This behavior is related to a slight change in several properties (such as MFI and Storage Modulus which will be discussed later), since recorded change in molecular weight is lower than 10 kg/mol. A similar pattern was observed previously by Ronkay (2013). Since NMR results provide no trace of branching or chemical cross-linking, we can infer that although the post-injection degradation process experienced by polycarbonate chains is not sufficiently significant to cause any PC depolymerization, it is enough to alter the Mn of polymer chains.

Source: Author’s own elaboration.
Figure 6 Variation in molecular weight with increasing recycled PC percentage.
GPC/LS Characterization
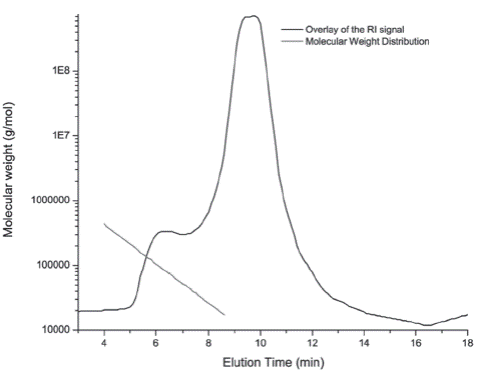
Results of sample characterization using the coupled GPC/LS system are depicted in Table 2, with an illustrative chromatogram of MWD values shown in Figure 8. The latter figure also displays an overlay of RI signal on a plot of molecular weight as a function of retention volume, i.e. a typical chromatogram in the interval from 4 to 9 ml that corresponds to the PC chains. Note that IR signal shows two peaks: the first corresponds to agglomerated PC chains and the second identifies polymeric species. PC mass was also monitored using the same GPC-LS system, with RI detector calibration essential in order to obtain an accurate mass measurement. Variation in the obtained Mw values with recycled PC percentage is presented in Figure 9. Analysis of this figure reveals that Mw values tend to rise with increasing recycled PC percentage. This behavior is essentially the same as that observed during GPC characterization, but more intense due to the gelation of the chains forming physical cross-linking, as represented in Figure 9 by a shoulder in the mass distribution of the chromatogram. This increment in Mw is more marked when using the coupled apparatus than GPC equipment alone due to appearance of gelation of polymer chains, since SLS is able to identify scattering intensities related to chain hydrodynamic volume; these intensities tend to be higher when they are physically cross-linked to one another than when in isolation.
Source: Author’s own elaboration.
Figure 8 Illustrative chromatogram of the polymeric species present in a sample comprising 20% recycled PC.
MFI Characterization
Obtained melt flow index results are shown below in Table 3.
This table clearly reveals how values of melt flow index increase and exceed the limit parameter in samples containing 20% recycled polycarbonate, ultimately reaching 5 points over the limit parameter when 100% recycled material is used. These results are in agreement with data reported elsewhere (Pérez et al., 2010), where MFI values tended to be higher as the PC was injected several times. As also reported previously, MFI depends not only on several factors including Mn, Mass average molar mass (Mw) and PDI, but also considerably on the inner structure of the polymer, which makes it difficult to establish a relationship between MFI and Mn and/or Mw (Bremner, Rudin & Cook, 1990). In our case it is significant that Mn values decrease with increasing MFI.
4.6 DMA Characterization
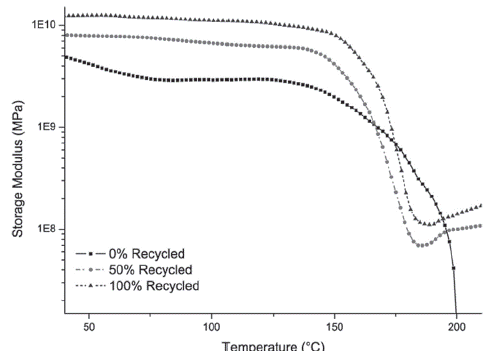
Dynamical mechanical measurements (DMA) were carried out in order to obtain information regarding mechanical behavior of virgin and recycled polycarbonate samples (Figure 10). For recycled samples (100% recycled and 50% recycled), the same behavior reported by Feller & Bourmaud (2003), who studied the mechanical properties of recycled polycarbonate as a function of the number of processing cycles, was observed here. Latter authors observed three different zones during DMA testing, the first of which was related to solid state behavior (at around 40 ºC and 60 ºC). Although no large changes in storage modulus were recorded in this zone, the virgin sample exhibited a slope change from commencement of measurement, indicating a slight modulus decrease. This zone ends at around 140 ºC for all samples (zone II). It is noteworthy that we did not observe the same behavior reported by Feller & Bourmaud (2003) in all samples, with the curve in the present study not exhibiting an increase in the storage modulus before zone III, which is related to polymer flow. At the beginning of the measurement (zone I), storage modulus is higher (by an order of magnitude) in the case of 100% recycled samples. This behavior was also exhibited by the sample composed of 50% recycled material. Latter’s storage modulus value is higher than that of the specimen comprised only of virgin material.
Source: Author’s own elaboration.
Figure 10 Variation in storage modulus as a function of temperature. a) virgin polycarbonate (square), b) 50% w/w recycled polycarbonate (circle) and c) recycled polycarbonate (triangle). The analysis range was from room temperature to 200 ºC.
According to the MFI results described previously, after the first cycle the molecular weight average decrease was probably caused by thermal and oxidative degradation mechanisms taking place at elevated temperatures during melt processing, or hydrolysis reactions occurring at high processing temperatures (around 260 ºC), which can have a negative influence on the final properties of the recycled polycarbonate (Żenkiewicz et al., 2009b; Liang et al., 2011; Okuyama et al., 2003; Bremner, Rudin & Cook, 1990).
To summarize, our results show that storage modulus increases with rising percentage of recycled material, a pattern which may be ascribed to a decrease in molecular weight. Although this theory correlates with data reported by Kayano, Keskkula & Paul (1996). Chrysostomou & Hashemi (1996) observed no significant influence on the storage modulus - finding instead an increase in MFI values. In this study, the recycled polycarbonate was prepared via injection molding.
Behavior of the storage modulus for all samples is depicted in Figure 10.
Figure 11 displays influence of recycled material percentage on glass temperature (Tg) of the samples. Glass transition can be observed at 173 ºC - 177 ºC without any significant changes. These results are in agreement with those reported by Pérez et al. (2010) and Żenkiewickz et al. (2009b), who examined recycled polycarbonate using injection molding and extrusion techniques. After 10 and 6 recycling cycles, respectively, no major changes were observed in glass transition, although an increase in MFI was recorded in both cases. However, when we compare the zone of this transition, the range over which it occurs is broadened as a function of the recycled material percentage, being greater for sample comprising 100% recycled material. These results are similar to those reported by Chrysostomou & Hashemi (1996).
AFM Characterization
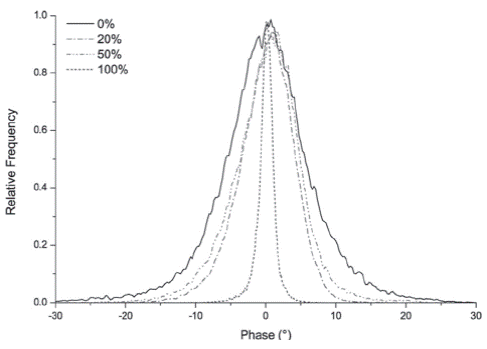
A powerful and widely used tool with which to map compositional variation on heterogeneous surfaces, even in air. Phase imaging AFM is an addition to amplitude modulation AFM, which provides maps of compositional and/or energy dissipation variation at nano-scale spatial resolution. In tapping mode, phase imaging is a powerful technique able to distinguish component systems with different density distributions. A phase contrast image is obtained by plotting phase shift of oscillation while tracking surface topography at fixed amplitude (García, 2010; Magonov, Elings & Whangbo, 1997); these phase images are simultaneously acquired with topography in order to obtain information regarding visco-elasticity of polycarbonates. In tapping-mode AFM, phase angle of probe oscillation is sensitive to stiffness of sample surface and could thus be employed in conjunction with other techniques such as DMA.
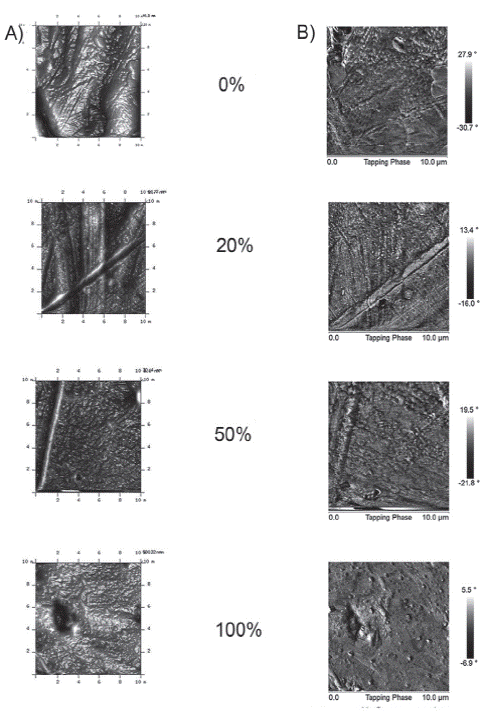
Figura 12 displays the recorded variation in sample surface characteristics with increasing recycled PC percentage. As can be seen from this figure, whereas surface roughness varies little in samples comprising between 0% and 20% recycled PC, those containing 50% and 100% present a much more granulated surface. Table 4 displays the difference between elastic and stiff zones
Source: Author’s own elaboration.
Figure 12 Illustrative topography recorded in a) contact and b) tapping modes, indicating the height variations on the surface of samples with varying % recycled PC.
Table 4 Variation in PC sample roughness with increasing % recycled material.
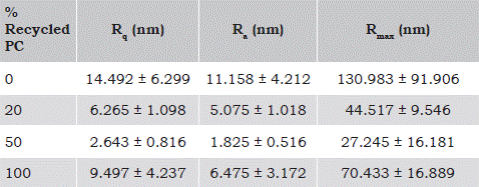
Average roughness (Ra) stands for average roughness; root mean square roughness (Rq) for root mean square roughness and maximum profile height (Rmax) for maximum profile height)
Source: Author’s own elaboration.
In tapping mode analysis, a lower phase angle is associated with materials characterized by lower visco-elasticity (Scott & Bhushan, 2003). As Figure 13 reveals, the recorded specimen phase angle distribution narrowed with increasing recycled PC percentage, a pattern probably related to an increase in sample stiffness. The last observation was concomitant whit DMA results discussed previously. This means that as the amount of recycled PC rises, material exhibits an increasing tendency to fracture easily.
Quality Test
Results of the quality tests made are presented on Table 5.
As you can observe the two reasons that limit the amount of recycled PC are the cosmetic one and the increasing amount of scrap due. These results are clearly related to that minimal change in properties of the PC that allows recycled material to be reused fulfilling the operational requirements that quality tests demands. But a little change in the MWD could be associated with the loss of cosmetic appearance of the molded piece.
CONCLUSIONS
After chemical and physical analysis of specimens containing different percentages of recycled PC, we can conclude that the recycled material percentage does not affect chemical properties of polycarbonate. Based on the obtained FTIR spectra in which no appreciable molecular changes can be observed. This absence of any structural change is corroborated by the recorded 1H and 13C NMR data. Results as a whole indicate that the recycling process is friendly enough to maintain chemical structure of PC chains, with no unwanted species identified via NMR.
GPC experiments show that specimen MWD broadens with an increasing recycled PC percentage, with PDI and molecular weight also varying with quantity of recycled PC added. Specifically, PDI values rise as the amount of recycled PC is increased for sample extrusion, whereas molecular weight decreases with increasing recycled PC percentage. This behavior is related to a slight change in material mechanical properties, since change in the molecular weight is lower than 10 kg/mol. During the GPC/LS experiments an aggregate was observed in the MWD, indicating presence of physical cross-linking.
According to results of AFM analysis, samples containing more recycled material exhibit lower roughness and a narrower phase distribution, which is related to an increase in sample rigidity. This means that as the amount of recycled PC rises, material would tend to fracture more easily with each recycling cycle. These results are in agreement with the increase in the storage modulus obtained via DMA measurements. The interpretation of phase contrast in images generated using AFM tapping mode appears to be an effective tool with which to gain an improved understanding of both structure of polycarbonates, and the effect of stiffness and recycling cycle on the surface of the material.
Despite the increase in polycarbonate stiffness, an increment on melt flow index curve was observed for recycled material. This tendency is associated with the decrease in Mn experienced by PC samples during recycling process.
Finally, we can conclude that one of the main factors limiting the amount of recycled PC, which should be employed in the fabrication of the studied automotive part is operational in nature, with MFI values exceeding the limit parameter as the percentage of recycled material increases. The maximum amount of recycled PC which can be employed without altering the injection/extrusion process parameters is around 20%. A higher percentage would mean the operational parameters of the equipment would become inadequate to deal with the associated increase in MFI values. The other main factor is that higher amounts of recycled PC implies that the cosmetic test is not fulfilled according to the quality standards.


 nueva página del texto (beta)


