


 nova página do texto(beta)
 Inglês (pdf)
 Artigo em XML
 Referências do artigo
 Enviar este artigo por email
 Citado por SciELO
  Similares em
SciELO
Similares em
SciELO 
 Permalink
INTRODUCTION
Air pollutants such as carbon oxide (CO), sulfur dioxide (SO2), nitrogen dioxide (NO2), ozone (O3), particulate matter (PM) with diameters that are 10 µm and smaller (PM10) and PM with diameters of 2.5 µm or less (PM2.5) are a direct consequence of energy and industrial production, as well as other anthropogenic activities (Crutzen 2004), though some pollutants are naturally produced. Air pollutants are regularly monitored because they are associated with adverse health effects, such as respiratory and pulmonary diseases (Olmo et al. 2011; Jephcote and Chen 2013; Khaniabadi et al. 2016).
PM10 and PM2.5 are emitted directly from sources such as fires, construction sites, unpaved roads, power plants, industries, and automobiles (Ulpiani 2021); nonetheless, a major source of PM2.5 is transportation (Li and Managi 2021). It is expected that different areas within a city will have different concentrations of air pollutants (measured in µg/m3) depending on land cover, land use, and the amount of traffic in that given area. The difference in concentration levels of air pollutants in an urban area is known as the urban pollution island (UPI), which is measured to study the spatial distribution of pollutants in such areas (Crutzen 2004).
A rare opportunity to study the effect of anthropogenic sources of PM10 and PM2.5 concentrations happened during the year 2020. As the SARS-CoV-2 (COVID-19) outbreak spread through the world, governments were forced to enact lockdowns to stop the spread of the virus. Lockdowns ended non-essential activities and non-essential travelling, which stopped some anthropogenic sources of air pollution. The effect of lockdown on PM10 and PM2.5 concentrations around the world was summarized by Le et al. (2020). An overall reduction of PM concentrations was reported. However, in Lombardy, Italy, no significant reduction of PM concentrations was found during the lockdown (Rovetta 2021).
In Mexico, the first imported case of COVID-19 was detected on February 27, 2020. By March 18 of the same year 118 cases had been confirmed in the whole country (Suárez et al. 2020). On March 24 the Federal Government enacted the first measures to contain the spread of the virus. At that moment, people were encouraged to work from home, massive events were canceled and people older than 60 were ordered to stay home. On March 26 all non-essential activities, all schools, and all non-essential travels were suspended for a month in all cities, including Mexico City (GCDMX 2020); however, as the pandemic advanced the lockdown was extended for three months and then it was relaxed. As the second wave of the pandemic hit the country in mid-December 2020, the lockdown was again enacted.
In this paper, the effect of lockdown on PM10 and PM2.5 concentrations was studied. Firstly, the spatial distribution of the UPI in Mexico City was assessed with aerosol optical depth (AOD) retrieved from the Moderate Resolution Imaging Spectroradiometer (MODIS). Secondly, PM concentration data for Mexico City from April-May 2015-2019 (no lockdown) was compared to PM concentration data from April-May 2020 (lockdown). A Mann-Whitney U test was used to evaluate the statistical significance of the comparison. This study is relevant to understand the effect of lockdown on air quality and assess whether working from home could improve air quality and reduce PM concentrations in the post-pandemic period.
STUDY AREA AND DATASETS
Study area
Mexico City (19.4978º latitude, -99.1269º longitude) is the capital of Mexico. It is located in the center of the country with an average altitude of 2246 masl. The city and its surrounding municipalities (administered by two neighboring states) are home to 21 804 515 inhabitants (INEGI 2021) and together are called Mexico City Metropolitan Area (MCMA). According to the latest census (2020), the population of Mexico City alone, without the surrounding municipalities, was 9 209 944 inhabitants (INEGI 2021).
Given the size of the city, heavy traffic is a problem in the main roads, especially in the morning and early in the evening, when people commute to and from work. According to the official 2019 mobility report, traffic moves from the periphery to the city center in the morning and on the opposite direction in the evening (SEMOVI 2019). There are industrial parks in the northeast of the city, where most logistic centers are located. Also, Mexico City is a mayor hub for air and road travel in Mexico. The south of the city has bodies of water and green areas. A refinery located 80 km from the city center in Tula, is a major contributor to air pollution due to long-range transport of pollutants (García-Escalante et al. 2014).
Aerosol optical depth
Aerosol optical depth (AOD) is defined as the integral of the vertical aerosol extinction coefficient from the earth surface to the top of the atmosphere (Ranjan et al. 2021). Aerosols are PM or fine particles dispersed in a gas, which can be natural or a result of human activities. For example, fog and dust are natural sources of aerosol, whereas PM and smoke are anthropogenic sources of aerosol. Aerosols are mostly related to PM2.5 concentrations in the atmosphere (Ranjan et al. 2021).
MODIS Terra and Aqua combined Multi-angle Implementation of Atmospheric Correction (MAIAC) Land Aerosol Optical Depth (AOD) at 1-km pixel resolution was used in this study to assess the spatial distribution of aerosol concentrations near the surface. Monthly data from April-May 2015-2019 was used to define the spatial distribution of the UPI in normal conditions. Moreover, the spatial distribution of aerosols during lockdown was observed with MAIAC data from April and May 2020. All data was processed with Google Earth Engine (Gorelic et al. 2017).
Datasets of PM10 and PM2.5 concentrations
Mexico City’s local government operates the Automatic Atmospheric Monitoring Network (RAMA, Red Automática de Monitoreo Atmosférico) with 34 stations throughout the city and neighboring municipalities, which report hourly concentrations of air pollutants such as CO, SO2, NO2, O3, PM10, and PM2.5 (SEDEMA 2021a). In this study, PM (PM10 and PM2.5) concentration data from 12 RAMA stations in the MCMA were processed (four stations reporting both PM2.5 and PM10, five stations only PM10, and three stations only PM2.5 concentrations). Daily average concentrations from April to May 2015-2019 (considered as normal conditions) were compared to daily averages from April to May 2020 to study the effect of lockdown. Figure 1 shows the location of the stations used in this study.
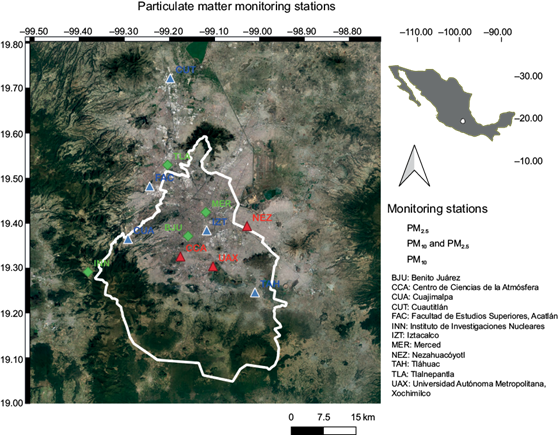
Fig. 1 Location of stations used to monitor particulate matter (PM) concentrations in Mexico City. Stations represented with stars report both PM10 and PM2.5 concentrations. Stations represented with an up-pointing triangle report only PM10 concentrations and stations represented with a left-pointing triangle report only PM2.5 concentrations.
Table I indicates the code given to the RAMA stations, their location and a brief description of their surroundings in terms of anthropogenic sources of air pollutants, such as roads or industrial parks.
TABLE I DESCRIPTION OF STATIONS FROM THE AIR QUALITY MONITORING NETWORK (RAMA) USED IN THIS STUDY.
| Data collected | Code | Location | Type |
| PM10 and PM2.5 | MER | La Merced | Urban center near a bus station with heavy traffic and on the way to the airport. |
| INN | Instituto de Investigaciones Nucleares | Rural area surrounded by mountains and forest. | |
| BJU | Benito Juárez | Densely populated urban center near a park and low-rise buildings, with medium traffic. | |
| TLA | Tlalnepantla | Near two industrial areas. | |
| PM10 | CUT | Cuautitlán | Near a park in the middle of a big industrial area. |
| FAC | FES Acatlán | University campus near a park and low-rise buildings. | |
| TAH | Tláhuac | Rural area surrounded by mountains and low-density residential areas, with some agricultural areas nearby. | |
| IZT | Iztacalco | Urban center near main roads and mid-rise buildings. | |
| CUA | Cuajimalpa | Urban center far away from main roads, with low-rise buildings. | |
| PM2.5 | CCA | Instituto de Ciencias de la Atmósfera y Cambio Climático | University campus with lots of greenery, near low-rise buildings. |
| NEZ | Nezahualcóyotl | Near main roads, densely populated low-rise buildings. | |
| UAX | UAM-Xochimilco | University campus near low-rise buildings, lots of greenery and bodies of water. |
METHODOLOGY
The spatial distribution of aerosols before the pandemic was obtained with AOD-MODIS data from April to May 2015-2019. The effect of the lockdown on aerosol spatial distribution was assessed by comparing the AOD spatial distribution before the pandemic with the AOD spatial distribution from April to May 2020. Furthermore, daily averages of PM10 and PM2.5 concentrations were obtained with ground-based data from April to May 2015-2020 to assess the number of exceedances of maximum PM concentrations established in the national standard for air quality. Then, the concentrations at all stations described in table I were tested for normality using the Shapiro-Wilk test, and, finally, the 2020 PM10 and PM2.5 concentrations were compared to previous years using a Mann-Whitney U test, to find if they were significantly different.
RESULTS
Spatial distribution of aerosol concentrations
As shown in figure 2, aerosol concentrations in April and May 2020 were smaller than in the previous five years. In April 2015-2019, aerosols concentrated mostly on top of Chalco and Granjas-Coapa (marked in figure 2 with a red and black circle, respectively) in the east of the city. However, in April 2020, concentrations on top of Iztapalapa increased and in Chalco they decreased. In May 2020, the spatial distribution of AOD was very similar to the one obtained with data from the previous five years, the only difference was that the values of AOD were lower during May 2020.
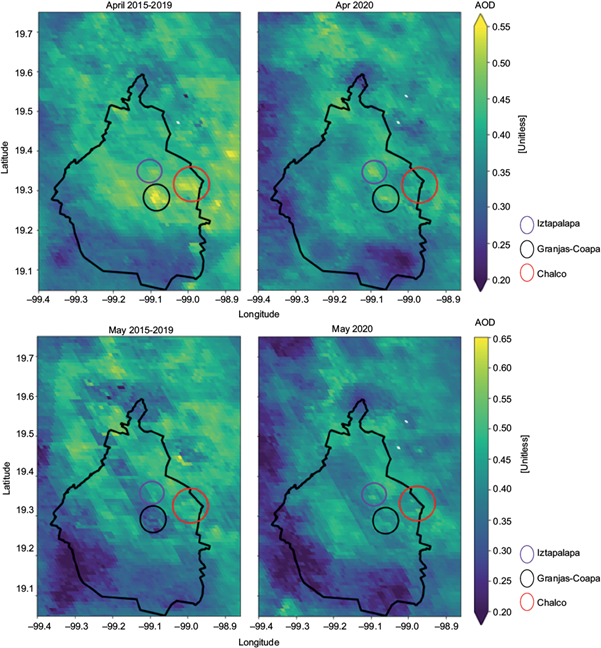
Fig 2 Aerosol optical depth (AOD) measured with the MODIS instrument. It shows the spatial distribution of aerosol concentration during April and May 2015-2019 and April and May 2020 in Mexico City.
Satellite images have shown that there is a mayor aerosol source in Chalco, an open-air gravel pit, which stopped working in April and May 2020 as it was not considered an essential economic activity (Méndez-Astudillo et al. 2022). The shift of AOD concentration towards Iztapalapa (purple circle in figure 2) can be explained because usually, people travel from Iztapalapa to other municipalities for work. However, in April 2020, when mobility was reduced, people stayed in Iztapalapa and only moved within the municipality. According to the latest census, 1.8 million people live in Iztapalapa (INEGI 2020), therefore, it is the most populated zone of Mexico City.
Days over the recommended limit
According to the Mexican Official Standard NOM-025-SSA1-2014 for air quality, the maximum daily average concentration of PM10 should not exceed 75 µg/m3 and PM2.5 should be no more than 45 µg/m3 (SSA 2014). The number of days that each station exceeded the official standard limits in April-May 2015-2020 are shown in figure 3.
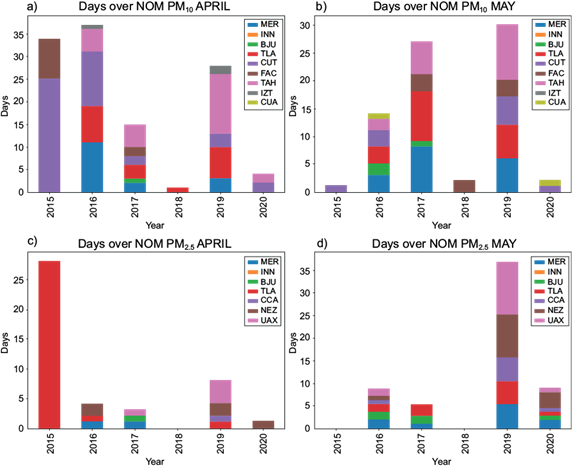
Fig. 3 Days with PM concentrations over the limit established in the Mexican Official Standard (NOM-025-SSA1-2014) for particulate matter (PM). (a) PM10 in April (2015-2020); (b) PM10 in May (2015-2020); (c) PM2.5 in April (2015-2020), and (d) PM2.5 in May (2015-2020). BJU: Benito Juárez, CCA: Instituto de Ciencia de la Atmósfera y Cambio Climático, CUA: Cuajimalpa, CUT: Cuautitlán, FAC: Facultad de Estudios Superiores Acatlán, INN: Instituto de Investigaciones Nucleares, IZT: Iztacalco, MER: Merced, NEZ: Nezahualcoyotl, TAH: Tláhuac, TLA: Tlalnepantla, UAX: Universidad x Metropolitana-Unidad Xochimilco.
In April 2020, stations CUT and TAH exceeded the PM10 limit twice respectively and in May 2020, the PM10 limit was exceeded only once in stations Cuautitlán (CUT) and Caujimalpa (CUA). In April 2020, the PM2.5 limit was exceeded only once in station Nezahualcóyotl (NEZ). In contrast, in May 2020, stations Benito Juárez (BJU), Tlalnepantla (TLA), Instituto de Ciencias de la Atmósfera y Cambio Climático (CCA), and Universidad Autónoma Metropolitana (UAX) exceeded the limit once and stations Merced (MER) and NEZ exceeded the limit two and four times, respectively. In all stations, PM10 limits were exceeded 58 times in April and May 2019 combined and only six times in the same period during 2020. The PM2.5 limits were exceeded 51 times in all stations in April and May 2019 combined whereas they were exceeded only 11 times in April and May 2020 combined. Therefore, other sources of PM such as dust and long-range transport affected PM concentrations during 2020.
Statistical analysis of PM concentrations
The Shapiro-Wilk test indicates whether a distribution is normal or not. In all cases, the test yielded p < 0.05; therefore, none of the distributions is normal and a non-parametric test was chosen for this study.
The Mann-Whitney test is a non-parametric test which was previously used to study air pollutants concentrations (Thomas et al. 2020, Cerrato-Álvarez et al. 2021). The concentration in April and May 2020 has been compared with the concentration of PM during April and May 2015-2019. As seen in figure S1 in the supplementary material, the previous 5-year average concentrations oscillate near an average value which therefore represents concentrations before the lockdown.
Meteorological conditions are assumed to be similar during April 2015-2019 and April 2020 as well as during May 2015-2019 and May 2020. Figure S2 shows the distributions of relative humidity, temperature and wind speed in April and May. These months are very warm and dry, and pollution is usually high (Méndez-Astudillo et al. 2022).
Figure 4a-d shows the distribution of PM10 and PM2.5 concentrations in April and May using averaged data from 2015-2019 and data from 2020. A statistical test was performed to compare both concentrations. The Mann-Whitney test indicated that in most cases, there was a reduction in PM10 and PM2.5 concentrations (p < 0.05). However, station CUA yielded no significant change in the PM10 concentration in April and May 2020 (p = 0.8 and 0.84, respectively). In station NEZ it has been found that the PM2.5 concentration during 2020 was higher (in April and May) than in the previous five years (p < 0.05 when testing for alternative “greater than”). Finally, the PM2.5 concentration in station BJU increased in April 2020 (p < 0.05 when testing for alternative “greater than”) and remained the same in May 2020 (p > 0.05).

Fig. 4 Box plots of (a) PM10 concentrations in April, (b) PM10 concentrations in May, (c) PM2.5 concentrations in April, and (d) PM2.5 concentrations in May, all in Mexico City. Red boxes represent averaged concentrations from 2015-2019 and green boxes concentrations in 2020. BJU: Benito Juárez, CCA: Instituto de Ciencia de la Atmósfera y Cambio Climático, CUA: Cuajimalpa, CUT: Cuautitlán, FAC: Facultad de Estudios Superiores Acatlán, INN: Instituto de Investigaciones Nucleares, IZT: Iztacalco, MER: Merced, NEZ: Nezahualcoyotl, TAH: Tláhuac, TLA: Tlalnepantla, UAX: Universidad Autónoma Metropolitana-Unidad Xochimilco.
The variation in percentage of PM10 and PM2.5 concentrations in April and May due to lockdown is shown in table II.
TABLE II VARIATION IN PERCENTAGES OF PM10 AND PM2.5 DUE TO THE LOCKDOWN.
| MER | INN | BJU | TLA | CUT | FAC | TAH | IZT | CUA | ||
| PM10 | April | -17.69% | -8.17% | -3.46% | -32.62% | -6.22% | -28.71% | -7.53% | -16.15% | 4.36%* |
| May | -23.06% | -4.56% | -8.90% | -27.67% | -10.14% | -78.60% | -77.95% | -19.79% | 7.58%* | |
| CCA | NEZ | UAX | Total PM10 | -19.96% | ||||||
| PM2.5 | April | -17.73% | -16.44% | 5.33% | -40.02% | -6.87% | 18.85% | -16.70% | Total PM2.5 | -10.39% |
| May | -20.40% | -16.68% | 4.20%* | -22.79% | -14.75% | 16.48% | -17.89% | Total | -15.17% |
* p > 0.05, therefore, no statistical significance.
BJU: Benito Juárez, CCA: Instituto de Ciencia de la Atmósfera y Cambio Climático, CUA: Cuajimalpa, CUT: Cuautitlán, FAC: Facultad de Estudios Superiores Acatlán, INN: Instituto de Investigaciones Nucleares, IZT: Iztacalco, MER: Merced, NEZ: Nezahualcoyotl, TAH: Tláhuac, TLA: Tlalnepantla, UAX: Universidad Autónoma Metropolitana-Unidad Xochimilco.
DISCUSSION
According to the Mexico City authorities, only 22 % of PM10 and PM2.5 in the MCMA are locally produced, whereas the rest is produced elsewhere and travels with the wind (SEDEMA 2021b). In the MCMA, 29 % of PM10 is produced by vehicles, 8 % by industry, 2 % by households, and 60 % by other means such as agriculture, construction, and air travel (SEDEMA 2021b). Similarly, 36 % of PM2.5 is produced by vehicles, 15 % by industrial activities, 4 % by households, and 45 % by other means (SEDEMA 2021b).
PM10 stations near industrial parks such as TLA, CUT, and FAC reported decreased concentrations because PM10 sources, namely industry and vehicles, were not active during the lockdown. According to García-Escalante et al. (2014), a major PM10 source is the refinery in Tula, Hidalgo (approximately 80 km north from the city center), which reduced its production capabilities during lockdown because less traffic meant less demand for fuel. Another source of PM10 is caused by aeolian erosion of dry soil in Mexico City (Díaz-Nigenda et al. 2010).
Stations TAH and INN are located in the mountains to the south of the city center. The decrease of PM in INN is due to the decrease of traffic in the highway near the station. The big decrease of PM in station TAH during May is due to stopping biomass burning and the suspension of activities of the open-air gravel pit in Chalco (Méndez-Astudillo et al. 2022) which is detected in TAH due to the wind patterns. IZT and MER are urban stations which reported a significant reduction in PM10 concentrations due to the halt of anthropogenic sources in the urban core of the city. No significant change in station CUA means that most PM10 sources near that station are natural and are not influenced by anthropogenic sources.
PM2.5 concentrations are mostly influenced by traffic and fires. In urban stations MER and UAX traffic was reduced producing a reduction in PM2.5 concentrations. However, in urban station BJU concentrations were found to be higher during April 2020 and no significant change was found in May 2020 due to natural sources of PM2.5 near that station. Also, PM2.5 concentrations were found to be higher during April and May 2020 in station NEZ, located in a very densely populated area with 1.07 million inhabitants (INEGI 2020), which is explained by the fact that people stayed at home or moved only within the municipality during lockdown. Thus, PM2.5 sources stayed near this station.
In this study, overall reductions of 20 and 10.4 % in PM10 and PM2.5 concentrations, respectively, were found in Mexico City (averaging all stations) during lockdown. The results are in line with the general reduction in PM10 and PM2.5 during lockdown based on air quality index (AQI) data found for Mexico City by Fu et al. (2020), who reported decreases of 15.5 and 8.3 % in PM10 and PM2.5 concentrations, respectively, regarding the 2019 AQI for the period March 23 to May 30. Their results agree with those presented here because in both studies a greater reduction was found for PM10 than for PM2.5; however, the extent of the reduction differs, because in this study five years of data were averaged and then compared to the 2020 data.
The impact of the COVID-19 lockdown on air quality has been studied in different regions of the world and, in most cases, a significant reduction of pollutants was found during this period (Faridi et al. 2021). Therefore, this study’s findings agree with previous studies. During the lockdown, ozone levels increased in Mexico City (Peralta et al. 2021), therefore contributing to a reduction in PM10 and PM2.5 concentrations produced by vehicles and transportation in general. In the future, work-from-home policies form companies in Mexico City could be helpful to improve air quality in the MCMA because they will reduce PM produced by vehicles.
CONCLUSIONS
This study shows that the spatial distribution of aerosols in Mexico City was shifted during the lockdown towards the most populated municipalities of the city. The lockdown caused urban stations to detect an average reduction of 15 % in PM10 and PM2.5 concentrations in comparison to concentrations in previous years. On average, total reductions of 20 and 10 % in PM10 and PM2.5 concentrations, respectively, were found for Mexico City.
All PM10 monitoring stations chosen for this study, with the exception of CUA, had a statistically significant reduction of PM concentrations during lockdown. Station CUA has only a few anthropogenic sources nearby and its concentrations are mostly due to long-range transport of PM, which explains this discrepancy.
Similarly, all PM2.5 monitoring stations chosen for this study, with the exception of BJU and NEZ, had significant reductions in PM2.5 concentrations. In April 2020, PM2.5 concentrations in BJU and NEZ (located in the urban core of the city) increased due to the fact that more PM2.5 sources appeared near these stations. During May, the lockdown had no significant effect in PM2.5 concentrations in BJU, and it caused an increase on its concentrations in NEZ. If work-from-home policies are implemented in a regular basis, they would be expected to cause a permanent reduction of PM concentrations in Mexico City, since PM2.5 produced by motor vehicles would be diminished.


