


 text new page (beta)
 English (pdf)
 Article in xml format
 Article references
 Send this article by e-mail
 Cited by SciELO
  Similars in
SciELO
Similars in
SciELO 
 Permalink
INTRODUCTION
Increased nutrient inputs, particularly of nitrogen and phosphorus, are a major cause of water quality and aquatic ecosystem impairment worldwide (Allan et al. 2021). Land use change is an important driver of nutrient pollution, particularly the conversion of native vegetation to conventional agriculture and urban areas, where deforestation, fertilizer application, and wastewater discharge increase nutrient inputs (Dodds 2002, Smith and Schindler 2009, Elosegi et al. 2010). Nutrient enrichment leads to eutrophication that in flowing waters involves increased algae biomass and heterotrophic activity, which can alter macroinvertebrate and fish communities (Dodds and Welch 2000, Dodds 2007). In addition, eutrophication can produce harmful algal blooms, hypoxia, and anoxia, resulting in massive death of organisms and biodiversity loss (Dodds 2007, Rabalais et al. 2010). These impacts can alter ecosystems services provided by streams and rivers, such as water supply due to interference in water purification systems, and water recreational use resulting from aesthetics and water quality change (USEPA 2000, Carpenter et al. 2011).
Development of maximum acceptable levels for nutrients or nutrient criteria is a first step to reduce nutrient inputs and to protect aquatic ecosystems from eutrophication (Dodds and Welch 2000). Nutrient criteria are numeric values allocated to nutrient concentrations, generally for total phosphorus (TP) and total nitrogen (TN), because their role in the limitation of aquatic primary production (USEPA 2000). Criteria can be developed to rivers and streams, lakes, reservoirs, estuaries, coastal areas, and wetlands and must have scientific support and be approved by governmental and water quality authorities (USEPA 2000).
Methods to establish nutrient criteria for streams and rivers, are based on statistical analyses and predictive models. Some methods use nutrient data to determine concentrations at reference conditions that could be used as nutrient criteria (USEPA 2000, Suplee et al. 2007); others use predictive relationships between nutrients and algae (USEPA 2000, Stevenson et al. 2008), aquatic communities (Miltner 2010), and land use (Dodds and Oakes 2004, Cunha et al. 2011). One of the main approaches to establish criteria is the use of reference conditions (USEPA 2000). This method uses the frequency distribution of nutrient data by identifying the 75th percentile of the reference streams (a group of minimally disturbed streams) in a region, or by calculating the 5th to 25th percentiles of the general stream population by assuming that lower concentrations of the general population match concentrations of the reference streams (USEPA 2000). It is assumed that both approaches yield similar results, although the level of human disturbance in the region and the availability of minimally disturbed sites can influence differences between the 25th and the 75th percentiles (Suplee et al. 2007, Herlihy and Sifneos 2008). When developing nutrient criteria, we must consider other factors that can influence nutrient concentrations, such as climate, geology, topography, soils, vegetation, or land use (Smith et al. 2003, Suplee et al. 2007).
Nutrient criteria have been mainly developed for temperate and subtropical streams rivers (USEPA 2000, Cunha et al. 2011), while for tropical systems, where climate and vegetation can influence nutrient levels (Lewis et al. 1999), information is scarce. In Mexico, water quality regulations refer to acceptable maximum limits for pollutant discharge into waterbodies (SEMARNAT 2021). Tese regulations specify 15 mg/L for TP and 25 mg/L for TN (SEMARNAT 2021), which can elevate nutrients above levels that cause excessive algae growth in rivers and streams (Dodds and Welch 2000). Federal regulations (CONAGUA 2009) indicate a TP concentration of 0.05 mg/L to protect freshwater biota, but there are no limits for TN or nitrogen (N) forms. In addition, current limits do not consider regional variation in background nutrient concentrations.
The Grijalva basin is part of the Grijalva-Usumacinta rivers system, the largest in Mexico, and it is located in a high biodiverse region (García-García 2005, Hudson et al. 2005, INE 2007). Nevertheless, the basin has experienced different anthropogenic activities that impact water quality and impair river ecosystems (Plascencia-Vargas et al. 2014, Lázaro-Vázquez et al. 2018). Anthropogenic pressures are linked to rapid population growth, conversion of forest to agriculture and urban areas, and intensive oil drilling and mining activities (Plascencia-Vargas et al. 2014). In addition, four hydroelectric dams were built on the Grijalva mainstream, altering its natural flow regime (Lázaro-Vázquez et al. 2018, Alcérreca-Huerta et al. 2019). Increases in N concentrations have been detected in the lower Grijalva basin, and there is evidence that eutrophication and low oxygen concentrations occur in marine areas under the influence of the Grijalva-Usumacinta discharge into the Gulf of Mexico (Signoret et al. 2006, Machain-Castillo et al. 2020). Thus, actions to reduce nutrient discharges in the Grijalva basin to protect freshwater and marine ecosystems must be implemented. For this reason, the objective of this study was to determine the concentrations of TP and TN from historic data to guide the development of nutrient criteria. We conducted our analysis using the frequency distribution approach based on nutrient data from monitoring stations in the Grijalva basin.
MATERIALS AND METHODS
Study area
The Grijalva river headwaters are located in the highlands of Guatemala and the river runs through Chiapas and Tabasco in Mexico, before joining the Usumacinta river at Tres Brazos to flow into the Gulf of Mexico (Fig. 1). For this study, we considered the portion of the Grijalva basin in Mexican territory that covers 51 943.95 km2 (INEGI 2010). The Grijalva basin is part of the Hydrologic Region No. 30 and is divided into three subregions: Lower (LG), Middle (MG), and Upper Grijalva (UG) (SEMARNAT 2010), and 50 sub-basins (12 in UG, 12 in MG, and 26 in LG) (INEGI 2010). Main land use and cover in the basin are grassland (29.92 %), agriculture (23.96 %), forest (21.78 %), moist forest (16.19 %), marsh (3.74 %), and urban (1.16 %) (INEGI 2016; Table I).
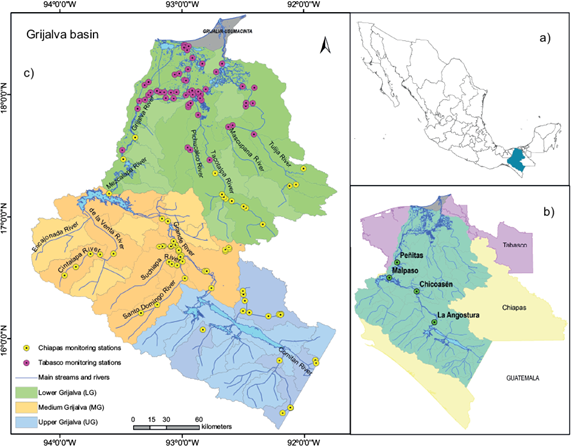
Fig. 1 The Grijalva basin in Mexico: (a) location of the Grijalva basin, (b) the four hydropower dams into the Grijalva basin (green circles) and (c) study monitoring stations, main rivers and subregions.
TABLE I POPULATION AND LAND USE BY SUBREGIONS FOR THE GRIJALVA BASIN IN MEXICO.
| Population | Upper Grijalva | Middle Grijalva | Lower Grijalva | Basin |
| Number of inhabitants | 653 330 | 1 837 459 | 2 891 731 | 5 382 520 |
| Density (inhabitants /km2) | 50 | 110 | 130 | 104 |
| Land use % | ||||
| Agriculture | 30.86 | 24.20 | 19.78 | 23.96 |
| Forest | 36.09 | 29.00 | 8.20 | 21.78 |
| Grassland | 16.73 | 19.05 | 45.51 | 29.92 |
| Marsh | 0.08 | 0.00 | 8.60 | 3.74 |
| Moist forest | 11.10 | 25.78 | 12.12 | 16.19 |
| Urban | 0.76 | 1.58 | 1.09 | 1.16 |
| Waterbodies | 4.28 | 0.27 | 2.22 | 2.12 |
| Others | 0.10 | 0.12 | 2.48 | 1.13 |
Land use data were obtained from INEGI (2016) and population from INEGI (2021).
The basin has a population of 5 382 520 inhabitants and an average population density of 104 inhabitants/km2 according to the 2020 national population census (INEGI 2021). The largest cities are Tuxtla Gutiérrez (578 830 inhabitants) and San Cristóbal de las Casas (183 509 inhabitants) in Chiapas, and Villahermosa (340 060 inhabitants) in Tabasco (INEGI 2021). Municipal wastewater is a major source of pollution in the Grijalva basin (García-García 2005, INE 2007, CONAGUA 2019a), increasing levels of nutrients, fecal coliforms, total suspended solids, biochemical, and chemical oxygen demands (SNIARN-SEMARNAT 2016, CONAGUA 2018a).
General approach
We examined nutrient concentrations among subregions, stream size, and land uses to determine the need to develop criteria for different areas of the basin as recommended by the USEPA (2000). We applied two methods based on frequency distribution to estimate potential nutrient criteria for TP and TN to the whole basin and its subregions, using water quality monitoring data from the Comisión Nacional del Agua (National Water Commission; CONAGUA). We estimated the 75th percentile of the frequency distribution of the reference streams, and percentiles from 5th to 25th of the general stream population. We applied both methods for each subregion and for the whole basin, considering two stream size categories and assuming that environmental conditions were not similar among them. All analyses were performed in RStudio v. 1.3.1093.
Water quality data
Water quality data (physical and chemical parameters, and nutrient concentrations) from 137 monitoring stations in rivers of the Grijalva basin were obtained from CONAGUA. Data were available from January 2012 to December 2018 and had a monthly frequency at some stations, and bimonthly or less at others. Most of the stations included data from periods of low and high flows. For each monitoring station, the subregion, sub-basin, and stream order (1-7) were identified from a hydrographic map (INEGI 2010; Table II). For the analysis, we did not include monitoring stations in lentic systems or near the coast with evidence of saltwater intrusion.
TABLE II NUMBER OF STUDY SUB-BASINS, MONITORING STATIONS, AND STREAM ORDER FOR EACH SUBREGION.
| Subregion | Total sub-basins | Study sub-basins | Study monitoring stations | Stream order of study monitoring stations |
| Upper Grijalva | 12 | 5 (Chiapas) | 16 (Chiapas) | 1, 3, 4, 5, 6 |
| Middle Grijalva | 12 | 7 (Chiapas) | 40 (Chiapas) | 1, 2, 3, 4, 5, 6, 7 |
| Lower Grijalva | 26 | 16 (10 Tabasco, 4 Chiapas, 2 shared) | 69 (56 Tabasco and 13 Chiapas) | 1, 2, 3, 4, 5, 6 |
| 50 | 28 | 125 |
Database contained alphanumeric data for some water quality records such as < LD (lower than detected) and < CMC (lower than minimum measurable), for which we used values equal to 50 % of the reported detection limit (Suplee et al. 2007, Hites 2019). Records reported as ND (non-determined) and NE (non-estimated) were removed because they represented less than 2 % of whole database (Hites 2019). We identified and assessed suspected outliers by monitoring station to avoid erroneous criterion from atypical data. We did not remove outliers, except in cases in which concentrations were atypically higher (USEPA 2010, Helsel et al. 2020). After data examination, the database had 125 monitoring stations with 3814 records for TP and 3918 records TN.
Nutrient comparisons among stream size and subregions
We grouped streams in two size categories: low-order (1, 2, and 3) and high-order streams (4, 5, 6, and 7). We compared TP and TN concentrations among subregions and between size categories by using ADONIS (permutation ANOVA), a non-parametric permutation test in the vegan package of R (Oksanen 2015). When interactions were significant, we applied pairwise comparisons using permutation F test to compare the effects of stream size categories into each subregion. We used ADONIS, because data did not meet the normality assumption of ANOVA (Oksanen 2015).
Land use data
We determined land use and land cover at the reach scale from INEGI (2016). We used the following land use categories: agriculture, forest, mangrove, grassland, marsh, and urban. Dominant land use at the reach scale for each sampling station was determined by establishing a 2 km buffer around the monitoring station. To explore the relationship between land use and nutrient concentrations, we compared concentrations among the most dominant land use categories (agriculture, forest, grassland, marsh, and urban) at the reach scale and among subregions by applying ADONIS. When the interaction was significant, we conducted pairwise comparisons using permutation F test to compare treatment effects.
Reference streams approach
We identified potential reference sites by subregion through two methods: the best professional judgment (BPJ) and the presence of forest cover as dominant land use. BPJ is used when minimally impacted sites are difficult to find (Cunha et al. 2011), and forested sites usually have optimal conditions to be considered as reference sites (USEPA 2000). By applying BPJ, we selected the less impacted streams based on reach land use and water quality (physical and chemical parameters, nutrients concentrations, biochemical oxygen demand, and faecal coliforms) (USEPA 2000, 2010, Cunha et al. 2011). We also selected streams with forest cover at the reach scale to examine its potential use as reference streams. Reference streams for the whole basin were estimated pooling the reference streams selected for each subregion. We calculated the 75th percentile of the frequency distribution of both reference streams (BPJ and forested reference streams) for TP and TN, for each subregion, and for the whole basin.
General stream population approach
We used the whole population of streams and rivers for calculating the concentrations at the 5th and 25th percentiles for TP and TN, for each stream size category, subregion, and for the whole basin. Furthermore, we applied the trisection method (1/6th or 16.7th percentile) also using the whole dataset. This method is recommended when working in impacted regions, where pristine or reference sites are difficult to achieve (Cunha et al. 2011, Huo et al. 2018).
RESULTS
Nutrient concentrations
TP concentrations ranged from 0.01 to 12.18 mg/L. Higher concentrations were observed in the MG subregion (Alto Grijalva, Cintalapa, De la Venta, Santo Domingo, Suchiapa, and Tuxtla Gutiérrez sub-basins; p < 0.005). There were significant differences in TP concentrations between low-order and high-order streams in LG and MG subregions (p = 0.001; Table III). Greater concentrations were detected in low-order streams in the MG subregion. Low-order streams showed significant differences among subregions, with higher concentrations in the MG subregion than in the LG and UG subregions (p = 0.001). High-order streams also revealed higher concentrations in the MG subregion and lower concentrations in the LG subregion (p = 0.001).
TABLE III NUTRIENT CONCENTRATIONS (mg/L) BY STREAM ORDER CATEGORY FOR EACH SUBREGION AND FOR THE WHOLE BASIN.
| TP | TN | ||||||||
| UG | MG | LG | basin | UG | MG | LG | basin | ||
| Low-order stream | median | 0.08 | 1.32 | 0.07 | 0.08 | 1.38 | 5.49 | 0.96 | 1.06 |
| mean ± SD | 0.20 ± 0.37 | 1.82 ± 2.20 | 0.26 ± 0.47 | 0.47 ± 1.07 | 1.51 ± 1.00 | 12.03 ± 14.37 | 1.62 ± 2.16 | 3.05 ± 6.72 | |
| minimum | 0.01 | 0.01 | 0.01 | 0.01 | 0.07 | 0.07 | 0.07 | 0.07 | |
| maximum | 2.18 | 10.79 | 4.21 | 10.79 | 5.93 | 71.05 | 20.81 | 71.05 | |
| High-order stream | median | 0.08 | 0.17 | 0.08 | 0.10 | 1.24 | 1.37 | 0.87 | 1.07 |
| mean ± SD | 0.31 ± 0.62 | 0.50 ±1.05 | 0.13 ± 0.19 | 0.30 ± 0.74 | 1.51 ± 1.21 | 2.90 ± 6.32 | 1.05 ± 0.69 | 1.87 ± 4.18 | |
| minimum | 0.01 | 0.01 | 0.01 | 0.01 | 0.02 | 0.02 | 0.03 | 0.02 | |
| maximum | 5.22 | 12.18 | 2.55 | 12.18 | 10.59 | 60.51 | 7.53 | 60.51 | |
| All stream orders | median | 0.08 | 0.18 | 0.08 | 0.10 | 1.28 | 1.44 | 0.90 | 1.07 |
| mean ± SD | 0.28 ± 0.57 | 0.68 ± 1.34 | 0.19 ± 0.34 | 0.36 ± 0.86 | 1.51 ± 1.16 | 4.10 ± 8.44 | 1.29 ± 1.54 | 2.24 ± 5.13 | |
| minimum | 0.01 | 0.01 | 0.01 | 0.01 | 0.02 | 0.02 | 0.03 | 0.02 | |
| maximum | 5.22 | 12.18 | 4.21 | 12.18 | 10.59 | 71.05 | 20.81 | 71.05 | |
UG: Upper Grijalva, MG: Middle Grijalva, LG: Lower Grijalva, TP: total phosphorus, TN: total nitrogen.
TN concentrations varied from 0.02 to 71.05 mg/L. Higher concentrations were found in low-order streams and in the MG subregion (Alto Grijalva and Tuxtla Gutiérrez sub-basins; p < 0.005). For TN concentrations, there were also significant differences between low-order and high-order streams in the LG and MG subregions (p = 0.001; Table III). For low-order streams, concentrations were higher in the MG subregion than in the LG and UG subregions (p = 0.001). For high-order streams, concentrations were higher in the MG subregion and lower in the LG subregion (p = 0.001).
Land uses
The most predominant land use in the Grijalva basin was grassland (29.92 %). Forest and agriculture were dominant in the MG (29 and 24.20 %, respectively) and UG subregions (36.09 and 30.86 %, respectively), while grassland was in the LG subregion (45.51 %; Table I). In the LG subregion, forested reaches (0.08 ± 0.15 mg/L) had lower TP concentrations than the other land uses (p < 0.012; Table IV); grassland (0.16 ± 0.26 mg/L) and marsh (0.16 ± 0.24 mg/L) showed lower concentrations than agriculture (0.21 ± 0.41 mg/L) and urban (0.25 ± 0.46 mg/L; p < 0.02); and agriculture had lower concentrations than urban (p < 0.036). In the MG subregion, the TP highest concentration was in urban areas (0.95 ± 1.68 mg/L; p < 0.016). In the UG subregion, the TP concentrations were higher in grassland (0.52 ± 0.91 mg/L; p < 0.04).
TABLE IV NUTRIENT CONCENTRATIONS (mg/L) FOR EACH LAND USE CATEGORY AT THE REACH SCALE BY SUBREGIONS AND FOR THE WHOLE BASIN.
| Agriculture | Forest* | Grassland | Marsh | Urban | ||
| TP | UG | 0.24 ± 0.49 | 0.27 ± 0.57 | 0.52 ± 0.91 | - | - |
| MG | 0.32 ± 0.47 | 0.30 ± 0.68 | 0.39 ± 0.58 | - | 0.95 ± 1.68 | |
| LG | 0.21 ± 0.41 | 0.08 ± 0.15 | 0.16 ± 0.26 | 0.16 ± 0.24 | 0.25 ± 0.46 | |
| basin | 0.25 ± 0.45 | 0.17 ± 0.43 | 0.19 ± 0.37 | 0.16 ± 0.24 | 0.76 ± 1.49 | |
| TN | UG | 1.48 ± 1.01 | 1.28 ± 0.48 | 1.79 ± 1.92 | - | - |
| MG | 1.68 ± 1.55 | 1.48 ± 0.97 | 1.17 ± 0.70 | - | 6.04 ± 10.82 | |
| LG | 1.53 ± 2.34 | 1.10 ± 0.67 | 1.13 ± 0.80 | 1.15 ± 0.78 | 1.42 ± 1.28 | |
| basin | 1.56 ± 1.83 | 1.22 ± 0.72 | 1.18 ± 0.94 | 1.15 ± 0.78 | 4.77 ± 9.46 |
Data shown include mean ± SD.
* For this analysis, forest and moist forest were studied together; - the subregion did not contain this land use.
UG: Upper Grijalva, MG: Middle Grijalva, LG: Lower Grijalva, TP: total phosphorus, TN: total nitrogen.
In the LG subregion, TN concentrations in forest (1.10 ± 0.67 mg/L), grassland (1.13 ± 0.80 mg/L) and marsh (1.15 ± 0.78 mg/L) reaches were lower than in the other land uses (p < 0.04), while in agriculture (1.53 ± 2.34 mg/L) they were higher than in urban (1.42 ± 1.28 mg/L; p < 0.024). In the MG subregion, urban concentrations (6.04 ± 10.82 mg/L) were significantly higher than in other land uses (p = 0.004). In the UG subregion, the TN highest concentration was in grassland (1.79 ± 1.92 mg/L; p = 0.004).
Reference streams
From the 125 monitoring stations in the Grijalva basin, we selected nine reference streams based on BPJ (two in UG, two in MG, and five in LG subregion) and five forested reference streams (one in UG, one in MG, and three in the LG subregion). Only two forested reference streams were included in the BPJ group for the LG subregion. Forested reference streams for the LG subregion were found in Chiapas.
TP and TN concentrations from BPJ reference streams were lower than concentrations obtained for each land use category at the reach scale (agriculture, forest, grassland, marsh, and urban; Table IV). The highest TP concentration was in the MG subregion for both BPJ (0.18 ± 0.31 mg/L) and forested reference streams (0.30 ± 0.68 mg/L; Table V). The highest TN concentration (1.48 ± 0.97 mg/L) was found in the MG subregion in forested reference streams.
TABLE V NUTRIENT CONCENTRATIONS (mg/L) OF REFERENCE STREAMS FOR EACH SUBREGION AND THE WHOLE BASIN.
| TP | TN | ||||||||
| UG | MG | LG | basin | UG | MG | LG | basin | ||
| Best professional judgement (BPJ) reference streams | median | 0.06 | 0.11 | 0.06 | 0.06 | 0.79 | 0.88 | 0.81 | 0.81 |
| mean ± SD | 0.16 ± 0.28 | 0.18 ± 0.31 | 0.12 ± 0.20 | 0.14 ± 0.24 | 1.02 ± 0.84 | 0.99 ± 0.67 | 0.93 ± 0.58 | 0.96 ± 0.66 | |
| minimum | 0.01 | 0.01 | 0.01 | 0.01 | 0.14 | 0.02 | 0.11 | 0.02 | |
| maximum | 1.39 | 2.11 | 1.39 | 2.11 | 5.11 | 3.56 | 3.62 | 5.11 | |
| Forested reference streams | median | 0.07 | 0.12 | 0.03 | 0.05 | 1.37 | 1.23 | 1.01 | 1.13 |
| mean ± SD | 0.27 ± 0.57 | 0.30 ± 0.68 | 0.08 ± 0.15 | 0.17 ± 0.43 | 1.28 ± 0.48 | 1.48 ± 0.97 | 1.10 ± 0.67 | 1.22 ± 0.72 | |
| minimum | 0.01 | 0.01 | 0.01 | 0.01 | 0.26 | 0.48 | 0.23 | 0.23 | |
| maximum | 2.32 | 3.46 | 1.08 | 3.46 | 2.11 | 3.82 | 4.09 | 4.09 | |
Data shown include median, mean ± SD, minimum, and maximum.
UG: Upper Grijalva, MG: Middle Grijalva, LG: Lower Grijalva, TP: total phosphorus, TN: total nitrogen.
TP concentrations at the 75th percentile were higher in BPJ reference streams than in forested reference streams in the LG and UG subregions (0.13 and 0.18 mg/L, respectively; Table VI), while greater values occurred in forested reference streams in the MG subregion (0.25 mg/L). TN concentrations were higher in forested reference streams than in BPJ sites in each subregion. TP and TN concentrations at the 75th percentile for both BPJ (0.13-0.19 and 1.16-1.31 mg/L for TP and TN, respectively) and forested streams (0.09-0.25 and 1.35-1.58 mg/L for TP and TN, respectively; Table VI), were higher than median concentrations of the general stream population (0.08-0.18 and 0.90-1.44 mg/L for TP and TN, respectively; Table III).
TABLE VI NUTRIENT CONCENTRATIONS (mg/L) AT THE 75th PERCENTILE FOR THE SELECTED REFERENCE STREAMS BASE ON BEST PROFESSIONAL JUDGMENT (BPJ) AND FOREST COVER FOR THE GRIJALVA BASIN AND ITS SUBREGIONS.
| Reference streams | |||
| 75th percentile by BPJ reference streams | 75th percentile by forested reference streams | ||
| TP | UG | 0.18 | 0.14 |
| MG | 0.19 | 0.25 | |
| LG | 0.13 | 0.09 | |
| basin | 0.15 | 0.13 | |
| TN | UG | 1.16 | 1.58 |
| MG | 1.31 | 1.53 | |
| LG | 1.20 | 1.35 | |
| basin | 1.24 | 1.47 | |
UG: Upper Grijalva, MG: Middle Grijalva, LG: Lower Grijalva, TP: total phosphorus, TN: total nitrogen.
General stream population
TP concentrations at 5th and 16.7th percentiles were similar between low-order and high-order streams, while concentrations at the 25th percentile were higher in low-order streams in the MG subregion (Table VII). In the combined stream size category, greater concentrations were observed in the MG subregion and lower concentrations in the UG subregion. At the basin scale, 107 monitoring stations (85.6 %) had values below the 25th percentile (Fig. 2). When analyzed by subregions, 63 stations (91.3 %) in the LG subregion had concentrations below this percentile while six stations (two in Carrizal, one in Cunduacán, one in Cuxcuchapa, one in Pichucalco, and one in Samaria sub-basins) always exceeded (Fig. 3). In the MG subregion, 36 stations (90 %) had data below the 25th percentile while concentrations in four stations (two in Alto Grijalva and two in Tuxtla Gutiérrez sub-basins) always exceeded (Fig. 3). In the UG subregion, all 16 stations showed concentrations below the 25th percentile. When we analyzed concentrations at the 5th percentile at the basin scale, only 52 monitoring stations (41.6 %) had data below this percentile, while by subregions 12 stations in UG, 21 in MG, and two in LG had concentrations below the 5th percentile.
TABLE VII NUTRIENT CONCENTRATIONS (mg/L) AT THE 5th, 16.7th, AND 25th PERCENTILES USING THE GENERAL STREAM POPULATION APPROACH FOR THE GRIJALVA BASIN AND ITS SUBREGIONS.
| General stream population | ||||||||
| TP | TN | |||||||
| 5th percentile | 16.7th percentile | 25th percentile | 5th percentile | 16.7th percentile | 25th percentile | |||
| Low-order stream | UG | 0.01 | 0.02 | 0.03 | 0.31 | 0.53 | 0.80 | |
| MG | 0.02 | 0.05 | 0.13 | 0.33 | 0.75 | 1.07 | ||
| LG | 0.01 | 0.04 | 0.04 | 0.34 | 0.52 | 0.61 | ||
| basin | 0.01 | 0.03 | 0.04 | 0.33 | 0.54 | 0.65 | ||
| High-order stream | UG | 0.01 | 0.02 | 0.03 | 0.31 | 0.66 | 0.84 | |
| MG | 0.02 | 0.06 | 0.08 | 0.38 | 0.63 | 0.78 | ||
| LG | 0.02 | 0.04 | 0.05 | 0.36 | 0.51 | 0.62 | ||
| basin | 0.02 | 0.04 | 0.05 | 0.35 | 0.57 | 0.69 | ||
| All stream orders | UG | 0.01 | 0.02 | 0.03 | 0.30 | 0.64 | 0.83 | |
| MG | 0.02 | 0.06 | 0.08 | 0.37 | 0.64 | 0.80 | ||
| LG | 0.01 | 0.04 | 0.05 | 0.35 | 0.52 | 0.62 | ||
| basin | 0.01 | 0.04 | 0.05 | 0.35 | 0.56 | 0.68 | ||
UG: Upper Grijalva, MG: Middle Grijalva, LG: Lower Grijalva, TP: total phosphorus, TN: total nitrogen
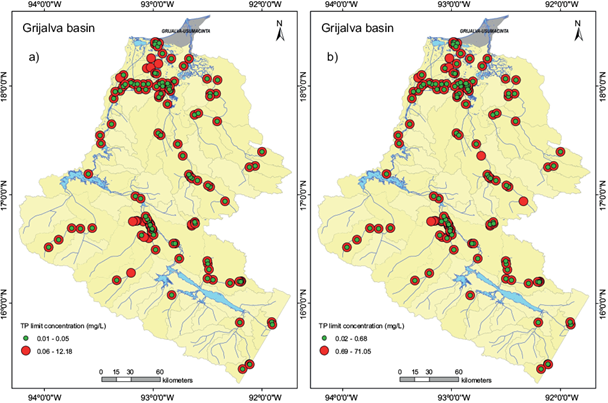
Fig. 2 Nutrient concentrations (mg/L) for the Grijalva basin using 25th percentile approach. Green circles represent monitoring sites that show nutrient concentration values in the 2012-2018 period, equal or lower than the limit concentration for (a) total phosphorus (TP) and (b) total nitrogen (TN). Red circles represent sites with higher values than the limit concentration.
Similar TN concentrations between stream size categories were obtained for the 5th, 16.7th, and 25th percentiles at LG subregion. Higher values were obtained in low-order streams at the MG subregion (Table VII). When the two stream size categories were combined, greater concentrations were in the MG and UG subregions at the 16.7th and 25th percentiles, while higher concentrations at the 5th percentile were in the MG subregion. At the basin scale, 113 monitoring stations (90.4 %) exhibited values below the 25th percentile (Fig. 2). In the analysis by subregions, 63 stations (91.3 %) in the LG subregion had concentrations below this percentile while concentrations in six stations (one in Almandro, one in Carrizal, one in Chacté one in Cunduacán, one in Cuxcuchapa, and one in Samaria sub-basins) always exceeded (Fig. 3). In the MG subregion, 34 stations (85 %) had data below the 25th percentile while all concentrations at six stations (two located in Alto Grijalva, one in Suchiapa, and three in Tuxtla Gutiérrez sub-basins) were above this percentile (Fig. 3). In the UG subregion, all 16 stations showed values below this percentile. When we analyzed concentrations at 5th percentile at the basin scale, there were 76 monitoring stations (61 %) that had values below this percentile, while by subregions, 14 stations in UG, 23 stations in MG, and 38 in LG had concentrations below this percentile.
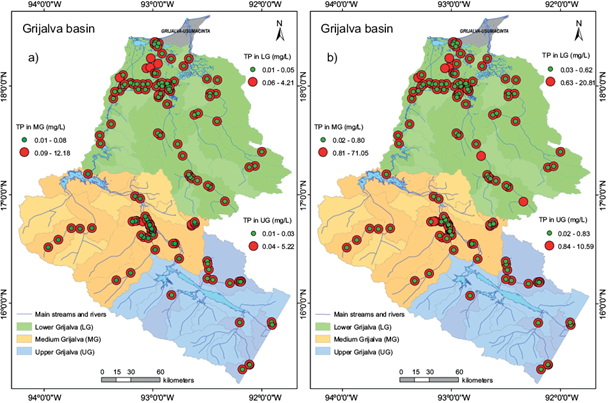
Fig. 3 Nutrient concentrations (mg/L) for each subregion of the Grijalva basin using the 25th percentile approach. Green circles represent monitoring sites that show nutrient concentration values in the 2012-2018 period, equal or lower than the limit concentration for (a) total phosphorus (TP) and (b) total nitrogen (TN). Red circles represent sites with higher values than the limit concentration.
DISCUSSION
Nutrient concentrations in the Grijalva basin
Nutrient concentrations in the Grijalva basin showed differences between stream size, land use, and subregions. Concentrations were greater for TP and TN in low-order streams, supporting other research findings that have documented a decline in nutrient concentration as stream size increases (Alexander et al. 2000, Smith et al. 2003, Binkley et al. 2004, McDowell et al. 2017). This pattern can be related to greater nutrient inputs from groundwater in small streams, particularly to those located in agricultural areas and to the cumulative effect of nutrient removal processes along the fluvial network (Smith et al. 2003, Kang et al. 2008). In addition, tropical forested streams can show high nitrate concentrations because of high nitrification rates in soils (Neill et al. 1997, Espinoza-Toledo et al. 2021) that can also explain higher TN concentrations in low-order streams of the Grijalva basin.
In forested reaches, nutrient concentrations were lower than in other land uses, as expected due to lower inputs from anthropogenic activities (Poor and McDonnell 2007, Cunha et al. 2011, de Mello et al. 2020). Forest vegetation improves water quality through filtration, absorption, and interception of runoff nutrients (Li et al. 2016, Duffy et al. 2020, de Mello et al. 2020). Agriculture and grassland areas showed greater concentrations than forest areas, likely explained by the application of fertilizers and inputs of livestock waste (Aryal et al. 2012, Jones et al. 2019).
Higher nutrient concentrations were found in urban areas, probably related to domestic and industrial wastewater inputs. Detergents containing phosphates are still used in Mexico, increasing phosphorous (P) levels in wastewater discharges (SNIARN-SEMARNAT 2013). In addition, in Chiapas and Tabasco only 30.4 and 36.3 %, respectively, of domestic wastewater are treated essentially by primary treatment because secondary treatment is scarce (CONAGUA 2018b, 2019a), indicating that streams and rivers receive a large proportion of untreated wastewater (INE 2007). Nutrients levels in untreated wastewater can be as high as 4-12 mg/L for TP and 20-70 mg/L for TN, and concentrations in effluents from secondary wastewater treatments plants (WWTP) using activated sludge can be 4-10 mg/L for TP and 15-35 mg/L for TN (Carey and Migliaccio 2009). Low proportion of treated wastewater or inefficient treatment processes can increase nutrient discharge into streams and rivers (INE 2007). In addition, the expansion of urban areas can increase riparian deforestation, decrease infiltration rates, and modify stream and river channels, affecting nutrient dynamics (Carey and Migliaccio 2009, Carpenter et al. 2011, McMillan et al. 2014).
The MG subregion showed greater mean TP concentrations, likely related to the presence of large cities such as Tuxtla Gutiérrez and San Cristóbal de Las Casas (INEGI 2021). High TP concentrations in MG (Table III) were similar to concentrations in untreated wastewater (Rivera-Vázquez et al. 2007, Carey and Migliaccio 2009). The median concentrations in UG and LG subregions (Table III) were in the range of those estimated by Smith et al. (2003) for US streams and rivers and similar to values reported for rivers draining urban and agricultural catchments in Mexico (Jujnovsky et al. 2010, Arellano-Aguilar et al. 2017, Fregoso-López et al. 2020). We expected greater TP concentrations at the MG subregion because of urban wastewater inputs, but median TP concentrations at the LG subregion were unexpectedly lower, despite the greater population density and the presence of a large city (Villahermosa). The location of hydroelectric dams upstream (Fig. 1) and the greater number of WWTP in LG can be related to this result. Dams can retain sediments and nutrients, particularly P (van Cappellen and Maavara 2016); thus, sites located downstream from the dams can be affected by this retention. The LG subregion has more WWTP than MG (70 in LG and seven in MG) (CONAGUA 2018b) that can contribute to lower P inputs into the rivers. Lázaro-Vázquez et al. (2018) detected an increase in nitrate concentration between 2000 and 2016 in LG but not in TP, suggesting that some removal processes, probably by the dams and the wastewater treatment, prevent an increase in P concentrations. In the UG subregion, higher TP concentrations were found in grassland areas, probably related to fertilizer use, soil compaction, and livestock waste (Capece et al. 2007, Aryal et al. 2012).
TN showed very high concentrations at the MG subregion in urban reaches, similar to values reported for untreated wastewater (Andersen et al. 2004, Carey and Migliaccio 2009). This subregion also had intensive agricultural areas, which can provide N inputs from fertilizer application (Blann et al. 2009, Cunha et al. 2011, de Mello et al. 2020). In the LG subregion, high TN concentrations were found in agricultural areas, supporting the association between this land use and N inputs (Kang et al. 2008, Billy et al. 2013). In the UG subregion, in addition to agricultural areas, cattle production probably explains greater TN concentrations due to increased inputs of N from livestock waste (Agouridis et al. 2005, Jones et al. 2019).
Frequency distribution methods for nutrient criteria
The use of reference streams for establishing nutrient criteria assumes that this group of rivers represents ecosystems with less human disturbance in the basin (USEPA 2000). Average concentrations obtained from BPJ and forested reference streams were lower (Table V) than in agriculture and urban areas (Table IV) and in the general stream population (Table III). However, concentrations at the 75th percentile of the reference streams (Table VI) were higher than values estimated by the 5th and 25th percentiles of the general stream population (Table VII). USEPA (2000) suggests that concentrations at the 75th percentile of the reference streams and at the 25th percentile of the general stream population can be similar, but several studies have found greater concentrations at the 75th percentile than at the 25th percentile (Suplee et al. 2007, Herlihy and Sifneos 2008, Evans-White et al. 2013; Table VIII). For US ecoregions, Suplee et al. (2007) report that concentrations at the 75th percentile corresponded to percentiles from 4th to 97th of the general stream population, indicating that for some ecoregions, percentiles are not similar. For the Grijalva basin, nutrient concentrations at the 75th percentile of the reference streams corresponded to percentiles from 59th to 64th of the general stream population, suggesting that both distributions are relative similar and probably disturbed streams were included in the reference group (Smith et al. 2003). Nutrient concentrations at the 75th percentile of the reference streams were higher than reported in some nutrient criteria studies, but were also in the range of others (Smith et al. 2003, Suplee et al. 2007, Hsieh et al. 2016; Table VIII). Nutrient concentrations at the 75th percentile of forested reference streams were also higher than those reported by Espinoza-Toledo et al. (2021) for forested streams in LG (0.033 and 0.303 mg/L for TP and TN, respectively).
TABLE VIII ESTIMATED NUTRIENT CONCENTRATIONS (mg/L) FOR SEVERAL RIVERS AND STREAMS BASED ON THE FREQUENCY DISTRIBUTION METHOD.
| Method | Nutrient concentration (mg/L) | Region | Reference | |
| TP | TN | |||
| Percentile 75th of reference streams | 0.09-0.25 | 1.16-1.58 | Tabasco and Chiapas, Mexico | This study |
| 0.035 | 1.22 | Taipei, Taiwan | Hsieh et al. (2016) | |
| 0.003-0.17 | 0.09-1.30 | Montana, USA | Suplee et al. (2007) | |
| 0.016-0.075 | 0.058-0.650 | Conterminous USA | Smith et al. (2003) | |
| 0-0.03 | 0-0.75 | Conterminous USA | Rohm et al. (2002) | |
| 0.0102-0.181 | 0.148-2.50 | Conterminous USA | Herlihy and Sifneos (2008)* | |
| Percentile 25th of general stream population | 0.03-0.08 | 0.62-0.83 | Tabasco and Chiapas, Mexico | This study |
| 0.01-0.02 | 0.05-0.61 | Montana, USA | Suplee et al. (2007) | |
| 0.019 | 1.50 | Taipei, Taiwan | Hsieh et al. (2016) | |
| 0-0.10 | 0-3.00 | Conterminous USA | Rohm et al. (2002) | |
| 0.010-0.128 | 0.12-2.18 | Conterminous USA | Herlihy and Sifneos (2008)** | |
| 0.003-0.147 | 0.0725-1.86 | Conterminous USA | Herlihy and Sifneos (2008)*** | |
| 0.02-0.151 | 0.215-1.102 | Kansas, USA | Dodds and Oakes (2004) | |
| Trisection (percentile 16.7th) of general stream population | 0.02-0.06 | 0.52-0.64 | Tabasco and Chiapas, Mexico | This study |
| 0.03 | 0.31 | São Paulo, Brazil | Cunha et al. (2011) | |
| Median of reference streams | 0.03-012 | 0.79-1.37 | Tabasco and Chiapas, Mexico | This study |
| 0.04 | 0.34 | São Paulo, Brazil | Cunha et al. (2011) | |
| 0.002-0.60 | 0.06-0.78 | Montana, USA | Suplee et al. (2007) | |
| 0.013-0.060 | 0.044-0.561 | Conterminous USA | Smith et al. (2003) | |
| Median of general stream population | 0.08-0.18 | 0.90-1.44 | Tabasco and Chiapas, Mexico | This study |
| 0.01-0.05 | 0.08-0.90 | Montana, USA | Suplee et al. (2007) | |
| 0.12 | 0.90 | São Paulo, Brazil | Cunha et al. (2011) | |
| 0.018 | 0.480 | Conterminous USA | Rohm et al. (2002) | |
*Based on the Environmental Monitoring and Assessment Program (EMAP); **based on the US Environmental Protection Agency (USEPA); ***based on the Wadeable Stream Assessment (WSA).
TP: total phosphorus, TN: total nitrogen.
Human pressures in the Grijalva basin-the location of the monitoring sites-and the low number of reference streams could influence the high concentrations obtained in the selected reference streams. In basins with a wide range of human disturbances such as the Grijalva, reference sites selected based on least-disturbed conditions will not represent minimally disturbed conditions (Stoddard et al. 2006) and rather reflect the consequences of human activities. In this study, reference streams probably included impacted streams, especially in the MG subregion, due to the unavailability of monitoring sites located in rivers with low human impacts. This potentially explains higher concentrations at the 75th percentile of the reference streams than at the 25th of the general population (Evans-White et al. 2013). In addition, estimates based on a small number of reference sites could be affected by natural variability in topography, geology, vegetation, soils, and atmospheric deposition (Smith et al. 2003, Suplee et al. 2007), and do not represent realistic values of the reference conditions (Herlihy and Sifneos 2008). Although it will be difficult to find undisturbed large rivers in the Grijalva, the identification of small-forested catchments to locate additional monitoring stations will benefit the collection of long-term water quality data.
An alternative for the 75th percentile of reference streams could be the use of the percentiles 5th to 25th of the general population data (USEPA 2000, Rohm et al. 2002, Suplee et al. 2007, Herlihy and Sifneos 2008, Hsieh et al. 2016). Concentrations at the 25th percentile for the Grijalva basin were 0.03-0.08 mg/L for TP and 0.62-0.83 mg/L for TN, which exceeded values estimated in some studies but were in the range of others (Table VIII). Concentrations at the 5th and 16.7th were similar to values at the 25th percentile of several studies. However, these comparisons must consider that previous studies on nutrient criteria correspond to temperate and sub-tropical systems, and background nutrient concentrations can vary among regions. Factors such as greater N concentrations in tropical than in temperate forested systems (Brookshire et al. 2012) and P as a limiting nutrient in many streams of the region (Capps and Flecker 2013) can influence nutrient criteria values for the Grijalva.
The use of the general stream population could be an alternative for the 75th percentile but it has some disadvantages. The general nutrient data is affected by the degree of disturbance of the study region, and criteria drawn from these data can fluctuate over time, depending on the increase or decrease of nutrient inputs (Suplee et al. 2007, Herlihy and Sifneos 2008). In areas under high human pressures such as the Grijalva basin, the general stream population will reflect the eutrophication degree, and concentrations at the 25th percentile probably will not be enough to protect aquatic ecosystems (Suplee et al. 2007). On the other hand, the application of concentrations based on the 5th percentile can be very restrictive and difficult to achieve in disturbed areas (Hsieh et al. 2016, Huo et al. 2018), but some authors suggest that this percentile could represent better background conditions (Clune et al. 2020). Thus, the use of concentrations at the 16.7th percentile could protect the aquatic environments without being too restrictive.
Based on our results, low-order and high-order streams showed similar concentrations at each percentile of the general stream population, suggesting that a single criterion could be used for all stream sizes. Differences among subregions were observed in all percentiles and could be related to differences in natural and human processes among subregions (Smith et al. 2003, Suplee et al. 2007, Herlihy and Sifneos 2008). Although it is recommended to establish nutrient criteria for regions with similar characteristics (USEPA 2000), the use of a single criteria for the whole Grijalva basin will facilitate its implementation and the protection of aquatic ecosystems. The application of greater values for upstream (in the UG and MG subregions) than for downstream areas (the LG subregion; Table VII) can compromise nutrient goals in LG. Thus, considering the upstream-downstream connection and human influences in the basin, the application of lower nutrient limits at the upstream subregions based on estimates for the whole basin, probably will benefit aquatic ecosystems.
The use of percentiles can represent an initial guide to develop nutrient criteria in the Grijalva basin but needs to be validated with other methods (Herlihy and Sifneos 2008, Clune et al. 2020). For example, relationships between nutrients levels and stream biota (algae, invertebrate, fishes) can help to identify thresholds where small increases in nutrient levels cause a large change in the biotic component (Robertson et al. 2006, Smith and Tran 2010). Models based on basin characteristics or the relationship between land use and nutrient can help to establish reference conditions in areas where undisturbed streams are not available (Smith et al. 2003, Dodds and Oakes 2004).
Strategies for nutrient control
Implementing and achieving nutrient criteria involve the application of mitigation measures to reduce nutrient discharges into streams and rivers. In Mexican regulations, maximum limit concentrations (monthly averages of 15 mg/L for TP and 25 mg/L for TN) in wastewater discharges into rivers (SEMARNAT 2021) are higher than those established in other countries for TP and TN: 0.005 and 0.1 mg/L, respectively, in Japan (MOE 2015); 1-2 and 10-15 mg/L, respectively, in the EU (CNW 2018); 0.1 and 2-6 mg/L, respectively, in the USA (Litke 1999, USEPA 2013); 0.5 and 15 mg/L, respectively, in China (Li et al. 2012). Nutrient limits in Mexico are also higher than the TP limit concentration (0.03 mg/L) estimated to avoid eutrophication (Dodds 2002). Values found in this study for the 5th, 16.7th, and 25th percentiles are also lower than current limits set by Mexican regulations, but the 16.7th percentile is not too restrictive and could help to protect aquatic ecosystems in the basin.
In other countries, strategies such as improving WWTP, implementation of maximum daily discharges, optimal manure and fertilizer use, and conservation and restoration of riparian zones has been successfully applied (Carey et al. 2013, Jarvie et al. 2013, Heatherly 2014). In the Grijalva basin, sub-basins that always exceeded the 25th percentile were associated with urban areas (Alto Grijalva and Tuxtla Gutiérrez in MG, and Cuxcuchapa, Carrizal and Samaria in LG). Thus, improvement in WWTP is required to reduce nutrient discharges from urban areas. Wastewater treatment in Tabasco and Chiapas is below the national average of 64 % (CONAGUA 2019a), despite an increase of WWTP in Chiapas reported in 2019 (CONAGUA 2019b). Increasing the number of WWTP and enhancing the treatment process (more secondary and tertiary where possible) (Kronvang et al. 2008, Neal et al. 2010, Räsänen et al. 2017) will reduce the amount of wastewater that is directly discharged into the Grijalva streams and rivers. Other options include the implementation of constructed wetlands (Dell’Osbel et al. 2020, Parde et al. 2021). In addition, reducing the use of detergents containing phosphates will decrease P inputs in urban wastewater (Carey et al. 2013). Decreased nutrient loading from non-point sources can be achieved by the conservation and reforestation of riparian zones, wetland restoration, crop rotation, and setting maximum limits for the application of chemical fertilizers, among other measures (Kronvang et al. 2008, Riemann et al. 2016, Tromboni and Dodds 2017).
CONCLUSIONS
Establishing nutrient criteria by the frequency distribution method is an initial step to control nutrient inputs into aquatic ecosystems. The use of the 75th percentile of the reference streams was difficult to apply in the Grijalva because the low availability of monitoring stations located at minimally disturbed sites that resulted in higher concentrations at this percentile compared to those obtained at lower percentiles of the general stream population. Despite the use of the general stream population has some limitations, this approach can help identify nutrient concentrations to start developing nutrient criteria for TP and TN in the Grijalva basin. Nutrient concentrations at the 16.7th percentile could represent a guideline for establishing nutrient criteria in the basin. Despite differences among subregions, we recommend the application of a single criterion for the whole basin to facilitate its implementation and avoiding impacts of nutrient loading from upstream areas into the lower Grijalva.
Currently, water quality datasets are available for the Grijalva basin but information on aquatic biota is scarce; thus, enhancing the long-term monitoring of algae, macroinvertebrates, and fishes can help to understand the influence of nutrients on the biota and develop more suitable nutrient guidelines for the Grijalva basin. In addition to establish nutrient criteria, improvement of wastewater treatment, application of best agricultural practices, and management of riparian vegetation are needed to reduce nutrient inputs and protect aquatic ecosystems.

