


 nova página do texto(beta)
 Espanhol (pdf)
 Artigo em XML
 Referências do artigo
 Enviar este artigo por email
 Citado por SciELO
  Similares em
SciELO
Similares em
SciELO 
 Permalink
INTRODUCTION
Edible oils are extremely important food for all people around the world. They are extracted from plants (e.g., soybean, canola, and chili); seeds (e.g., corn, sesame and sunflower); nuts (e.g., walnut and macadamia); and fruits (e.g., watermelon palm, olive, and coconut). Relying on oil sort, they are widely used in cooking (bread preparation and frying food) and for non-cooking products such as salad, pastry, and appetizers. In addition, edible oils are used to produce nonfood products such as cosmetics, pharmaceutical, and as biofuels.
The human body utilizes oils and fats in the diet for important purposes, as energy and vitamins suppliers, and also as essential elements in metabolic reactions in the human body (Dugo et al. 2004). Human beings, plants and animals rely on major metals such as Ca, Mg, Fe, Cu, Zn and Mn for growth and development, though some metals are benefic and others can be toxic, even in low quantity, and thus pose health risks to humans and animals (Sanches-Filho et al. 2017). While the effect of chronic exposure to small amounts of some metals seems to be well understood, several incidents show the seriousness of high levels of exposure to some noxious metals, particularly Cd, Cr+3, and Pb (Garrido et al. 1994, Buldini et al. 1997, Rajeshkumar et al. 2017). The quality of edible oils is directly linked to the concentration of many trace metals. Concentrations of Fe, Cu, Co, Ni and Mn are known to increase the rate of oil oxidation, while elements like As, Cr, Cd, and Pb are significant on account of their toxicity and metabolic role (Manjusha, et al. 2019).
The presence of metals in vegetable edible oils relies on many factors. They may come from the soil, environment, and genetic structure of the plant, as well as fertilizers and pesticides introduced during the production process or by contamination from the metal processing equipment or shipping containers (Cindiric et al. 2007, Jamali et al. 2008). If toxic metals are consumed the risk of a particular population may increase, so it is essential to determine the concentration of these metals (Sobhan 2016). Many studies have been recently carried out on the determination of heavy metals in edible oils all over the world (Cindiric et al. 2007, Mendil et al. 2009, Bakkali et al. 2012, Savio et al. 2014, Barreto et al. 2018, Manjusha et al. 2019, Karasakal 2020). Food contamination by heavy metals has become a reality and constitute a challenge for many countries (Karimi et al. 2015). The purpose of this work is to determine the concentrations of essential and potentially toxic metals in edible vegetable oils sold in Riyadh markets.
MATERIALS AND METHODS
Study area
The study area was Riyadh, one of the biggest cities and capital of the Kingdom of Saudi Arabia, with an area of about 1554 km² and an estimated population of 7 231 447. It is located centrally in the Najd region and lies between latitude 34º-38º N and longitude 43º- 46º E, as shown in figure 1.

Sample preparation
A total of 54 edible vegetable oil samples (soybean, palm and olive) were collected from the supermarkets around the city of Riyadh and transported to the environmental research laboratory at Imam Mahammad Ibn Saud University for elemental analysis. Ten milliliters of high purity HNO3 65 % and 2 ml of H2O2 30 % were added to the beaker containing 2 g of dry samples and were placed in the fume cupboard for two days for digestion. The mixture was then digested at 80 ºC till a transparent solution was achieved. After cooling, the digested samples were filtered using Buchner funnels and the filtrate was diluted to 45 mL with distilled water. Then the samples were analyzed using inductively coupled plasma atomic emission spectroscopy (ICP-AES). The analyzed elements were Cd, Cr, Cu, Fe, Mn, Ni, Pb, Zn, As, Se and Al (al-Rajhi 2014).
Spectrometric analysis
The measurements were performed using a Genesis ICP optical emission spectrometer (Spectro Analytical Instruments, Kleve, Germany) with axial plasma observation. The instrument includes a Paschen-Runge mount spectrometer, constructed employing the optimized Rowland Circle Alignment (ORCA) technique. It consists of two hollow section cast shells, designed for direct thermal stabilization and small volume. Fifteen pre-aligned linear coupled-charge devices (CCDs) were installed outside the optics body, which allows fast, simultaneous spectrum capture of the wavelength range between 175 and 777 nm. For UV access < 200 nm, the optical system was purged with argon at a rate of 0.5 L/min during normal operation. Intelligent calibration logic (ICAL) was used to normalize the wavelength and the intensity of the optical system to a reference optic (optic master). The stability of the forward power in the case of rapidly changing sample loads was achieved by using an air-cooled ICP-generator based on a free running 27.12 MHz system. All ICP operating parameters were software controlled. The ICP-OES instrument was initialized and allowed to achieve thermal equilibrium over 30 min. ICP-OES determinations of elements concentration were performed using the emission lines 228.802, 267.716, 324.752, 238.204, 285.213, 259.372, 231.604, 220.353, 213.857, 189.641, 196.090, and 384.401 λ (nm) for the elements Cd, Cr, Cu, Fe, Mg, Mn, Ni, Pb, Zn, As, Se, and Al, respectively (al-Rajhi 2014).
Quality control
All the standard stock solutions of heavy metals were certified reference materials purchased from Agilent Technologies (USA). HNO3 and H2O2 were heavy metal analytical grade purchased from Wako Chemical (USA). Reagent water, toluene and acetone were of analytical reagent grade purchased from J.T. Baker (USA). Adequate quality control method and vigilance were carried out in order to get reliable results. Throughout the experiments, all glassware and equipment were cautiously washed beginning with acetone followed by 5 % HNO3 and ending with repeated rinsing distilled water to prevent contamination. Reagent blank determinations were used to correct the readings. The lower detection limit values of the elements were found in this study to be 0.001 mg/kg for Cr, 0.001 mg/kg for Cu, 0.0001 mg/kg for Zn, 0.002 mg/kg for Fe, 0.003 mg/kg for Mn, 0.0001 mg/kg for Cd, 0.001 mg/kg for Al, 0.001 mg/kg for Ni, 0.01 mg/kg for Se, 0.004 for Pb and 0.01 mg/kg for As. The recovery values were nearly quantitative (95%) for digestion method. The relative standard deviations were less than 10 % for all investigated elements. Multi-element solution standards obtained from Agilent Technology were used to calibrate and calculate sample results.
RESULTS AND DISCUSSION
The determination of the elemental concentration in edible vegetable oil is vital, since several elements play major roles in various metabolic processes in the human body. Moreover, some of these elements are toxic if consumed in excessive quantities. In this study, 11 elements (Mn, Fe, Cu, Cr, Zn, Ni, Al, Pb, As, Cd, Se, and Al) in edible vegetable oil samples were studied using ICP-OES, as shown in table I and Fig. 2.
TABLE I AVERAGE CONCENTRATIONS* OF Cd, Cr, Cu, Fe, Mn, Ni, Pb, Zn, As, Se AND Al IN EDIBLE VEGETABLE OIL.
| No. | Cd | Cr | Cu | Fe | Mn | Ni | Zn | Al | Pb | As | Se |
| 1 | 0.001 | 0.004 | 0.004 | 0.061 | LDL | 0.038 | 0.013 | 0.179 | 0.006 | 0.28 | 0.278 |
| 2 | LDL | 0.009 | 0.005 | 0.048 | 0.001 | 0.042 | 0.004 | 0.014 | 0.004 | 0.099 | 0.102 |
| 3 | 0.001 | 0.014 | 0.005 | 0.305 | 0.001 | 0.018 | 0.013 | 0.295 | 0.004 | 0.309 | 0.284 |
| 4 | 0 | 0.004 | 0.007 | 0.056 | 0.001 | 0.026 | 0.048 | 0.111 | 0.004 | 0.18 | 0.183 |
| 5 | 0.001 | 0.009 | 0.009 | 0.239 | 0.002 | 0.222 | 0.059 | 0.131 | 0.086 | 0.877 | 0.824 |
| 6 | LDL | 0.009 | 0.005 | 0.067 | 0.001 | 0.085 | 0.027 | 0.069 | 0.011 | 0.24 | 0.238 |
| 7 | LDL | 0.004 | 0.005 | 0.12 | 0.001 | 0.08 | 0.017 | 0.425 | 0.004 | 0.289 | 0.3 |
| 8 | LDL | 0.004 | 0.005 | 0.072 | 0.001 | 0.052 | 0.01 | 0.116 | 0.004 | 0.309 | 0.305 |
| 9 | LDL | 0.01 | 0.006 | 0.106 | 0.001 | 0.011 | 0.014 | 0.152 | 0.004 | 0.256 | 0.242 |
| 10 | LDL | 0.008 | 0.019 | 0.108 | 0.003 | 0.018 | 0.049 | 0.087 | 0.004 | 0.026 | 0.064 |
| 11 | LDL | 0.008 | 0.004 | 0.137 | 0.001 | 0.01 | 0.023 | 0.149 | 0.004 | 0.331 | 0.342 |
| 12 | 0.001 | 0.007 | 0.005 | 0.084 | 0.001 | 0.013 | 0.024 | 0.098 | 0.032 | 0.614 | 0.587 |
| 13 | LDL | 0.008 | 0.005 | 0.067 | 0.001 | 0.018 | 0.023 | 0.083 | 0.004 | 0.381 | 0.377 |
| 14 | 0.001 | 0.007 | 0.007 | 0.084 | 0.001 | 0.009 | 0.014 | 0.098 | 0.046 | 0.975 | 0.89 |
| 15 | LDL | 0.004 | 0.005 | 0.372 | 0.003 | 0.014 | 0.022 | 0.079 | 0.008 | 0.364 | 0.343 |
| 16 | LDL | 0.002 | 0.004 | 0.027 | LDL | 0.034 | 0.02 | 0.019 | 0.01 | 0.321 | 0.298 |
| 17 | LDL | 0.01 | 0.005 | 0.038 | 0.002 | 0.032 | 0.021 | 0.013 | 0.004 | 0.081 | 0.085 |
| 18 | LDL | 0.003 | 0.004 | 0.028 | LDL | 0.052 | 0.001 | 0.012 | 0.004 | 0.058 | 0.059 |
| 19 | LDL | 0.011 | 0.005 | 0.065 | 0.001 | 0.046 | 0.01 | 0.091 | 0.004 | 0.337 | 0.322 |
| 20 | LDL | 0.004 | 0.005 | 0.049 | LDL | 0.026 | 0.007 | 0.081 | 0.004 | 0.254 | 0.242 |
| 21 | LDL | 0.007 | 0.005 | 0.089 | 0.001 | 0.007 | 0.01 | 0.089 | 0.004 | 0.395 | 0.393 |
| 22 | LDL | 0.004 | 0.004 | 0.066 | LDL | 0.006 | 0.007 | LDL | LDL | LDL | LDL |
| 23 | 0.002 | 1.211 | 0.018 | 4.916 | 0.077 | 0.785 | 0.234 | LDL | LDL | LDL | LDL |
| 24 | LDL | 0.018 | 0.011 | 0.112 | 0.001 | 0.042 | 0.155 | LDL | LDL | LDL | LDL |
| 25 | LDL | 0.004 | 0.002 | 0.025 | LDL | 0.002 | 0.003 | LDL | LDL | LDL | LDL |
| 26 | LDL | 0.005 | 0.004 | 0.079 | LDL | 0.007 | 0.014 | LDL | LDL | LDL | LDL |
| 27 | 0.001 | 1.898 | 0.032 | 7.861 | 0.128 | 1.215 | 0.018 | LDL | LDL | LDL | LDL |
| 28 | 0.011 | 0.022 | 0.001 | 0.173 | 0.002 | 0.012 | 0.004 | LDL | LDL | LDL | LDL |
| 29 | 0.002 | 0.003 | 0.001 | 0.034 | 0 | 0.004 | 0.007 | LDL | LDL | LDL | LDL |
| 30 | LDL | 0.012 | 0.006 | 0.151 | 0.001 | 0.015 | 0.008 | LDL | LDL | LDL | LDL |
| 31 | LDL | 0.013 | 0.004 | 0.068 | 0.001 | 0.009 | 0.015 | LDL | LDL | LDL | LDL |
| 32 | 0.007 | 0.002 | 0.001 | 0.034 | LDL | 0.002 | 0.062 | LDL | LDL | LDL | LDL |
| 33 | LDL | 0.003 | 0.005 | 0.041 | LDL | 0.006 | 0.01 | LDL | LDL | LDL | LDL |
| 34 | LDL | 0.014 | 0.046 | 0.141 | 0.002 | 0.016 | 0.028 | LDL | LDL | LDL | LDL |
| 35 | LDL | 0.004 | 0.005 | 0.049 | LDL | 0.01 | 0.01 | LDL | LDL | LDL | LDL |
| 36 | LDL | 0.005 | 0.004 | 0.055 | 0.001 | 0.008 | 0.018 | LDL | LDL | LDL | LDL |
| 37 | LDL | 0.007 | 0.009 | 0.088 | 0.001 | 0.016 | 0.016 | LDL | LDL | LDL | LDL |
| 38 | LDL | 0.006 | 0.006 | 0.074 | 0.001 | 0.012 | 0.031 | LDL | LDL | LDL | LDL |
| 39 | 0.001 | 0.038 | 0.007 | 0.278 | 0.005 | 0.065 | 0.089 | 0.074 | 0.087 | 0.799 | 0.778 |
| 40 | 0.002 | 0.002 | 0.004 | 0.033 | 0.001 | 0.014 | 0.07 | 0.017 | 0.033 | 0.302 | 0.317 |
| 41 | LDL | 0.062 | 0.032 | 0.252 | 0.003 | 0.035 | 0.041 | 0.059 | 0.008 | 0.107 | 0.142 |
| 42 | LDL | 0.003 | 0.005 | 0.026 | 0.001 | 0.004 | 0.035 | 0.021 | 0.016 | 0.147 | 0.165 |
| 43 | 0.001 | 0.025 | 0.007 | 0.356 | 0.003 | 0.024 | 0.084 | 0.031 | 0.021 | 0.109 | 0.136 |
| 44 | LDL | 0.035 | 0.008 | 0.133 | 0.003 | 0.028 | 0.048 | 0.094 | 0.017 | 0.134 | 0.15 |
| 45 | LDL | 0.012 | 0.008 | 0.094 | 0.001 | 0.01 | 0.055 | 0.024 | 0.019 | 0.121 | 0.128 |
| 46 | LDL | 0.024 | 0.024 | 0.174 | 0.003 | 0.088 | 0.511 | 0.199 | 0.015 | 0.112 | 0.134 |
| 47 | LDL | 0.003 | 0.005 | 0.049 | 0.002 | 0.03 | 0.086 | 0.012 | 0.021 | 0.074 | 0.086 |
| 48 | LDL | 0.004 | 0.005 | 0.08 | 0.001 | 0.01 | 0.037 | 0.013 | 0.018 | 0.081 | 0.088 |
| 49 | LDL | 0.003 | 0.007 | 0.038 | LDL | 0.004 | 0.05 | 0.013 | 0.017 | 0.083 | 0.092 |
| 50 | LDL | 0.01 | 0.022 | 0.08 | 0.005 | 0.017 | 0.067 | 0.078 | 0.006 | 0.045 | 0.082 |
| 51 | LDL | 0.036 | 0.012 | 0.181 | 0.003 | 0.03 | 0.079 | 0.095 | 0.013 | 0.092 | 0.111 |
| 52 | LDL | 0.019 | 0.081 | 0.142 | 0.001 | 0.02 | 0.051 | 0.074 | 0.004 | 0.01 | 0.051 |
| 53 | LDL | 0.049 | 0.02 | 0.18 | 0.018 | 0.024 | 0.033 | 0.063 | 0.004 | 0.01 | 0.05 |
| 54 | LDL | 0.078 | 0.027 | 0.633 | 0.006 | 0.057 | 0.062 | 0.08 | 0.011 | 0.031 | 0.07 |
| Min | 0.001 | 0.002 | 0.001 | 0.025 | 0.001 | 0.002 | 0.001 | 0.012 | 0.004 | 0.01 | 0.05 |
| Max | 0.011 | 1.898 | 0.081 | 7.861 | 0.128 | 1.215 | 0.511 | 0.425 | 0.087 | 0.975 | 0.89 |
| Avg | 0.0006 | 0.072 | 0.011 | 0.362 | 0.006 | 0.065 | 0.047 | 0.06 | 0.011 | 0.17 | 0.172 |
| Std | 0.002 | 0.307 | 0.013 | 1.256 | 0.02 | 0.196 | 0.077 | 0.073 | 0.018 | 0.229 | 0.215 |
*In mg/kg.
LDL: lower detection limit, Min: minimum, Max: maximum, Avg: average, Std: standard deviation.
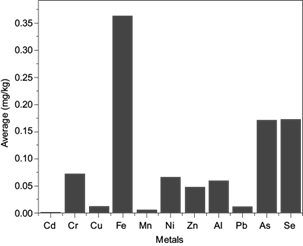
Fig. 2 Cr, Cu, Fe, Mn, Ni, Zn, Al, Pb, As, As, and Se concentrations (in mg/kg) and statistical summary of edible vegetable oil samples.
Nickel
Ni concentrations varied from 0.002 to 1.215 mg/kg with an average value of 0.065 mg/kg. The concentration of Ni control samples was 0.01 mg/kg. Upon comparing the average values of Ni in the obtained results with control and global data, it was found that the obtained values were far below the reported average values from Pakistan, Turkey and Spain (Cindiric et al. 2007, Lorent et al. 2011). The nickel average daily intake (0.023011 mg/kg) was found to be lower than the maximum allowable concentration limit set by the World Health Organization (100-300 mg/kg) (WHO 1995). Trace amounts of Ni may be beneficial as activators of some enzyme systems, but its toxicity at higher levels is more prominent (Ameen et al. 2019).
Copper
Cu concentrations ranged from 0.001-0.081 mg/kg with an average value of 0.011 mg/kg. The concentration of control samples was 0.0001 mg/kg. The Cu concentration range was lower than that reported in similar data (0.02-0.33 mg/kg) (Garrido et al. 1994), 12.71-50.5 mg/kg (Buldini et al. 1997), 0.15-1.5 mg/kg (Zeiner et al. 2005), 0.0184-0.2870 mg/kg, 0.05-0.71 mg/kg (Mendil et al. 2009), and 0-130 mg/kg (Llorent et al. 2011). The Cu average daily intake (0.004 mg/kg) was found to be lower than the maximum allowable concentration limit set by the Food and Agriculture Organization of the United Nations and WHO (3 mg/kg) (FAO-WHO 1999). Cu has numerous functions in the human body, but excessive intake of this element has been reported to be toxic.
Zinc
Zn concentrations varied from 0.001 to 0.511 mg/kg ith an average value of 0.047 mg/kg. From the obtained results, the Zn concentration range was higher than the control samples (0.002 mg/kg), however Zn concentrations in this investigation were lower than in similar data reported by numerous researchers (Garrido et al. 1994, Mendil et al. 2009). The Zn average daily intake (0.017 mg/kg) was found to be lower than the maximum legal limit set by WHO (1995) (60 mg mg/kg). Zn has an essential function in carbohydrate and cholesterol metabolism.
Manganese
Mn is essential in many biological processes such as immunity functions, blood sugar regulation and bone growth, as well as being a cell antioxidant (Pfalzer and Bowman 2017). This element was detected in 43 of the 54 samples within a range of 0.001-0.128 mg/kg with an average value of 0.002 mg/kg. In comparison, manganese average values in the investigated samples were lower than in a similar studies (Garrido et al. 1994, Cindiric et al. 2007, Mendil et al. 2009, Llorent et al. 2011). Manganese average daily intake 0.006 mg/kg was found to be lower than the maximum limit set by WHO (1995) (2.5-5 mg/kg).
Chromium
Cr is important in the metabolism of glucose, as reported by Yagi et al. (2013). The toxic effects of Cr+3 intake include skin rash, nose irritation, bleeding, upset stomach, kidney and liver damage. Cr concentrations varied from 0.002 to 1.898 mg/kg with an average value of 0.026 mg/kg. The concentration of control samples was 0.003 mg/kg.
Iron
Fe was found within the range of 0.025-7.861 mg/kg with an average value of 0.362 mg/kg. The average daily intake of this element (0.129 mg/kg) was found to be lower than the maximum allowable limit (11-18 mg/kg) (Institute of Medicine 2001). The concentrations of control samples was 0.027 mg/kg. It is well known that Fe is indispensable for human beings and animals and is an essential component of hemoglobin. It facilitates the oxidation of carbohydrates, proteins and fats to control body weight, which is an extremely important factor in diabetes; furthermore, an Fe deficiency can induce anemia. The recommended daily allowance (RDA) for Fe is 11 and 18 mg/day for children and adults, respectively (Schüman et al. 2007).
Selenium
Se was present in a range of 0.05-0.89 mg/kg with an average of 0.172 mg/kg, while the control sample concentration was 0.004 mg/kg. The average daily intake of Se (0.025) mg was found to be lower than the maximum allowable concentration limit 0.55 mg/kg (Schüman et al. 2007) (Institute of Medicine 2001). Se is an essential element for human nutrition and plays an important role in the protection of the body from cancer and heart disease (Wan et al. 2020). Its RDA is 0.55 mg/day (Institute of Medicine 2001, Schüman et al. 2007).
Cadmium
Ca was detected in 14 of the 54 samples. Concentrations of this element in the samples were found to be in the range of 0.001-0.011 mg/kg, with an average value of 0.0006 mg/kg. The concentration in control samples was 0.001 mg/kg. All the investigated samples showed lower Ca levels than the legal limits recommended by FAO-WHO (0.5 mg/kg) (Codex S 2011). Ca is an extremely toxic metal found naturally in soil, but also spread in the environment due to human activity. Overexposure to Ca can lead to lung, liver, skeletal, and renal problems, as well as cancer (Djordjevic et al. 2019).
Arsenic
The As content in samples were in the range of 0.01-0.975 mg/kg with an average value of 0.17 mg/kg. The obtained values fell far below the action level recommended by FAO/WHO of 0.5 mg/kg (Codex S 2011). The control sample concentration was 0.01mg/kg. As is a naturally occurring element that can be toxic to humans, animals and plants; however, its toxicity varies depending on its presentation form (Kim et al. 2018).
Aluminum
Al concentrations were in the range of 0.012-0.425 mg/kg, with an average value of 0.06 mg/kg. The control sample concentration was 0.001 mg/kg. The toxicity of Al in humans is mainly related to neurotoxicity and the development of neurodegenerative diseases (Verstraeten et al. 2008). It was difficult to compare our obtained results for Al with worldwide concentrations due to the scarcity of data. The FAO-WHO tolerable weekly intake value for Al is 1 mg/kg body weight/week (Stahl et al. 2011).
Lead
Pb was detected in 16 of the 37 samples with concentrations ranging from 0.004 to 0.087 mg/kg and an average of 0.011 mg/kg. The Pb control sample concentration was 0.01 mg/kg. From the obtained results, the Pb concentration range was lower than in similar data reported in Turkey. The Pb concentration in the current study fell within the recommended limits set by FAO/WHO (0.1 mg/kg) (Codex S 2011). Lead is a naturally occurring element and is a widespread industrial metal. Pb has severe health effects even at relatively low levels. It is able to cross the placenta and damage the developing fetal nervous systems (Łukomska et al. 2017). Pb causes both acute and chronic poisoning; it has adverse effects on the kidneys, liver, heart and both the vascular and immune systems.
Correlation coefficient test
Correlations support the interpretation of meaningful measurements. This approach also helps to identify common factors, inducing the observation of elemental relationships. A high value of the coefficient reveals a high linear correlation between the contents of two elements. Table II shows the Spearman correlation coefficient (r) between the elements in oil samples. It was found that the correlation matrix of investigated oil samples showed a cluster of high positive correlation between the variables Cr and Fe (0.998), Cr and Mn (0.994), Cr and Ni (0.985), Fe and Mn (0.994), Fe and Ni (0.985), Mn and Ni (0.978), As and Se (0.997). This indicates that there is a strong relationship between these elements. On the other hand, moderate positive correlations were noted between Pb and As (0.768), and between PB and Se (0.778). Overall, the correlation behavior of elements in the studied samples remained noticeably diverse, which may be attributed to the disproportions of the origin of samples.
TABLE II PEARSON CORRELATION COEFFICIENTS FOR Mn, Fe, Cu, Cr, Zn, Ni, Al, Pb, As, Se AND Al IN EDIBLE VEGETABLE OIL SAMPLES.
| Cd | Cr | Cu | Fe | Mn | Ni | Zn | Al | Pb | As | Se | |
| Cd | 1.000 | ||||||||||
| Cr | 0.085 | 1.000 | |||||||||
| Cu | -0.150 | 0.256 | 1.000 | ||||||||
| Fe | 0.087 | 0.998 | 0.260 | 1.000 | |||||||
| Mn | 0.076 | 0.994 | 0.269 | 0.992 | 1.000 | ||||||
| Ni | 0.070 | 0.985 | 0.243 | 0.985 | 0.978 | 1.000 | |||||
| Zn | -0.007 | 0.154 | 0.228 | 0.154 | 0.152 | 0.191 | 1.000 | ||||
| Al | -0.136 | -0.145 | 0.008 | -0.125 | -0.137 | -0.080 | 0.136 | 1.000 | |||
| Pb | 0.008 | -0.106 | -0.072 | -0.090 | -0.094 | -0.011 | 0.145 | 0.143 | 1.000 | ||
| As | -0.042 | -0.149 | -0.208 | -0.133 | -0.147 | -0.066 | -0.062 | 0.433 | 0.768 | 1.000 | |
| Se | -0.056 | -0.159 | -0.180 | -0.142 | -0.154 | -0.076 | -0.044 | 0.454 | 0.778 | 0.997 | 1.000 |
Note: values in bold characters represent a > 0.5 correlation.
CONCLUSIONS
Based on the obtained results the following conclusions may be drawn:
No contamination was observed in the samples analyzed.
There are no significant differences in the concentrations of studied oils because all of them were found to be lower than the maximum allowable limits set by FAO and WHO.
Significant correlations were observed between Cr and Fe (0.998), Cr and Mn (0.994), Cr and Ni (0.985), Fe and Mn (0.994), Fe and Ni (0.985), Mn and Ni (0.978), and As and Se (0.997)

