


 nueva página del texto (beta)
 Inglés (pdf)
 Artículo en XML
 Referencias del artículo
 Enviar artículo por email
 Citado por SciELO
  Similares en
SciELO
Similares en
SciELO 
 Permalink
INTRODUCTION
Each year, a great quantity of biomass waste is generated from agricultural, industrial and urban activities worldwide (Abdelhafez et al. 2014, Prakongkep et al. 2015, Lam et al. 2016). However, its disposal by composting, landfilling and open burning is not thoroughly practical since these residues can attract harmful fauna and release unpleasant odors, greenhouse gas (GHG) or toxic compounds that might contaminate surface water bodies and soil (Lam et al. 2016, Nanda et al. 2016). For instance, in Mexico City about 6200 t of organic domestic waste were generated daily during 2017 (SEDEMA 2017). For its recollection and disposal, municipalities implemented more than 8300 sweepers, 2500 waste collectors vehicles, 4700 operators and more than 3500 workers not formally employed (SEDEMA 2017). Traditionally, the organic waste from Mexico City has been composted to reduce its volume and to produce organic fertilizers (Michler 2013, TTEI 2013). However, compost is readily degraded by soil microorganisms and can negatively affect the air quality due to the release of CO2 or toxicants such as NH3 (Bass et al. 2016, Chávez-García and Siebe 2019). This hinders the effectiveness of composting as the main waste management option in large cities. Thus, the application of a proper management plan for the recycling or confinement of organic waste is necessary to reduce pollution, public health problems and disposal costs.
Additionally, it is important to emphasize that these residues can have a high economic value. For instance, many of them can be used for gasification schemes or biomass pyrolysis, reducing the volume and toxicity of organic waste (Lam et al. 2016, Nanda et al. 2016).
The conversion of biomass through pyrolysis is ecologically and economically appealing since energy (e.g., biogas) can be produced simultaneously with biochar (Cha et al. 2016, Tripathi et al. 2016). Several countries, particularly in the European Union, are promoting the use of organic biomass to generate energy as an alternative for the combustion of fossil fuels (Lam et al. 2016, Tag et al. 2016, Zema et al. 2018). The impact of this practice has a high potential to effectively diminish the CO2 fluxes into the atmosphere if the produced biochar is used as soil amendment (Lehmann 2007, Cha et al. 2016).
Biochar is a carbon-rich solid produced from the thermal decomposition of biological wastes in absence of oxygen and with relatively low temperatures (150-300 ºC) (IBI 2015, Tripathi et al. 2016, EBC 2017). Its large specific surface and porosity makes biochar a potent adsorbent of organic compounds and heavy metals (Chen et al. 2011, Cha et al. 2016). Many biochars also act as soil fertilizers and pH buffers creating a more favorable habitat for plants and microbial organisms (Brewer 2012). In addition, the recalcitrant nature of biochar contributes to C sequestration in soils, reducing GHG emissions (Brewer 2012). However, certain negative effects have been reported such as nutrients immobilization, CH4 and N2O emissions, low soil water storage, or the introduction of polycyclic aromatic hydrocarbons (PAHs) and other toxicants when untreated biochars are used (DeLuca et al. 2009, Borchard et al. 2014, IBI 2015, Liu et al. 2017).
Biochars can be treated to raise their soil-improving effects. A low-price, fast and ecofriendly way to improve them is by a composting process (Wiedner et al. 2015). Composting might eliminate biochar toxic compounds such as benzene, naphthalene or furan (Borchard et al. 2014). Additionally, it can hasten the formation of oxygen-containing functional groups on the biochar surface, which may increase its reactivity with the soil mineral phase (Wiedner et al. 2015).
The physical and chemical properties of biochars, either untreated or composted, improve the available water holding capacity, the aeration and the nutrient availability in soils (Brewer 2012, Liu et al. 2017) by increasing medium and coarse pores, diminishing soil bulk density and increasing the ion-exchange capacity of the soil (Downie et al. 2009, Brewer 2012). The properties of biochars depend not only on the original biomass but also on the thermal conditions by which they are made (Cha et al. 2016, Tag et al. 2016, Sun et al. 2017). The structure and nutrient composition of most feedstock is imprinted on the biochar, while the temperature controls the abundance of the thermal-degradation products (Dai et al. 2013, Tag et al. 2016). Thus, in the strictest sense, each biochar made with a particular biomass and production process presents unique features, which need to be considered when it is used to ameliorate a particular soil.
Most biochars have been produced from wood and agricultural residues, whose major components are lignin, cellulose and hemicellulose, or from industrial or animal waste, mainly composed of inorganic elements, lipids, proteins, etc. (Cha et al. 2016, Tripathi et al. 2016, Gondek et al. 2017). Fruits are another type of biomass widely produced by juice and other fruit processing factories in the world, which generates a significant amount of residues every year (FAO 2014, 2015), being the peels a renewable resource to be exploited (Lam et al. 2016, Nanda et al. 2016). Fruit peels have considerable amounts of fixed C (30-36 wt %), soluble sugars, pectin, cellulose, hemicellulose, lignin and lipids, which makes them a potential feedstock for pyrolysis conversion into useful products (Lam et al. 2016, Romelle et al. 2016).
Oranges and pineapples (OPP) represent some of the most produced fruits in the world, being Brazil, USA, China, India, Costa Rica and Mexico among the largest fruit producers (Rohrbach et al. 2003, FAO 2014, 2015, Romelle et al. 2016, Zema et al. 2018). Within the international industry, Mexico holds the fifth place in orange production and the seventh in pineapple yield (Rohrbach et al. 2003, FAO 2015). Peels of these fruits could be suitable raw material for multiple biochar applications (Abdelhafez et al. 2014, Aon et al. 2015, Lam et al., 2016, Nanda et al. 2016). However, most biochars from orange peels have usually been used as sorbents of ions such as Cu(II) (Pellera et al. 2012), Pb(II) (Abdelhafez et al. 2014) and Cd (Tran et al. 2016), as well as of organic compounds such as naphthalene (Chen and Chen 2009, Chen et al. 2011) or pharmaceuticals (Fernandez et al., 2015) for water treatment, with only one study of pineapple peels biochar to adsorb Cr(VI) (Wang et al., 2016). Although OPP biochars can increase germination, total C, cation exchange capacity (CEC), nutrient availability and pH in soils (Oh et al. 2012, Dai et al. 2013, 2014), few attempts have been made to produce fertilizers.
The exploration of different feedstock opens new possibilities for the development of efficient amendments to solve specific soil problems related to pH imbalances in acid or alkaline soils, water retention in arid areas or nutrient supply in land-managed soils. Besides, a significant amount of OPP peels are generated from the processing industries and the juice and fruit street-selling in Mexico (Gómez and Schwentesius 1997, CEFP 2002, FAO 2015). These by-products have been used as substrates for the extraction of enzymes, alcohols or organic acids (Ketnawa et al. 2012, Lam et al. 2016, Zema et al. 2018). However, peels are still not fully used and large amounts of peel cellulose are discarded (ca. 30-50 % in weight) (Ketnawa et al. 2012, Lam et al. 2016, Romelle et al. 2016, Zema et al. 2018), while they could help to improve soil fertility.
The aim of this study was to evaluate if composting is able to eliminate toxicants and to improve the characteristics of biochar produced out of OPP peels in order to assess their potential use as soil amendments. Mixing compost with biochar further produces a soil amendment with a labile and a recalcitrant carbon component, promoting both, microbial activity and soil carbon sequestration. This study contributes to the overall biochar production and post-treatment scheme of biochar and to the recycling of fruit waste for soil fertility improvement and C sequestration enhancement.
MATERIALS AND METHODS
Feedstock
OPP peels were gathered from local markets in Mexico City. This feedstock was chosen due to its large availability, greater dry biomass than leafy vegetables, and ease of drying without signs of putrefaction. Prior to pyrolysis, OPP peels were dried outdoors for about 2 weeks during the dry season (March-May, 2015) to ensure maximum moisture of 45 % in the material. The feedstock did not receive any other pretreatment before pyrolysis. An aliquot of the feedstock was analyzed for its total C, organic C and total N contents: 42 ± 1.1, 40 ± 0.4 and 0.6 ± 0.03 % for orange peels, and 44 ± 0.4, 39 ± 1.1 and 0.8 ± 0.01 % for pineapple peels, respectively.
Pyrolysis facility
The biochar was produced using a lab-scale fast pyrolysis reactor at the Gasification Laboratory of the Institute of Engineering of the National Autonomous University of Mexico (UNAM). The setup comprised a stainless steel tube (inner diameter: 81 mm, outer diameter: 89 mm and height: 114 mm) covered with a fitting lid to restrict the access of air. This allowed the material to be charred rather than combusted.
For the biochar production, the internal reactor chamber was externally heated by gas until its walls reached ca. 200 ºC and then, 2 kg of OPP peels mixed in a 1:1 proportion (not chopped) were loaded into the reactor. An electric resistance (3 kW, 220 V) was used to maintain and raise the heat of the chamber atmosphere until it reached its highest treatment temperature (HTT) 200 - 250 ºC. The HTT was monitored by a thermocouple and kept for ca. 80 - 90 min (residence time) and the reactor was opened after a total time of 110 min. We repeated this process 74 times to obtain 50 kg of biochar. The biochar samples were allowed to cool to ambient temperature, ground, sieved (5 mm) and mixed.
Composted biochar preparation
Twenty-six kilograms of biochar were mixed with 35 kg of immature compost (ca. 40 days) from pruning conifers (not sieved). The mix ratio of dry mass was 1:1. The biomass was placed in a plastic container outdoors and deionized water was used to maintain moist conditions. The biomass humidity (50 %) and the daily turning favored a rapid composting process that lasted 40 days. During this period the composted biochar reached the maximum temperature of 38 ºC and subsequently decreased to a constant value (22 ºC). We expected the compost would reach values above 60 ºC. However, the mass-volume relationship and the high number of aeration holes of the plastic container likely hyperventilated the compost, not allowing the increase in temperature (Petiot and de Guardia 2004, Epstein 2011).
Biochar characterization
Three composite samples of 500 g of untreated and composted biochar (sieved at 2 mm) were used and the analyses were performed in duplicate. The yield was calculated using the following formula:
where Wb is the biochar mass (g) and Wf is the dry mass of the feedstock (g). The moisture content of the biochar samples was determined gravimetrically. Particle density (PD) and total pore volume (TPV) were measured by helium displacement using a gas pycnometer (AccuPyc II 1340 Pycnometer). The bulk density (BD) was calculated as the weight of dry biochar per unit volume after 10 times compression in a test tube (EBC 2017).
The percentage of water holding capacity (WHC) was measured by soaking the biochar in a 0.005 M CaSO4 solution for 24 h (EBC 2017). Afterwards, the samples were placed on dry sand for 2 h. The saturated samples were weighed (Ws), dried (40 ºC) until no further water loss and reweighed to record the oven-dried sample (Wd). The WHC was calculated as follows:
The C, N and H analyses were performed with an elemental analyzer CNHS/O Perkin Elmer 2400 series II equipped with a thermic conductivity detector and using helium as carrier gas, and setting combustion temperature at 975 ºC and reduction temperature at 640 ºC. Oxygen was analyzed at 1060 ºC using a Flash 2000 analyzer. The results were used to calculate the elemental ratio C/N and molar ratios H/C and O/C.
The pH and electric conductivity (EC) were measured using a 1:20 dilution in deionized water after stirring for 18 h (IBI 2015). The determination of extractable metals (Fe, Cu, Zn and Mn) was done by diethylenetriaminepentaacetic acid (DTPA) extraction (Lindsay and Norvell 1978) and quantification of Fe, Cu, Zn and Mn by atomic absorption spectroscopy (Perkin Elmer PinAAcle 900H). The extractable phosphorous content of biochar was analyzed by the Olsen method (van Reeuwijk 1992) and the exchangeable cations (Ca, Mg, Na and K) were extracted with ammonium acetate and quantified using atomic absorption spectroscopy (Ca and Mg) or flame atomic absorption spectroscopy (K and Na) (Bower et al. 1952, van Reeuwijk 1992).
We used Fourier-transform infrared spectroscopy (FT-IR) to estimate the concentration of the carboxylic and carboxylates groups COOH/COO- (Celi et al. 1997), the hydrophobicity (Capriel et al. 1995) and the percentage of aromaticity (Wiedemeier et al. 2015). Biochar aliquots (5 mg C) were mixed with KBr (200 mg) and pressed to tablets. Two spectra within the range of 400 to 4000 cm-1, with a resolution factor of 4 cm-1 and 50 scans, were obtained from each tablet.
To evaluate the possible toxicity of the biochars, we performed a germination test with commercial lettuce seeds (Lactuca sativa L.) (IBI 2015). We added 0 (control) or 5 g (ca. 7.9 t/ha) of untreated or composted biochar to a cotton bed in petri dishes. In each one, 10 ethanol-sterilized seeds were placed and every treatment was replicated three times. All petri dishes were kept closed and under greenhouse conditions for 11 days, with the following mean conditions: 18 ºC, 49 % of relative humidity and 11 W/m2 of solar radiation. Irrigation was done with deionized water as necessary to maintain moist conditions.
Finally, toxicants derived from the thermochemical conversion process to make the biochars were also assessed. The analysis of polychlorinated dibenzo-p-dioxins and dibenzofurans (PCDD/PCDF) was done by standardized methods in a commercial lab (ÖKOMETRIC GmbH, Germany) according to the procedure DIN CEN/TS 16190 (DIN SPEC 91267) 2012-05. Total PAHs concentrations (EPA’s 16 priority pollutants) of the biochars were analyzed in agreement with the requirements of the European Biochar Certificate (EBC 2017) by Eurofins Umwelt Ost GmbH (Bobritzsch-Hilbersdorf, Germany), according to DIN EN ISO/IEC 17025:2005 D-PL-14081-01-00.
Data analysis
Properties of the untreated and the composted biochars were analyzed for significant differences using Mann-Whitney-Wilcoxon tests, except for the FT-IR spectra, PAHs and PCDD/PCDF concentrations. Germination results were evaluated for significant differences using a Kruskal Wallis test and a Conover post-hoc test for pairwise comparisons (PMCMR package; Pohlert 2014). Analyses were performed using the software R version 3.5.0 (RDCT 2018).
RESULTS AND DISCUSSION
The yield obtained for the untreated biochar was of 40 % (Table I). The pineapple peels carbonized faster and more evenly than the orange peels, probably because the former contain less crude proteins, lipids and ash (Romelle et al. 2016). Despite this difference in carbonization, pineapple peels have been scarcely used to produce biochar compared to citrus peels (Table I).
TABLE I PHYSICAL CHARACTERIZATION OF THE UNTREATED AND COMPOSTED BIOCHARS FROM THIS STUDY AND PREVIOUS WORKS (UNTREATED BIOCHARS ONLY). OPP = ORANGE AND PINEAPPLE.
| Variable (Unit) | Untreated Biochar Mean ± SE | Composted-Biochar Mean ± SD | Previous studies | Reference |
| Feedstock | OPP peels | OPP peels biochar and conifers pruning | Orange peels | 1-5, 8, 10, 12, 13 |
| Citrus peels | 7, 9, 11 | |||
| Pineapple peels | 6, 7, 14 | |||
| HTT (ºC) | 200 - 250 | <250 | 1-3,10 | |
| 300-350 | 3-5, 7, 9, 12, 14 | |||
| 400-500 | 2, 3, 6-8, 11, 13, 14 | |||
| 600-700 | 2-5, 13 | |||
| 700-800 | 13, 14 | |||
| Residence time (min) | 80 - 90 | 20-30 | 5, 9 | |
| 60 | 11, 12 | |||
| 120 | 4, 6, 7, 13, 14 | |||
| 360 | 2, 3, 5, 13 | |||
| 960 | 1 | |||
| 1200 | 10 | |||
| Yield (%) | 40 | 5-15 | 6, 7 | |
| 20-30 | 3, 8, 12, 13, 14 | |||
| 33-40 | 3, 5, 7, 10, 13, 14 | |||
| 48-83 | 3 | |||
| Moisture (%) | 4.9 ± 0.4 | 52.2 ± 1.3 | 2.4-2.9 | 9, 13 |
| 3.2-3.9 | 13 | |||
| 6.7-6.9 | 13 | |||
| PD (g/cm) | 1.53 ± 0.004 | 1.74 ± 0.01 | ||
| BD (g/cm) | 0.36 ± 0.001 | 0.392 ± 0.013 | 0.13 | 8 |
| 0.46 | 12 | |||
| TPV (cm3/g) | 0.3445 ± 0.002 | 0.4253 ± 0.003 | ≤0.004 | 7, 8, 14 |
| 0.005-0.01 | 2, 7 | |||
| 0.02-0.15 | 2, 14 | |||
| WHC (%) | 176.4 ± 3.0 | 175.9 ± 5.6 | 132 | 12 |
| 200 | 8 |
*(1) Titirici et al. 2007; (2) Chen and Chen 2009; (3) Chen et al. 2011; (4) Oh et al. 2012; (5) Pellera et al. 2012; (6) Dai et al. 2013a; (7) Dai et al. 2013b; (8) Abdelhafez et al. 2014; (9) Aon et al. 2015; (10) Fernandez et al. 2015; (11) Prakongkep et al. 2015; (12) Stella Mary et al. 2016; (13) Tran et al. 2016; (14) Wang et al. 2016. HTT = highest treatment temperature, PD = particle density, BD = bulk density, TPV = total pore volume, WHC = water holding capacity
The most common HTT reported in previous studies has been 300 - 350 ºC, and the preferred residence time to produce biochar is 120 min (Table I). The HTT is one of the most important parameters during pyrolysis that influence the properties of biochar because the fundamental changes (e.g., the release of volatiles) are all temperature dependent (Downie et al. 2009). For example, as temperature increases, the specific surface area of biochar increases, particles can also become smaller and the organic matter is more recalcitrant (Liang et al. 2016). High HTT during pyrolysis can reduce the available plant nutrients and the CEC due to functional groups release (Liang et al. 2016, Tag et al. 2016). However, temperature intervals under which these changes occur vary with feedstock (Downie et al. 2009).
Our analysis showed that biochar yield was similar to the one obtained from oranges by Chen et al. (2011), Pellera et al. (2012) and Fernandez et al. (2015), but higher than the results achieved by other studies (Dai et al. 2013, 2014, Abdelhafez et al. 2014, Stella Mary et al. 2016, Tran et al. 2016, Wang et al. 2016; Table I). These differences could be related to the HTT and the residence time, since biochar yield decreases if the pyrolysis temperature is increased (Cha et al. 2016, Stella Mary et al. 2016, Tran et al. 2016). In our case, a HTT of 200 - 250 ºC could explain the higher yield obtained, in comparison to the studies mentioned whose HTT employed was > 350 ºC (Abdelhafez et al. 2014, Stella Mary et al. 2016, Tran et al. 2016, Wang et al. 2016).
Moisture is not a commonly measured parameter; however, it can indicate the adsorptive capacity of biochars, because pores that could be available for organic molecules are filled with water (Santos et al. 2015). Since our untreated biochar had higher moisture content compared to those of Aon et al. (2015) and Tran et al. (2016) whose HTT was < 300 ºC (Table I), we assume that evaporation of the feedstock moisture could not be completed at the HTT we used. In the case of the composted biochar, moisture content was very high (> 50 %) due to the added water during the composting process and possibly due to the conifer pruning added.
The PD of the untreated and composted biochar was 1.53 and 1.74 g/cm3 (p = 1.08-5), respectively (Table I). Other studies have reported values from 0.58 (at 200 ºC) to 2.36 g/cm3 (at 800 ºC) in biochars from pine pellet and manure (Tsai et al. 2012, Santos et al. 2015). In general, biochar PD values typically range from 1.5 to 1.8 g/cm3 (Jankowska et al. 1991 in Downie et al. 2009, Liang et al. 2016). However, high temperatures (> 800 ºC) or rich-ash feedstock can increase the PD values due to loss of volatile compounds, concentration of ash and gain in structural organization (Downie et al. 2009, Tsai et al. 2012, Santos et al. 2015).
The BD of the untreated and composted biochar was 0.36 and 0.39 g/cm3 (no significant differences: p = 0.1), respectively. Other authors report values of 0.13 and 0.46 g/cm3 for orange peels biochar (Abdelhafez et al. 2014, Stella Mary et al. 2016). Biochar BD is, in general, around 0.2 - 0.5 g/cm3 (Brewer 2012). However, there can be variations due to feedstock and production processes (Sun et al. 2017). For instance, manure and sludge biochars can have higher BD (0.54 - 0.61 g/cm3) than those of plant biomass (0.14 - 0.35 g/cm3) because of the mineral contribution of the former (Sun et al. 2017), while high temperature (> 500 ºC) produces low-BD biochars compared to lower temperatures (250 - 500 ºC) because the increased development of pores during pyrolysis (Downie et al. 2009).
The TPV of the untreated and composted biochar was 0.34 and 0.43 cm3/g (p = 1.08-5), respectively. Other authors report values lower than 0.15 cm3/g for orange or pineapple peels biochar (Table I). These differences could be attributed to feedstock and pyrolysis temperature that control pore formation (Downie et al. 2009, Brewer 2012, Dai et al. 2013). Generally, the greater the TPV of biochar, the greater the retention of water or pollutants (Dai et al. 2013, Wang et al. 2016). Thus, it seems convenient to have a low-temperature biochar with high TPV values due to the lower investment to produce it.
The WHC of the untreated and composted biochar was 176 % (no significant differences: p = 1), namely, they can hold almost 2 times their mass of water. Other studies with orange peels biochars mention 132 and 200 % of WHC (Abdelhafez et al. 2014, Stella Mary et al. 2016). The WHC is closely related to the TPV because the porosity determines the available space for water storage (Brewer 2012, Liu et al. 2017). However, biochar hydrophobicity can prevent water from entering the pores (Brewer 2012, Kinney et al. 2012). Fortunately, hydrophobicity is usually decreased by environmental exposure, i.e., by wetting or by composting the biochar (Kinney et al. 2012, Liu et al. 2017).
The C and N percentages obtained were 62 and 1.82 for the untreated biochar, and 42 and 1.77 for the composted biochar, respectively (C: p = 0.002; N: p = 0.39; Table II). The decrease in the C content of the biochar after being composted can be attributed to the lower C content of the biomass used for the composting process (19.7±1.1 %). Our untreated biochar C content is in line with most previous studies on orange peels biochars (Table II), whose reported values range between 60 and 70 % (Table II).
TABLE II CHEMICAL CHARACTERIZATION OF THE IMMATURE COMPOST, THE UNTREATED AND THE COMPOSTED BIOCHARS FROM THIS STUDY AND PREVIOUS WORKS (UNTREATED BIOCHARS ONLY).
| Variable (Unit) | Immature compost Mean ± SD | Untreated biochar Mean ± SE | Composted-biochar Mean ± SD | Previous studies | Reference |
| C (%) | 46.0 ± 1.1 | 62.0 ± 1.4 | 42.0 ± 0.6 | 40-50 | 7 |
| 50-60 | 3, 6, 7, 9 | ||||
| 60-70 70-80 |
1-5, 7, 8, 10, 11 3, 4, 5 |
||||
| N (%) | 1.02 ± 0.01 | 1.82 ± 0.1 | 1.77 ± 0.05 | 0.5 | 3, 10 |
| 1-2 | 2-4, 7, 9 | ||||
| 2-3 | 2, 3, 5-8, 11 | ||||
| 3-4 | 5 | ||||
| H (%) | 3.9 ± 0.5 | 4.7 ± 0.1 | 4.0 ± 0.17 | <2 2-4 4-7 |
2-5 2, 3, 5-9 2-7, 10 |
| O (%) | 22.2 ± 2.3 | 30.3 ± 1.0 | ≤10 | 7 | |
| 11-15 | 2, 4 | ||||
| 16-30 | 2, 4, 6, 7, 8, 9, 10 | ||||
| 31-45 | 2, 7 | ||||
| C/N | 45.09 ± 0.9 | 34.1 ± 1.1 | 23.8 ± 0.6 | 18-30 | 5-7, 11 |
| 30-44 | 2, 4, 8-10 | ||||
| 132 | 3 | ||||
| H/C | 0.91 ± 0.05 | 1.14 ± 0.04 | ≤0.30 0.31-0.60 0.61-0.90 0.91-1.20 1.21-1.50 |
2-5 2, 5, 7, 8 2, 3, 5, 6, 9 2-4, 7, 10 2, 7 |
|
| O/C | 0.27 ± 0.04 | 0.54 ± 0.03 | ≤2.0 | 2, 4, 7 | |
| 2.1-4.0 | 2, 4, 6, 7, 8, 9, 10 | ||||
| 4.1-6.1 | 2, 7 | ||||
| pH | 7.4 ± 0.02 | 7.6 ± 0.3 | 8.51 ± 0.2 | <5 | 5 |
| 6-8 | 4, 7, 9 | ||||
| 8-10 | 8, 13, 12 | ||||
| >10 | 4, 6, 7, 11, 13 | ||||
| EC (dS/m) | 2.7 ± 0.16 | 5.7 ± 0.2 | 4.4 ± 0.1 | <1.0 | 8, 12 |
| 1.1-1.6 | 4, 9 | ||||
| 6.5-7.2 | 4, 11 | ||||
| Fe (mg/kg) | 48.3 ± 0.00 | 3.7 ± 0.2 | 131.0 ± 12.0 | 215 | 9 |
| Cu (mg/kg) | 12.9 ± 0.12 | 1.5 ± 0.3 | 3.8 ± 0.7 | 144 | 9 |
| Zn (mg/kg) | 19.0 ± 0.14 | 7.1 ± 0.4 | 36.0 ± 1.0 | 63.7 | 9 |
| Mn (mg/kg) | 68.0 ± 1.41 | 6.3 ± 1.3 | 21.4 ± 5.1 | 107 | 9 |
| P (mg/kg) | 116.4 ± 1.4 | 157.1 ± 28.2 | 296 ± 2.5 | ||
| Ca (cmolc/kg) | 53.8 ± 22.0 | 18.6 ± 1.9 | 31.1 ± 0.9 | 14.2-14.5 | 4 |
| Mg (cmolc/kg) | 7.9 ± 1.4 | 4.8 ± 0.8 | 10.3 ± 0.2 | 3.5-3.6 | 4 |
| Na (cmolc/kg) | 1.2 ± 0.1 | 1.0 ± 0.02 | 1.4 ± 0.03 | ||
| K (cmolc/kg) | 7.9 ± 2.5 | 34.6 ± 0.3 | 31.1 ± 0.01 | 8.9-14.1 | 4 |
*(1) Titirici et al. 2007; (2) Chen and Chen 2009; (3) Chen et al. 2011; (4) Oh et al. 2012; (5) Pellera et al. 2012; (6) Dai et al. 2013a; (7) Dai et al. 2013b; (8) Abdelhafez et al. 2014; (9) Aon et al. 2015; (10) Fernandez et al. 2015; (11) Prakongkep et al. 2015; (12) Stella Mary et al. 2016; (13) Tran et al. 2016; (14) Wang et al. 2016. SD = standard deviation, SE = standard error
The N content in biochars of previous studies ranges between 0.5 and 3.75 % (Table II). The C/N ratio of the untreated biochar was 34.1, while values of previous studies showed a variation between 22 and 39, except for the biochar characterized by Chen et al. (2011) whose C/N ratio is 132 (Table II). The C/N ratio of the composted biochar decreased significantly to 23.8 (p = 0.002). An estimated C/N ratio of 20 is recommended for soil fertilizers to avoid N immobilization problems in the soil. In our case, a C/N ratio of 34.1 is slightly higher than the recommended one; probably due to the low N content of OPP peels compared with other fruit shells (Lam et al. 2016, Nanda et al. 2016). However, composting the biochar reduced the C/N value, which means that this method could increase the N content, especially when untreated biochars are mixed with some N-rich material.
The H and O percentages obtained were 4.7 and 22.2, respectively for the untreated biochar and 4.0 and 30.3 for the composted one (H: p = 0.002; O: p = 0.002; Table II). From these data, and from the FTIR spectra (Fig. 1), it is suggested that composting enhanced the formation of oxygen-containing functional groups (Wiedner et al. 2015). The values of the untreated biochar are in line with previous studies, in which the H and O percentages range between 1.4 - 7 and 4 - 45 %, respectively (Table II). In the case of the H/C molar ratio, the untreated biochar had a value of 0.91, while composting increased significantly the ratio to 1.14 (p = 0.002; Table II). Similar values were found by Chen et al. (2011) and Fernandez et al. (2015) for untreated biochars: 0.92 - 0.94. The H/C ratio has been used as a measure of aromaticity, linked to the biochar long-term stability and to its adsorption degree (Chun et al. 2004, Schimmelpfennig and Glaser 2012). For instance, a H/C ratio ≤0.6 can indicate a long-term C sequestration in soils (Schimmelpfennig and Glaser 2012), while values >0.6 suggest the existence of uncharred macromolecules such as carbohydrates or cellulose (Chun et al. 2004). However, the H/C ratio depends on several factors like feedstock or production method (Schimmelpfennig and Glaser 2012).
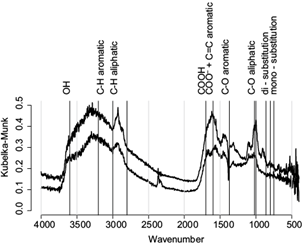
Fig. 1 Fourier transform infrared spectroscopy spectra of the untreated (bottom) and composted (top) biochars
Regarding the O/C molar ratio, the untreated and the composted biochars had values of 0.27 and 0.54, respectively (p = 0.002). The former value is in line with Chen and Chen (2009) ratio: 0.24 - 0.30. The O/C ratio is also an indicator of the biochar stability (Spokas 2010, Abdelhafez et al. 2014). For instance, an O/C ratio of 0.2-0.6 confers biochars half-lives of 100-1000 years in the soil, while a ratio >0.6 suggests biochars may remain <100 years (Spokas 2010). The O/C ratio can also account for other biochar properties linked with feedstock, pyrolysis and post-production (Spokas 2010). For instance, as the production temperature increases, the O/C ratio decreases (Chen and Chen 2009, Oh et al. 2012, Fernandez et al. 2015), but as biochars oxidize (as may occur with composting), the O/C ratio increases until a steady state (Brewer 2012).
The pH of the untreated and composted biochars was 7.6 and 8.5, respectively (p = 0.002). Some of the pH values reported in previous studies of untreated biochars were higher than ours (> 8) (Table II), except Pellera et al. (2012) whose biochar pH was 2.42, probably because authors applied HCl and deionized water to the biochar, washing possible alkaline substances. Biochar alkalinity is related to the production temperature used, since the higher the temperature and/or residence time, the higher the pH (Oh et al. 2012, Pellera et al. 2012, Dai et al. 2013).
The EC of the untreated and composted biochars was 5.7 and 4.4 dS/m, respectively (p = 0.026). These values are higher than most of the previous studies with citrus-peel biochars (Table II). Prakongkep et al. (2015) mentioned that fruit wastes might have high contents of minerals (particularly Ca, Mg and K). Additionally, EC is related to the production temperatures. Tag et al. (2016), for instance, observed that high-temperature biochars (600 ºC) presented higher EC than low-temperature biochars (250 ºC) regardless of feedstock. Biochars with alkaline pH (> 7.5) and high EC values (> 4 dS/m) can increase the soil salinity. In acid soils, this could improve the balance among ions and reduce the toxicity of aluminum (Dai et al. 2017). However, there is a risk to increase the soil salinity in neutral or alkaline soils (Saifullah et al. 2018). Thus, pH and EC values have to be monitored when biochar, composted or not, is applied to soils.
The concentrations of micronutrients, namely Fe (3.7 mg/kg), Cu (1.5 mg/kg), Zn (7.1 mg/kg) and Mn (6.3 mg/kg) were small compared to the composted biochar, whose metal concentrations were more than double: Fe (131 mg/kg), Cu (3.8 mg/kg), Zn (36.0 mg/kg) and Mn (21.4 mg/kg) (Table II) suggesting that these micronutrients were supplied by the conifer pruning added for composting. Only Fe and Zn concentrations were significantly different between the untreated and the composted biochar (Fe: p = 0.002, Cu: p = 0.24, Zn: p = 0.002, Mn: p = 0.12). The biochar produced by Aon et al. (2015) had higher concentrations of micronutrients than our biochars (Table II); citrus peels may contain more Fe, Cu, Zn and Mn, than pineapple peels (Prakongkep et al. 2015, Romelle et al. 2016).
The untreated biochar had 157.1 mg/kg extractable P, which is in line with Xiao et al. (2016) whose straw biochar had a content of 158.5 mg/kg P. The composted biochar extractable P was 296 mg/kg which was significantly higher than the untreated one (p = 0.002). Depending on the soil and crop requirements, application of biochar along with phosphate fertilizers may be useful. However, biochar may improve the soil P availability by modifying the soil pH, the P complexing metals (Ca2+, Al3+ and Fe3+2+), the microbial activity or the P mineralization (DeLuca et al. 2009).
The exchangeable cations of the untreated biochar were 18.6, 4.8, 1.0 and 34.6 cmolc/kg, for Ca, Mg, Na and K, respectively; while for the composted biochar values were 31.1, 10.3, 1.4, 31.1 cmolc/kg, for the same ions (Ca: p = 0.005, Mg: p = 0.005, Na: p = 0.004, K: p = 0.005; Table II). Composting the biochar increased significantly all the exchangeable cations except K, which means that this method could rise nutrient content of the amendment but also its alkalinity (Na increase). Compared to other studies, our untreated biochar results are in line with Oh et al. (2012) except for K, which in our case was more than double. This could be attributed to the mixture of feedstock we used compared to their orange peels biochar. Namely, pineapple peels can have higher K concentrations than orange peels making them more beneficial to soil (Prakongkep et al. 2015).
The FT-IR spectra of our biochars have few OH groups (~3600 cm-1) in their composition. We did not observe the presence of the band ~1700 which corresponds to the COOH region. The ~1600 cm-1 band, which corresponds to the aromatic C=C and to the COO-carboxylates, presents a greater intensity in the composted biochar. Fernandez et al. (2015) interpret the increase in these signals as an increase in the aromatic structures within the biochar, promoting favorable conditions for the adsorption of compounds such as pyrene (Wang et al. 2016). However, it should be noted that in the case of the composted biochar this region could be attributed to the increase of COO- groups by the composing process (the composted biochar has more exchangeable COO- sites than the untreated biochar). This means the composted biochar has greater cation exchange capacity than the untreated one (as shown by the exchangeable cations sum) because the carboxylates and hydroxyl groups are responsible for this property (Stella Mary et al. 2016). However, due to the pH (7.6 and 8.8) these groups are deprotonated (pKCOOH ~3.5 - 4). This explains the absence or few OH groups (~3600 cm-1), which could form part of the COOH region.
The energy absorption bands of the CH bonds of aliphatic systems (3000 - 2800 cm-1) show higher values in the composted biochar than in the untreated one; by integrating this region we found that the area is larger in the composted than in the untreated biochar. This region of the spectrum has been used to predict whether the material has potentially mineralizable compounds or not (Capriel et al. 1995).
The band indicating C-O bonds within aromatic systems (C-O 1370 cm-1) is slightly higher (16 %) in the composted than in the untreated biochar. This region can also be attributed to nitro-compounds (NO2 1374 cm-1) (Stella Mary et al. 2016). This could be relevant because its relation with the number of substitutions present in such aromatic systems.
The energy absorption bands of the oxygen base groups within aliphatic chains (C-O 1020 and 1000 cm-1) are 40 - 50 % more intense in the composted biochar. Dai et al. (2013) point out that the 1000 cm-1 band is due to C-O of alcohols derived from intact cellulose and hemicellulose. These functional groups may form part of the cellulose, partially mineralized or not. The increase of these oxygen-based functional groups (COO-, C-O aromatic and C-O aliphatic) is in line with the values of the H/O ratio, confirming the increase of oxygen base groups due to the composting process.
Based on the signal of the energy absorption bands corresponding to the CH bonds of aromatic systems (860, 800, 750 cm-1) it can be inferred that there is the same proportion of di- and mono-substituted systems in the untreated biochar, because the intensity of these bands has the same value. In the composted biochar a greater abundance of di-substituted systems is observed. This difference could be attributed to the composting process or the humification process (mineralization and microbiological transformation) of lignin. The differences in the proportion of aliphatic and aromatic compounds influence the sorption behavior of the polar and non-polar hydrophobic organic compounds. Chen and Chen (2009), for instance, found that by increasing the degree of biochar aromaticity (e.g., those produced at high temperatures) the affinity for non-polar hydrophobic organic compounds, such as the naphthalene, increases too, while the presence of aliphatic compounds increases the affinity of the polar hydrophobic organic compounds (1-naphtol). The above increases the biochar affinity to non-polar hydrophobic organic compounds, and composting it, promotes the adsorption of polar hydrophobic organic compounds.
Aliphatic oxygen base groups, O/C ratio 0.54 and high hydrophobicity confirm that the composting process enriches the material with short residence time (labile) carbon such as cellulose-like substances. The untreated biochar offers a more promising option for the long-term stabilization of soil carbon.
In presence of the untreated biochar, germination was significantly low (66.7±13.3 %; p = 0.0016) compared to the control (90.0±0.0 %) and to the composted biochar (90.0±5.8 %). According to prior studies, low-temperature biochars may suppress germination due to the existence of toxic compounds (Oh et al. 2012, Liang et al. 2016). Although some biochar toxicants can be quickly degraded in a couple of days, highly resistant PAHs or other substances may further persist, thus treatments to eliminate them should be carried out (Borchard et al. 2014).
The untreated biochar has higher concentrations of PCDD/PCDF and PAHs than the composted biochar (Table III). This indicates that composting can be an effective way to reduce the toxicity of biochars (Borchard et al. 2014). It is worth mentioning that both biochars have PCDD/PCDF and PAHs concentrations below the maximum allowed thresholds according to IBI (2015) and EBC (2017) guidelines.
TABLE III CONCENTRATIONS OF POLYCHLORINATED DIBENZO-P-DIOXINS, POLYCHLORINATED DIBENZOFURANS AND POLYCYCLIC AROMATIC HYDROCARBONS (PAHs) OF THE UNTREATED AND COMPOSTED BIOCHARS.
| Toxicant | Untreated biochar | Composted-biochar |
| Polychlorinated dibenzo-p-dioxins | [ng/kg dw] | [ng/kg dw] |
| 2,3,7,8-Tetrachlorodibenzodioxin | < 1 | < 1 |
| 1,2,3,7,8-Pentachlorodibenzo-P-dioxin | < 1 | < 1 |
| 1,2,3,4,7,8-Hexachlorodibenzo-P-dioxin | < 1 | < 1 |
| 1,2,3,6,7,8-Hexachlorodibenzo-P-dioxin | < 1 | < 1 |
| 1,2,3,7,8,9-Hexachlorodibenzo-P-dioxin | < 1 | < 1 |
| 1,2,3,4,6,7,8-Heptachlorodibenzo-P-dioxin | 54 | < 5 |
| Octachlorodibenzodioxin | 494 | < 15 |
| Polychlorinated dibenzofurans | [ng/kg dw] | [ng/kg dw] |
| 2,3,7,8-Tetrachlorodibenzofuran | 3 | < 1 |
| 1,2,3,7,8-Pentachlorodibenzofuran | 1 | < 1 |
| 2,3,4,7,8- Pentachlorodibenzofuran | 2 | < 1 |
| 1,2,3,4,7,8-Hexachlorodibenzofuran | 2 | < 1 |
| 1,2,3,6,7,8- Hexachlorodibenzofuran | 2 | < 1 |
| 1,2,3,7,8,9- Hexachlorodibenzofuran | 1 | < 1 |
| 2,3,4,6,7,8- Hexachlorodibenzofuran | 2 | < 1 |
| 1,2,3,4,6,7,8-Heptachlorodibenzofuran | 13 | < 3 |
| 1,2,3,4,7,8,9- Heptachlorodibenzofuran | 3 | < 3 |
| Octachlorodibenzofuran | 17 | < 10 |
| Toxicity equivalents | [ng/kg dw] | [ng/kg dw] |
| NATO/CCMS-TE (I-TEQ) | 5.1 | 3.0 |
| WHO-TEQ 1998 | 5.1 | 3.5 |
| WHO-TEQ 2005 | 4.8 | 3.2 |
| Polycyclic aromatic hydrocarbons | [mg/kg dw] | [mg/kg dw] |
| Acenaphthene | < 0.1 | < 0.1 |
| Acenaphthylene | 0.1 | < 0.1 |
| Anthracene | 0.3 | 0.1 |
| Benz(a)anthracene | 0.2 | 0.1 |
| Benzo(a)pyrene | 0.1 | < 0.1 |
| Benzo(b)fluoranthene | < 0.1 | < 0.1 |
| Benzo(g,h,i)perylene | < 0.1 | < 0.1 |
| Benzo(k)fluoranthene | < 0.1 | < 0.1 |
| Chrysene | 0.2 | 0.2 |
| Dibenz(a,h)anthracene | < 0.1 | < 0.1 |
| Fluoranthene | 0.3 | 0.3 |
| Fluorene | 0.4 | 0.1 |
| Indeno(1,2,3-cd)pyrene | < 0.1 | < 0.1 |
| Naphthalene | 1.4 | 0.8 |
| Phenanthrene | 0.9 | 0.5 |
| Pyrene | 0.4 | 0.3 |
| ΣPAHs (EPA) | 4.5 | 2.5 |
dw = dry weight, EPA = United States Environmental Protection Agency, NATO/CCMS-TE (I-TEQ) = North Atlantic Treaty Organisation/Comitee on the Challenges of the Modern Society/Toxic Equivalent (International Toxic Equivalent), WHO-TEQ =World Health Organization-Toxic equivalent
Compared to other biochars, Hale et al. (2012) reported total dioxin concentrations from 0.005 to 1.2 ng/kg for ca. 50 biochars produced via slow pyrolysis (250 - 900 ºC), using different feedstock such as manure, food waste, straw or wood. Authors pointed out that the higher levels of dioxins could be attributed to a high NaCl content in the biomass. PAHs concentrations of biochar reported by Madej et al. (2016) were <1.5 mg/kg in biochars from wood and straw biomass pyrolyzed at 500, 600 and 700 ºC for 4 h, detecting the lowest PAHs concentrations at 600 ºC. Gondek et al. (2017) found the highest total content of PAHs in rape straw biochar (3.564 mg/kg), and the lowest in sawdust biochar (0.105 mg/kg), attributing the PAHs concentrations to the pyrolysis and to the feedstocks characteristics.
Hardwood biochars had non-detectable concentrations of naphthalene and furan six months after composting according to Borchard et al. (2014). In our case, toxicants reduction was more evident for 1,2,3,4,6,7,8-HpCDD, OCDD, all the PCDF, fluorene, naphthalene and phenanthrene (Table III).
It is worth mentioning that the composted biochar was applied to a highly saline-sodic soil and monitored during a 2-year field test (Chávez-García and Siebe 2019). Results showed this amendment was the most recommendable to be used (compared with another biochar and one compost), due to its positive effects on the survival of a saltgrass (Distichlis spicata), soil organic matter increase and minimal GHG emissions.
CONCLUSIONS
Composting of biochars has the potential to improve the fertility and carbon sequestration properties of these amendments, while reducing the volume of organic waste. In this study, properties such as the TPV and the nutrient contents (Fe, P, Ca and Mg) were higher in the composted than in the untreated biochar. Additionally, both biochars had higher values of WHC and TPV compared to other biochars from similar feedstock, a favorable feature in dry or polluted soils. Possible toxicity of the untreated biochar can be avoided by composting with non-charred organic residues, while contributing to the increase in nutrient concentration of the amendment. Therefore, composted biochar produced out of orange and pineapple peels can be a promising soil amendment due the combination of a stable C-rich material, labile organic matter rich in nutrients and low toxicants according to existing biochar regulations. Field studies under different soil conditions are recommended for a deeper understanding of composted biochar as soil amendment and plant fertilizer.

