


 nueva página del texto (beta)
 Inglés (pdf)
 Artículo en XML
 Referencias del artículo
 Enviar artículo por email
 Citado por SciELO
  Similares en
SciELO
Similares en
SciELO 
 Permalink
INTRODUCTION
In the last decades, marine pollution by plastic waste has become a topic of global concern, due to its presence on different marine habitats, such as the water surface, beaches and even the ice in the Arctic, as well as its prevalence and the adverse effects that it causes in marine species (Law 2017). It has been estimated that 6.4 million tons of waste go into the ocean each year and that between 60 % and 80 % are plastics (Derraik 2002, Walker et al. 2006, Beiras and Beiras 2018). The high concentration of microplastics in the ocean has two main causes; first is the increase in the global production of plastics, which reached 322 million tons in 2015 and 335 million tons in 2016 (PE 2017). The second cause is the inefficient waste management, especially of those produced near the shores or the sea (NOAA 2018), and the low recycling level, estimated in 9 % worldwide (UN 2018).
Marine pollution by plastic waste includes macro and microplastics. Macroplastics are pieces bigger than 5 mm that arrive to the ocean transported by rivers, untreated wastewater, as industrial waste, by losses or accidents on marine transportation, as well as due to tourism in beaches (UNEP 2005, Barnes et al. 2009). In the other hand, microplastics are particles up to 5 mm (UNEP 2014) in any of their three dimensions (length, width, diameter). They can have different shapes: spheres, fibers, irregular fragments or pellets (Wright et al. 2013).
Microplastics can be classified as primary or secondary. Primary microplastics are produced in microscopic size for their use in industrial and domestic activities (UNEP 2016). They include the microbeads that are sometimes added to personal care products such as cosmetics, toothpaste and creams (Napper 2015, UNEP 2016), as well as pellets, the raw material used in the plastic industry (NOAA 2018). Primary microplastics reach marine environments due to leakage during their production or transportation, failures in their management during their use in industries or directly by the use of certain products (UNEP 2014). In the other hand, secondary microplastics are formed by the erosion and fragmentation of bigger plastic pieces, that are degraded by UV radiation, oxidation, mechanical stress or biodegradation (UNEP 2016).
The risk of microplastics as pollutants is related to their ubiquity and size, that cause them to be ingested by a wide range of organisms that can suffer physical and toxicological damage (Law and Thompson 2014, Botterell et al. 2019). Previous research has shown that microplastics can be ingested by marine birds (Amélineau et al. 2016), mollusks (Browne et al. 2008), echinoderms (Graham and Thompson 2009), zooplankton (Lee et al. 2013, Cole et al. 2015, Cole et al. 2016, Sun et al. 2017) and coral (Hall et al. 2015). Their ingestion produces physical injuries (Gall and Thompson 2015), decrease in the rates of growth and fertility (Jeong et al. 2016), changes in the ability of feeding (Cole et al. 2015), decrease in survival rates and even death (Lee et al. 2013).
These small plastic fragments can also sorbe chemical hydrophobic pollutants and metals from the surrounding water. It has been found that low-density polyethylene (LDPE) can sorbe polycyclic aromatic hydrocarbons (PAH), polychlorinated biphenyls (PBC) and polybrominated biphenyls (PBDE) (Rochman et al. 2013). Polypropylene (PP) and polystyrene (PS) tend to adsorb PAH, hexachlorocyclohexanes (HCH) and chlorinated benzenes (CB) (Lee et al. 2014). Polyvinyl chloride (PVC) can sorbe phenanthrene and dichlorodiphenyltrichloroethane (DDT) and polyethylene pellets sorbe Fe, Al, Mn, Pb, Cu, Zn and Ag (Ashton et al. 2010, Holmes et al. 2012).
To face this global problem, extensive research has been done to analyze the presence and effects of microplastics on marine and coastal environments. Those studies apply different methods for the sampling, extraction, characterization and classification of microplastics. There is a lack of globally accepted techniques for the study of microplastics (Li et al. 2017), so a need exists to define replicable and straightforward methods that allow comparison, limit crossed pollution and damage of samples during the analysis process (Correia et al. 2019).
This research aims to contribute to the solution of this global problem by the proposal of a methodology for sampling and characterization of microplastics on sand beaches. A short review of previously reported research is done, and then the proposed method is described in detail. It uses simple but robust techniques and can be done using common laboratory materials. Also, it allows the reporting in different types of units so that they can be compared with the previous research.
Methodologies applied for the sampling of microplastics on sand beaches
The lack of standardized techniques for the sampling of microplastics hinders the capacity of monitoring and also of comparing different studies. In this context, a review was done to identify the main features of the methods used in previous research. Papers published in the last five years (2014-2018) were reviewed. They were retrieved from the Digital Library from Universidad Autónoma Metropolitana (BIDI-UAM 2019), using as keywords in the “basic search” field “microplastics + beaches,” “microplastic pollution + marine environments” “microplastics + coast.” Articles of indexed journals, which included a detailed description of their methods, were selected to create a base of 17 papers. We found that even there is a high number of articles published, most of them do not describe their methodology with a detail that allows replicability.
The results are shown in table I. It can be observed that the number of beaches sampled varied from 1 to 35, with an average of 13, while sampling points go from 2 to 12, with an average of 4.9. Only four papers define the length of the sampled transect (10-300 m), and they do not state the distance between sampling points. Sampling is usually done in the high tide zone (where sediments accumulate), where the higher concentration of microplastics is found (Cole et al. 2011, Lavers and Bond 2017).
TABLE I COMPARISON OF STUDIES OF MICROPLASTICS PRESENT ON SAND BEACHES
| Country | Parameters included in the studies of microplastics on sand beaches | Reference | |||||||||||
| Number of beaches | Beach transect (m) | Points sampled by beach | Distance between points (m) | Frequency (annual) | Sampling hour | Area | Depth (cm) | Sampling zone | Tool for collection | Storage | Place of separation of MP | ||
| Singapore | 7 | N.S. | 3 | 2-3 | 1 | Low tide | 1.5 x 1.5 m | 3-4 | N.S. | Steel spatula | N.S. | Laboratory | (Mohamed Nor and Obbard 2014) |
| China | 5 | N.S. | N.S. | N.S. | 1 | Low tide | N.E. | 1 | Below the high tide | N.S. | Aluminum bags | Laboratory | (Qiu et al. 2015) |
| Portugal | 10 | 100 | 3 | N.S. | N.S. | N.S. | N.S. | N.S. | N.S. | N.S. | N.S. | N.S. | (Frias et al. 2016) |
| United States | 7 | N.S. | 12 | Random | 1 | Low tide | 0.25 x 0.25 m | 3-6 | Intertidal | Steel spatula | N.S. | Laboratory | (Wessel et al. 2016) |
| Mexico | 35 | N.S. | N.S. | N.S. | 2 | N.S. | N.S. | N.S. | High tide line | N.S. | N.S. | Laboratory | (Retama et al. 2016) |
| United States | 2 | N.S. | 3 | N.S. | 1 | N.S. | 1 x 1 m | 5-10 | High tide line | N.S. | N.S. | Field | (Young and Elliott 2016) |
| Brazil | 17 | N.S. | 2 | N.S. | 2 | N.S. | 1 x 1 m | 5 | High tide line | N.S. | Plastic buckets | Laboratory | (de Carvalho and Baptista 2016) |
| Qatar | 8 | N.S. | 3 | Random (separation of 5 per point) | 1 | N.S. | 0.5 x 0.5 m | 2 | High tide line | N.S. | Glass container | Laboratory | (Abayomi et al. 2017) |
| Europe | 23 | 40 | 5 | 10 | 1 | N.S. | N.S. | 5 | High tide line | Metal shovel, GPS | Plastic bag with an airtight seal | Laboratory | (Lots et al. 2017) |
| England | 2 | 10 | N.S. | N.S. | 1 | N.S. | N.S. | Superficial | High tide line | Steel tweezers | N.S. | Laboratory | (Massos and Turner 2017) |
| Mexico | 1 | 100 | N.A. | N.A. | 1 | At dawn (6:00 a.m.) | 35 x 100 m | Superficial | Low tide to high tide | Manually | Plastic bags | Laboratory | (Alvarez- Zeferino et al. 2017) |
| China | 28 | N.S. | 5 | N.S. | 1 | N.S. | 1 x 1 m | 0-2 | N.S. | Metal shovel | N.S. | Laboratory | (Zhang et al. 2018) |
| United States | 18 | 50 | 10 | N.S. | 1 | Low tide | Cylinder 25 cm ø, 1.5 cm height | 1.5 | High tide line | Metal shovel | Aluminum bags | Laboratory | (Yu et al. 2018) |
| India | 25 | N.S. | N.S. | N.S. | 1 | N.S. | 1 x 1 m | 5 | High tide and low tide line | Stainless steel spoon | Stainless steel container | Laboratory | (Karthik et al. 2018) |
| Mexico | 21 | 300 | 3 | Random | 1 | N.S. | 2 x 2 m | 5 | High tide line | Metal pallet | Glass container with a metal lid | Laboratory | (Piñon-Colin et al. 2018) |
| Mexico | 1 | 100 | 5 | Random | 1 | N.S. | 0.5 x 0.5 m | Superficial | High tide line | Steel shovel | Plastic bag with an airtight seal | Laboratory | (Rosado-Piña et al. 2018) |
| Islands of the Lesser Antilles | 21 | N.S. | 5 | 20 | 1 | N.S. | 0.5 x 0.5 m | 5 | High tide line | Metal spoon | Plastic bag with an airtight seal | Field and Laboratory | (Bosker et al. 2018) |
N.S. = not specified, N.A. = not applicable, ø = diameter, MP = microplastics
The sampled area can take different shapes: ten works use a square frame, which size goes from 0.25 m to 2 m. Only one author uses a cylindrical sampler, six studies do not describe their sampling tools, and one reports to have collected all the microplastics present in the beach (transect of 100 m and 35 m of beach width). The depth of sampling ranges from superficial to 10 cm. The used tools are commonly from stainless steel, and samples are kept on zip-locked plastic bags.
Microplastics can be extracted from sand in situ or in the lab; however, while in situ extraction decreases the materials that have to be transported, it increases the risk of crossed pollution of samples. Fourteen papers report to have performed the extraction in the lab, one in situ and one in both places, in order to compare the efficiency of the processes. In one of the articles there is no mention of the place where extraction was performed.
Most of the papers report only one sampling campaign. However, the frequency will depend on the goal of each research; if the objective is monitoring, sampling must be done at regular intervals to have defined accumulation time frame (ARI 2018). Only five researches state the time of the day when the sampling was done: four did it at low tide and one at dawn (6:00 a.m.); this can be significant, as the influx of visitors will vary along the day, and the cleaning of the beach (if it takes place) will usually happen at fixed times. Both factors can affect the presence of microplastics. As table I shows, methods are diverse, and not all the sampling parameters are described by the authors.
Methodologies applied for the analysis and classification of microplastics
The methods used in the cited papers for the treatment and classification of microplastics were analyzed and are presented in table II. It was found that the management of the samples generally includes stages of drying, extraction or separation of microplastics from sand, identification and quantification (Fig. 1). It is worth to notice that some of the articles considered microplastics as particles between 0.3 and 8 mm, differing from the size (less than 5 mm) defined by the United Nations Environment Programme (UNEP 2014). This difference is probably due to the instruments used for sampling or the specific objectives of each research.

Fig. 1 Stages and used techniques in the analysis of microplastics. FTIR = Fourier transform infrared spectroscopy
TABLE II COMPARISON OF THE TREATMENT OF SAND BEACHES SAMPLES FOR THE EXTRACTION OF MICROPLASTICS
| Country | Parameters included in the treatment of samples of sand beaches | Reference | ||||||
| Drying | Separation or extraction of MP | Elimination of organic matter | Size of microplastics | Identification technique | Plastics found | Results | ||
| Singapore | 60 ºC for 24 h | Density, sieving and filtration | Sieving with a mesh of 0.1 cm | < 20-5000 µm | FTIR | PE, PP, nylon and PVC | 3.0-15.7 pcs/250 g ds | (Mohamed Nor and Obbard 2014) |
| China | 50 ºC to constant weight | Density and filtration | N. S. | < 5 mm | Fluorescence microscopy | HDPE, PET, polyester and PS | 216-608 pcs/50 g ds | (Qiu et al. 2015) |
| Portugal | 60 ºC y 48 h | Density and filtration | N.S. | N.S. | FTIR | PP and rayon | 0.01 pcs/g | (Frias et al. 2016) |
| United States | N.S. | Sieving and Density | Sieving with a mesh of 200 µm | N.S. | FTIR | PE and PP | 5-117 pcs/m2 | (Wessel et al. 2016) |
| Mexico | Ambient temperature | Density and filtration | 30 % H2O2 solution | < 5 mm | Scanning electron microscopy | N.R. | 0-70 pcs/30 g ds | (Retama et al. 2016) |
| United States | N.S. | Density | N.S. | 0.5-8 mm | Raman spectroscopy | PE and PP | 16206-28782 pcs | (Young and Elliott 2016) |
| Brazil | 60 ºC | Density and filtration | Visual | N.S. | Stereoscopy | Unidentified | 12-1300 pcs/m2, 3-743 pcs/m2 | (de Carvalho and Baptista 2016) |
| Qatar | 60 ºC | Sieving, density and filtration | Sieving with a mesh of 2 mm | 2 mm | FTIR | PE and PP | 36-228 pcs/m2 | (Abayomi et al. 2017) |
| Europe | 60 ºC for 48 h | Density and filtration | N.S. | < 5 mm | Microscopy, Raman spectroscopy | PE and PP | 72-1512 pcs/kg ds | (Lots et al. 2017) |
| England | 40 ºC for 24 hrs. | Sieving | N.S. | < 5 mm | FTIR and fluorescence spectroscopy | PE and PP | 436-488 pcs | (Massos and Turner 2017) |
| Mexico | 105 ºC for 24 h | Visual | N.S. | N.S. | Unidentified | Unidentified | 97 - 150 pcs | (Alvarez-Zeferino et al. 2017) |
| China | N.S. | Density | N.S. | <1-5 mm | FTIR | PE, PP and PS | 1-7 pcs | (H. Zhang et al. 2018) |
| United States | 50 ºC for 48 h | Density | Visual with tweezers | N.S. | Digital microscopy 75X and FTIR | PET | 24 % PET and 68 % Fibers | (Yu et al. 2018) |
| India | N.S. | Density and sieving | Visual | 0.3-4.75 mm | Stereoscopic microscopy and FTIR of ATR | PE, PP, PS and nylon | High tide 368 pcs and low tide 80 pcs | (Karthik et al. 2018) |
| Mexico | 60 ºC for 48 h | Sieving and density | N.S. | N.S. | Optical microscopy with lens W10 x 20 and FTIR of ATR | Polyacrylamide, nylon type polyamide, polyacrylic and PET | 6 - 312 pcs/kg dry mass; 91 % fibers, 5 % film, 3 % spheres y 1 % granules | (Piñon-Colin et al. 2018) |
| Mexico | Ambient temperature for one week | Sieving | N.S. | 1.13-4.75 mm | FTIR | PE, PP and PS | 51 - 132 pcs; 77 % rigid, 10.5 % fiber, 9 % flexible, 2 % pellet y 1.5 % foamed | (Rosado-Piña et al. 2018) |
| Islands of the Lesser Antilles | N.S. | Sieving, density and filtration | Visual | N.S. | Stereoscopic microscopy 40X | Unidentified | 68 - 620 pcs/kg dry mass; 97 % fibers y 3 % particles | (Bosker et al. 2018) |
N.S. = not specified, N.R. = non recurring, h = hours, FTIR = Fourier transform infrared spectroscopy, PE = polyethylene, PP = polypropylene, PVC = polyvinyl chloride, HDPE = high density polyethylene, PET = polyethylene terephthalate, PS = polystyrene, ds = dry solids, pcs = pieces
The drying of the sand samples eases their management and allows to report results both, in wet and dry basis. In the reviewed papers it was done from room temperature to 105 ºC, lasting from 24 h up to one week. The techniques used to extract microplastics from sand were density separation (using solutions with different densities which allow plastics to float), sieving and filtration. Identification was usually performed by Fourier transform infrared spectroscopy (FTIR) and microscopy. The plastics found in higher frequency were PE and PP.
Great diversity was observed on the sampling and classification methods used in the reviewed papers. Variations can be attributed to economic factors, lack of trained staff, difficulty in accessing analytical equipment, lack of materials or space, among other causes. Comparison of results is not always feasible, due to lack of information or use of different techniques. The units used to report the results are defined by the goal of the study, as well as by the available information, and there is no consensus about the proper way to present results.
PROPOSED METHODOLOGY FOR THE SAMPLING, QUANTIFICATION AND CLASSIFICATION OF MICROPLASTICS ON SAND BEACHES
This section describes a methodology for the sampling of microplastics on sand beaches. The proposed methods pose advantages such as low cost, availability of required materials in laboratories, replicability and versatility, given the option to present results in different units to allow comparison. Variables, criteria and stages are described in detail, as well as recommended values. It also explains a procedure to treat samples that include other materials (shells, organic matter) to avoid false positives.
Figure 2describes the procedure, which can be divided into two phases. The first phase is fieldwork and includes three stages: location of high tide line and selection of transect, random selection of sampling points and sampling. The second phase, performed in the lab, includes drying, extraction of microplastics, classification and quantification.

Stage 1. Identification of high tide line and selection of transect
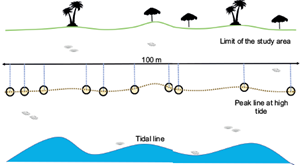
The area of study must be defined by the objectives and scope of the research. It is recommended to focus on the area comprised between the tide line at the time of sampling (defined by the waves) and the limit set by dunes, vegetation or infrastructure.
Distribution and transport of waste and microplastics in beaches are highly influenced by the tides. It is advisable to do the sampling over the high tide line, where waste and sediments tend to accumulate. The shape of the high tide line will vary according to the shape of the beach. However, it will present an oscillatory pattern. Sometimes tide lines are almost linear (Fig. 3a), while other times oscillations are highly marked. In some cases, the lines show a heterogeneous pattern (Fig. 3b).

Fig. 3 Examples of high tide forms: a) tide line almost linear and b) tide line with a heterogeneous pattern
Microplastics tend to accumulate along the high tide line, due to the effect of the surge. Sampling must be done along a 100 m segment of the high tide line (transect), where it is clearly visible (Fig. 4). In some cases, more than one high tide line can be found, then the line located farthest must be selected, as it will be less disturbed (Fig. 5a). The selected transect is then marked with a 100 m rope fixed with stakes. Five-meter segments can be previously marked in the rope, to ease the measurement of distances in the field (Fig. 5b). The rope must follow a straight path that traces the direction of the high tide line, even if it does not touch the line in all their length.


Stage 2. Selection of sampling points
To increase the meaningfulness of the results at least ten sampling points should be selected along the sampling transect. Sampling points can be selected randomly, or according to an established criterion (i.e., equidistant points), depending on the objective of the research. The shape of the beach, presence of infrastructure and touristic activity, among other factors, will affect microplastics distribution; further research is needed in order to analyze how sediments and microplastics accumulate along the high tide line. Once the sampling points have been selected, in each one the position over the rope most is reflected through an imaginary perpendicular line in the high tide zone (Fig. 6).
Stage 3. Sampling
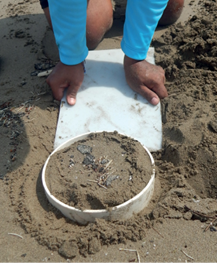
Samples are taken on the high tide line. In most studies samples are obtained by scraping the superficial sand in a defined area. However, this method does not guarantee homogeneity in the depth or mass of samples. To overcome this, we propose to use a plastic cylinder (PVC) cut from commercially available pipeline, measuring 19 cm of diameter and 5 cm of height. This sampler is cheap, resistant, is easy to handle and allows taking samples with constant dimension, which makes possible to report results in terms of volume, area or length of sampling. Before using it, the cylinder must be checked to detect fissures or wear and tear, which could produce plastic particles that would be accounted for as microplastics. If desired, the cylinder could be manufactured from stainless steel, with similar dimension.
If the width of the high tide line is smaller than the sampler diameter, the cylinder must be aligned to ensure that the sediments and microplastics are kept inside it (Fig. 7a). Sometimes the tide lines are not well defined and can be wider than the sampler; in that case, the cylinder must be aligned with the border that is farther from the water (the most undisturbed zone; Fig. 7b).

The sampler must be plunged applying pressure from the top to bottom until its upper edge reaches the surface of the sand. This action will be easy to do in beaches with coarse sand, while beaches with fine and compacted sand will require a circular movement to introduce the cylinder (Fig. 8a). The process can be eased by removing the sand around the sampler or by using a rubber gavel (Fig. 8b).

Once the sampler has been inserted, the sand around it must be removed with a small shovel, to allow removing of the sample. The removal is done by sliding a stainless steel sheet under the sampler (Fig. 9).
The sampled sand can be translated directly to the lab or can be subjected to volume reduction in situ, to lower the volume of transported materials. Choosing one of these options will depend mainly on logistics, availability of transportation and closeness of the laboratory. Volume reduction is made with mesh 16 sieve (openness 1.13 or near to 1 mm), which will allow separating microplastics and particles of similar size (~1.13 - 5 mm). If the sand is wet, seawater can be used to improve its transit through the mesh. The water needs to be filtered using the same sieve before using it, to prevent pollution by plastic pieces that could be floating on it.
The samples taken in the field must be packed in aluminum foil, labeled and stored in zip-locked plastic bags. It is advisable to take a sample of sand, in case further measurement of moisture or grain size is needed.
Stage 4. Drying
A clean surface, not exposed to air currents that could cause deposition of pollutants, is required for the managemente of the samples. Drying begins with the weighing of the wet sample, with an analytical balance (precision ± 0.01 g). Then the sample is transferred to aluminum trays (dried before to constant weight), to be dried in a stove or furnace at 105 ºC for 24 h. This temperature will vaporize the water, but will not affect the sand or the microplastics. When the sample is dried it must be weighed again.
Stage 5. Microplastics extraction
The removal of microplastics from the sand sample is done by a sequential sieving - flotation process. The dried sample is passed through a 16-mesh sieve to separate the sand. The particles held in the sieve (> 1.13 mm) must be kept in a glass or stainless steel container until the flotation. Samples that were reduced in the field can go directly to the flotation step.
To extract the microplastics by flotation, the materials held in the sieve must be added to aqueous solutions that allow the microplastics to float and the remaining sand to sink. NaCl solutions (1.15 - 1.2 g/cm3) have been used (NOAA 2015, Van Cauwenberghe et al. 2015), however, they do not allow high density plastics, such as PETE (1.32-1.41 g/cm3) and PVC (1.14-1.56 g/cm3) (Van Cauwenberghe et al. 2015). To overcome this limitation ZnCl2 (1.5 - 1.7 g/cm3) (Imhof et al. 2013, Liebezeit and Dubaish 2012) and NaI (1.6 - 1.8 g/cm3) (Van Cauwenberghe et al. 2013a, Van Cauwenberghe et al. 2013b, Dekiff et al. 2014) solutions have been used. These solutions have higher efficiency in extracting microplastics, but a higher cost than the ones using NaCl (He et al. 2018).
To extract low and high density plastics in a cost-effective way a CaCl2 solution (ρ≈1.6 g/mL, 37 g of in 50 mL of water) (Kedzierski et al. 2016) can be used. A volume of at least 50 mL must be prepared and then added to the sieved materials in a glass base. The mixture must be shaken for one minute and then let to settle for another one. Natural fibers, fragments of shells and other materials that can be identified must be removed with stainless steel tweezers, shaking them lightly to avoid the entanglement or adhesion of microplastics. Once this task is completed, floating microplastics can be removed with tweezers, to be washed and dried in a stove or furnace at 60 ºC. Microplastics should be kept on glass containers until its further analysis.
Removal of false positives
In some beaches, the sediments settled on the high tide line include fragments of shells with high calcium carbonate content, as well as filamentous algae that can be wrongly identified as microplastics. In this case, the extraction procedure must be extended to eliminate those particles.
Calcareous fragments from shells can be identified using an acid solution of HCl 0.5 N. They will produce bubbles when put in contact with the acid solution, due to the formation of CO2. To test it, each particle must be sunk in the acid solution, to check for bubble production.
To dismiss organic matter (animal and plants detritus) an H2O2 (30 % v/v) is used. It will oxidize organic matter (Free et al. 2014). The particles must be sunk in the solution and shaken for three minutes. Biogenic ones will become yellowish and must be discarded. If the sample includes both, shells and organic matter, the described tests must be done in sequence.
This paper is not focused on microplastics < 1 mm. If those particles will be analyzed the procedure defined by NOAA (NOAA 2015) can be used. It includes density separation tests using a lithium metatungstate solution (ρ ≈ 1.6 g/mL); subsequently, the floating solids sieved in a 0.3 mm mesh. Microplastics are then extracted and transferred to a glass container to be weighed. The elimination of organic matter is done with hydrogen peroxide (20 mL, 30 ºC) added to a Fe (II) 0.05 M solution, that is then heated to 75 ºC until gas formation can be observed. Then 6 grams of NaCl for every 20 mL is added to the remaining solution and is heated until the salt is dissolved. Finally, the floating solids are extracted by density and analyzed with a 40x microscope.
Stage 6. Quantification of microplastics
The concentration of microplastics can be reported in different units, most based on counting or weighing all the particles found in every sample point. A convenient, standardized way is to express the results in terms of mass of microplastics (mg), applied to a different basis, as shown in table III. The volume of sand is calculated by the dimension of the sampler. When required, area can be computed as the base of the cylindrical sampler, and length as its diameter. After calculating the results for each sampling point, the average, median, standard deviation and interval of confidence must be computed.
TABLE III UNITS USED TO REPORT THE CONCENTRATIONS OF MICROPLASTICS
| Units | Meaning |
| mg MP/kgws | Milligrams of microplastics per kilogram of wet sediment |
| mg MP/kgds | Milligrams of microplastics per kilogram of dry sediment |
| # MP/kgws | Number of microplastics per kilogram of wet sediment |
| # MP/kgds | Number of microplastics per kilogram of dry sediment |
| # MP/lws | Number of microplastics per liter of wet solids |
| # MP/m2 | Number of microplastics per square meter |
| # MP/m | Number of microplastics per linear meter |
Stage 7 Classification of microplastics
Microplastics can be classified by size, shape, color and chemical composition.
Classification by size
If the total number of particles is low (i.e. < 30), the size of each piece can be measured placing it in a milimetric sheet, measuring directly with a rule or with a microscope. For spheres and circles, the size is defined by the diameter, as well as for fibers. Their smaller length defines the size of irregular fragments.
According to the objectives of the research, the microplastics could be further divided by sizes using different sieves (mesh 4, 5, 6, 7 y 16; 4.75, 4.00, 3.35, 2.83 and 1.13 mm, respectively, or similar sizes) (Fig. 10 a and b). This segregation will create sub-categories in the 5.00-4.01 mm, 4.00-3.01 mm, 3.00-2.01 mm and 2.00-1.00 mm ranges.

Classification by shape or type
There are different ways to describe the shape of a microplastic particle. A very comprehensive one is the proposed by Laglbeuer et al. (2014), which classifies microplastics as fibers, pellets, rigid fragments, foams and films (Fig. 11 a, b, c, d and e). The identification is made visually and can be improved with a microscope. Films are distinguished from rigid fragments by their flexibility, and foams by their ease of compression.

Classification by color
Color is a relevant feature of microplastics, as it has been associated with preferential ingestion by marine species (Carson 2013). A complete but straightforward classification was proposed by Boerger et al. (2010), which includes grey, white, blue, yellow, orange, green, pink, red, purple, black and transparent. These categories could be increased according to the specific needs of the research project. For example, if the study is focused on degradation, yellowing could be used as an indicator of UV attack.
Classification by chemical composition
The identification of the type of plastic in each microplastic can be made by different instrumental techniques, such as microscopy, Raman spectroscopy, FTIR and chromatography coupled to mass spectrometry (Lenz et al. 2015, Silva et al. 2018). Then the particles can be classified as PET, PE, PVC, PP, PS or others.
FTIR is the most used technique (Holmes et al. 2012) Co, Ni, Cu, Zn, Cd and Pb, as it preserves the integrity of the samples, has low cost (Rezania et al. 2018), poses minimal preparation required for the samples and is fast (Silva et al. 2018). The traditional method uses an attenuated total reflection (ATR) feature that is put directly in contact with the sample. This method is useful to analyze particles bigger than 2 mm to guarantee a stable response. The instrument produces a spectrum, which can be compared with a pre-defined library. Particles smaller than 2 mm and as small as 20 µm can be identified by Raman spectroscopy. Smaller particles will need µ-Raman spectroscopy. Raman is a no-destructive technique as FTIR (Lenz et al. 2015, Silva et al. 2018).
CONCLUSIONS
The world demand for plastics is continuously increasing, due to the versatility, lightness, strength and all the properties of these materials, that make them useful for different sectors and products. However, the degradation of plastics in beaches due to biotic and abiotic factors produce microplastics that can be transported by the water or the wind to different marine environments, putting in risk their equilibrium and the survival of many species.
Standardized methods and techniques, such as the one proposed in this paper, can be applied systematically, to quantify and classify microplastics in sand beaches. The proposed methodology, which can be applied to assess the concentration of microplastics (1 - 5 mm), allows comparison between different places, studies and timeframes.
The research about the presence of microplastics in marine environments is a broad and complex field; the study of sand beaches is only a fraction of the areas that have to be developed. Similar methodologies should be established and clearly defined for rivers, lakes, estuaries, mangroves and wetlands, as well as in marine species. Later, the results most lead to the creation of a legal framework and management plans focused to the wastes that can be found in beaches, which are one of the leading causes of the presence of microplastics.

