


 nova página do texto(beta)
 Inglês (pdf)
 Artigo em XML
 Referências do artigo
 Enviar este artigo por email
 Citado por SciELO
  Similares em
SciELO
Similares em
SciELO 
 Permalink
INTRODUCTION
In a mine site, the mineral of interest constitutes only a small fraction of the mined material (Wills and Finch 2015). As a consequence, the mining process generates large volumes of tailings and mine waste in general, which contain a high variety of heavy metals in a diversity of concentration levels (Burges et al. 2015, Pourret et al. 2016, Lam et al. 2016, 2017).
This process renders many hectares of soil unsuitable for agriculture and generates highly contaminated areas in which substances will move depending on the physicochemical properties of the substrate. Mobility will also depend on the climate conditions of the area in which the deposit is located (Alloway 2013, Chadwick et al. 1987, Li et al. 2014, Pandey et al. 2016, Antoniadis et al. 2017).
According to the survey carried out in December 2016 by the Chilean National Service of Geology and Mining (SERNAGEOMIN), there are 696 tailing deposits in Chile, of which 16.1 % are catalogued as active, 62.6 % as inactive and 21.3 % as abandoned. They are distributed from the Tarapacá region up to the Metropolitan region (Tarapacá 1.00 %, Antofagasta 6.18 %, Atacama 22.27 %, Coquimbo 52.87 %, Valparaíso 10.49 %, Bernardo O`Higgins 2.59 %, Maule 0.43 %, Aysén 0.72 % and the Metropolitan region 3.45 %).
In Chile, there have been several episodes of environmental impact on the marine environment due to the presence of mine tailing deposits which hamper port activities, generating geomorphological modifications on the coast and affecting coastal ecosystems and recreational activities (Castilla and Nealler 1978, Castilla 1983).
The environmental costs of the mining industry have become a liability for current and future generations that the Chilean state needs to solve. The great amount of mining environmental accountabilities is the product of historical mining, which was developed under deficient legislation. Furthermore, once the companies’ possibilities of extracting ore have been exhausted, the irresponsible closing of mines using low technology and inadequate plans fails to ensure the health and safety of people and the environment.
This brings about socio-environmental, financial and economic liabilities, affecting mainly communities close to the mining sites, where processes associated to extraction and processing of minerals are carried out, including electric generation, mineral transportation and waste disposal, among others (Marnika et al. 2015, Ettler et al. 2016, Lechner et al. 2016, Schoenberger 2016, Espinoza and Morris 2017, García-Ordiales et al. 2017).
Abandoned and/or paralyzed mining sites that are distributed along the country constitute potential sources of air, water and soil pollution, as well as potential harm to the environment and population’s health (Obiora et al. 2016, Antoniadis et al. 2017, Ghorbani and Kuan 2017, Christou et al. 2017, Espinoza and Morris 2017, Unger 2017).
It is imperative to face these issues, which require identifying the contaminated sites and the concentration and variability of contaminants present in them. It is necessary to give a solution to these liabilities as soon as possible, since they have generated chronic problems to the population, posing an even more serious threat to future generations.
Although there are no Chilean regulations for existing environmental liabilities, it is important to remark that given the rigorous normative established by the Ministry of Infrastructure and Water Management (MIWM) in the Dutch Soil Regulation Circular (MIWM 2013), this standard was applied in Chile by SERNAGEOMIN, in the same manner that it was used in other countries (Milenkovic et al. 2005, Swartjes et al. 2012).
Another important consideration is the Mine Closure Law, oriented to prevent the generation of future mining liabilities. Currently, Chile has a specific law that regulates the closure of mining operations and facilities. This law requires that once all the facilities finish their operations, a closure plan must be submitted to SERNAGEOMIN. This plan has to ensure the physical and chemical stabilization of every facility.
According to their monthly extraction, the companies will have to develop a mine closure plan, which must be submitted to the general application procedure (medium and large-scale mining), or to the simplified application procedure (small-scale mining). Undoubtedly, the law 20 551, which regulates mine closures, is a milestone for the mining sector. The stringent regulations of this law require that companies deliver financial guarantees to ensure the fulfillment of the activities and measures proposed in the closure plan.
SERNAGEOMIN measured geochemical data from 477 tailings deposits, out of 696 identified deposits, obtaining a total of 1324 records of the samples, whose results correspond to samples extracted from the surface of tailings ponds, walls and sediments downslope from the deposits (SERNAGEOMIN 2017).
The information available in the survey database corresponds to the concentration of 56 elements and species of each sample, which in turn are distributed into 12 major elements that constitute the minerals which make up the rocks (SiO2, Al2O3, TiO2, Fe2O3, CaO, etc.); percent of sulfur content; 14 rare earth elements, and 30 common elements in traces (0.82 % in mass). Although major elements are harmless to the environment, trace elements are not, and their concentrations could affect ecosystems and the population.
Information about the geochemical characterization, provided by SERNAGEOMIN, includes the concentration of precious and base metals, which is of interest for the valuation of these tailings. However, it also incorporates the main elements of environmental concern (EECs) related to mining activity in Chile: Cu, Cr, Ni, Zn, Pb, As, Cd and Hg. These elements are important for taking better decisions on public and environmental health and will be the focus of interest of this study.
The size of the deposits is of great interest, considering that the concentrations of the geochemical data are in g of element (or compound) per ton of tailing, which when multiplied by the mass of the deposit, provides the mass of the element or compound. Regarding the scale of the deposits, the smallest in the region of Antofagasta correspond to two dams belonging to EPV, one located in the commune of Sierra Gorda and the other in the commune of Taltal (Quebrada El Hueso), with 600 and 900 tons respectively, both are in an abandoned state. On the other hand, there are the deposits of Laguna Seca (Antofagasta) and the tailings dam Talabre (Calama), the largest in Chile, which belong to the mining company Escondida Ltda. and CODELCO respectively, both located in the Antofagasta region, with an approved capacity of 4500 and 2100 million tons, respectively.
The aim of this study was to analyze the geochemical data of the 30 mining tailings identified in the survey carried out by the SERNAGEOMIN in the Antofagasta region and, based on these results, to establish the feasibility of an intervention.
CASE STUDY
The analyzed tailings are located throughout the Atacama Desert in northern Chile. This region (Antofagasta) is characterized by a desert climate with high levels of solar radiation. The soils of the Antofagasta region have been developed under fundamentally abiotic conditions, as a consequence of the scarce rainfall and the high average annual temperatures, which are typical features of the Atacama Desert.
This desert is characterized by its unique and extreme climatic and geomorphological conditions; in this area, the world’s lowest annual precipitation values are reported, with an average of less than 1 mm/year. It is thus classified as a hyper-arid environment, characterized by extremely low levels of microorganisms, and low concentrations of organic material, with only refractory organic elements.
The studies developed in this area have determined the variability of the surface organic carbon content. The distribution of the concentration of labile organic carbon is bimodal, with an average of 17 ± 9 μg/g of soil and 69 ± 3 μg/g of soil for the lower and upper levels, respectively (de los Ríos et al. 2010).
The conditions of the Atacama Desert have been maintained for around 150 million years, making it the oldest desert in the world. Most of the microorganisms found in the soils may have been preserved from a time when the climate was wetter or may have been transported from other areas by wind (Fletcher et al. 2012). The information above supports the assumption that will be applied in the method for the specific case of the Antofagasta region, which considers a percentage of organic matter lower than 2 %.
In Chile, the main generating sources of tailings have been copper and gold mining, and to a lesser extent, iron and zinc mining. The survey identifies 43 tailings deposits in the Antofagasta region (SERNAGEOMIN 2017). Information is available on 30 of these deposits, with a total of 49 records of the samples, which were obtained from tailings ponds (39), walls (3), sediments downslope from the deposit (2), filtered tailings (2), paste tailings and samples of pulp from flotation plant (3).
The data utilized corresponds to the geochemical characterization of tailing deposits carried out by SERNAGEOMIN. The present work focuses on the elements considered critical for the environment, presenting the analysis carried out to the following elements of environmental relevance related to mining activity: Cu, Cr, Ni, Zn, Pb, As, Cd and Hg.
Figure 1 presents the distribution of tailings in the Antofagasta region, showing the size of the tailings and the presence of human settlements. The purpose of figure 1 is to give an overview of the local distribution of the tailing deposits and their positions relative to populated zones. Also, figure 1 shows the location of the tailings deposits in the region, indicating their size. However, their status should be considered, since in the case of active deposits (15), they will continue to increase in volume and weight, unlike those abandoned (2) or inactive (32).
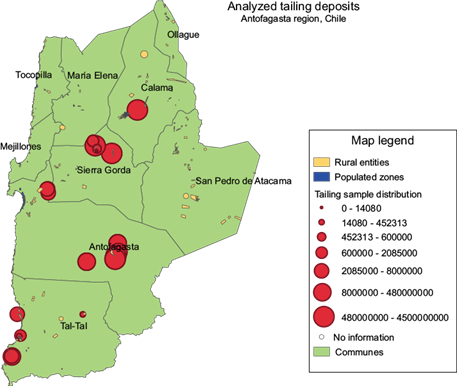
In this work, the following three phases are proposed as a methodology for the evaluation of tailings deposits: (1) tailings identification and prioritization, (2) tailings intervention ranking and (3) preliminary assessment of the environmental risk of sites containing tailings. The proposed methodology will allow complying with the first phase. The following two phases require an analysis and evaluation of more information; among them, it is important to highlight the size of the tailings and the presence of the human settlements that surround them.
Figure 1 shows that the presence of the largest deposits is found in Antofagasta, Calama, Sierra Gorda, and Taltal. The one observed in Calama corresponds to the Talabre deposit, currently with more than 1600 tons of tailings. As an example, consider the Talabre deposit in figure 1 in the municipality of Calama. This deposit is located near several settlements, which must be considered in phase 2 and 3 of the risk assessment of the tailings.
Therefore, after performing the analysis with the proposed methodology, in order to perform an environmental risk assessment, it is imperative to consider these two factors (tailings size and relative position with regard to human settlements), which are not directly included in the definition of the adjusted threshold factor proposed by the methodology. However, these data are of crucial importance for the subsequent analysis of the tailings that have been cataloged with intervention requirements, which will need an evaluation of environmental risks.
It is also important to consider the state of the tailings (active, abandoned or inactive), since if the deposit is active when evaluating the results of intervention requirements, it represents a potential risk because the size of the deposit continues to increase over time. In the case of inactive and abandoned tailings, the risk persists; however, an increase in the deposit is not expected. In the case of abandoned tailings, funds of the Chilean state will be required for its treatment and control.
In Figure 2, the diagram shows the distribution of tailings surveyed in the region of Antofagasta, distributed in its five communes; its purpose is to give an overview of the different kind of tailings and the extracted resources associated with each one. The type of deposit, the state of the tailings and the resource are indicated in the diagram.
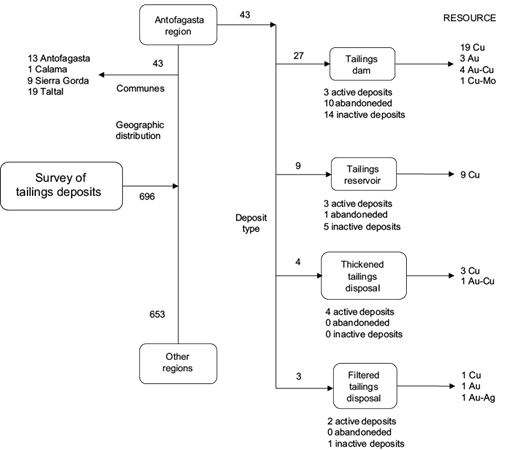
The diagram in figure 2 shows 43 tailing deposits in the Antofagasta region, which are then classified by the type of deposit, with the following distribution: tailing dams (27), tailing reservoirs (9), thickened tailings disposal (4) and filtered tailings disposal (3). The extracted resources are Cu, Au, Au-Cu, Cu-Mo and Au-Ag. For all kind of deposits, Cu is the most common extracted resource. It is important to note that out of the 43 deposits, 11 are in a state of abandonment.
The information given in figure 2 is usable in later phases to carry out a preliminary investigation regarding the environmental risk that these tailings represent. The preliminary investigation begins with the compilation of the existing antecedents and the collection of additional information on the tailings, with the purpose of minimizing the required field efforts and guiding the tailings assessment process, using at the same time the least amount of resources.
Figure 3 shows the amount of tailings deposits found in the Antofagasta region, distributed by commune, the type of sampling that was carried out and the number of samples taken for each kind of tailing. It also indicates the elements and compounds considered in the geochemical characterization, in which it is observed that only 0.94 % of the material by weight could pose a potential risk for the ecosystems and for human health.
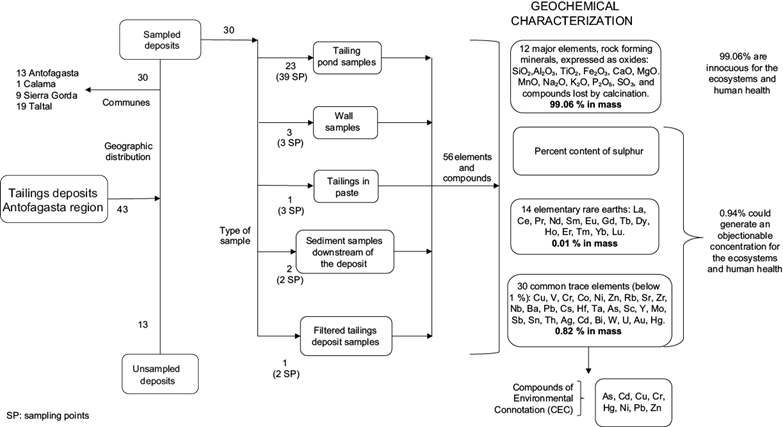
Fig. 3 Protocol for the treatment of the tailings deposits geochemical data in the Antofagasta region
The same figure presents the EECs for the mining activity in Chile that are the object of this study. These elements represent only 0.82 % in mass of the tailings. Figure 3 also provides relevant information at the moment of selecting removal, recovery or control technologies for the tailings that require intervention.
Table I shows the concentration ranges for the eight EECs found in the tailings deposits analyzed. The information provided in table I is important in order to understand the magnitude of the concentration ranges that are present in the tailing deposits of the Antofagasta region. It can be observed that the highest concentrations correspond to As and Cu, while Hg shows the lowest concentrations.
TABLE I BASIC STATISTICS OF THE CONCENTRATIONS OF Cu, Cr, Ni, Zn, Pb, As, Cd AND Hg IN THE 30 TAILINGS DEPOSITS ASSESSED
| Element | Concentration in mg/kg | ||
| Max | Min | Average | |
| Cu | 45 394 | 96 | 3683.653 |
| Cr | 677 | 19 | 132.833 |
| Ni | 146 | 13 | 71.025 |
| Zn | 30 199 | 38 | 6009.408 |
| Pb | 12 287 | 20 | 2592.755 |
| As | 11 821.42 | 49.84 | 5222.761 |
| Cd | 21.66 | 1 | 8.0198 |
| Hg | 5.83 | 0.01 | 0.756 |
The objective of table I is to provide additional information on the characteristics of the tailings studied, in order to show the high level of heterogeneity among them. This can be observed through the large differences between the maximum and minimum values, which effectively show that there is a large chemical variability between tailings deposits.
APPLICATION OF THE METHODOLOGY
The first regulations for estimating the degree of soil contamination were created in the Netherlands (Boekhold 2008). This legislation provides procedures and standards for the short-term sanitation of contaminated soils. This law established limits depending on several factors: the nature and concentration of the contaminants and the conditions of the place where the contaminants are found (e.g., soil characteristics).
This work is based on the 2013 update of the Dutch Soil Regulation (MIWM 2013) standard to analyze the particular situation of the tailings in the Antofagasta region. The Dutch legislation (MIWM 2013) has been used because it provides a mathematical formula that allows adapting its intervention values according to the nature of each soil.
The methodology applied allows defining areas of foreseeable risks for people and/or the environment, classified into three criteria: (1) requires intervention, (2) requires conditional intervention, and (3) does not require intervention. Intervention requirements are associated with the potential existence of contamination that would affect the human population and/or the environment, so some form of sanitation or control measure would be required to reduce the risks. These measures should be able to stabilize to the metals in question.
Metals and metalloids are subject to changes in chemical speciation under certain physical-chemical conditions, such as changes in pH, redox potential, substrate composition or others. The aim is to minimize the mobility of metals developing remediation strategies. In the particular case of chemical stabilization as a remediation strategy, different materials have been tested, which contain functional groups that have the capacity to absorb, adsorb and/or retain metals.
Dutch regulation and graphical methods
In order to evaluate the soil quality, standard values must be converted to values applicable to the characteristics of the soil that is being evaluated. This is done by considering the measurements of organic matter and clay. The converted values are then compared with the concentrations measured in the soil. The soil intervention value (SIV) is defined as:
where the following terms are defined:
SSIV corresponds to the standard soils intervention value, which is defined for each element of environmental concern assuming a soil with 10 % of organic matter and 25 % clay. Table II presents the SSIV values for each one of the EECs.
TABLE II EQUATION PARAMETERS* FOR THE CALCULATION OF SOIL INTERVENTION VALUES FOR EACH ELEMENT
| Element | a | b | c | SSIV |
| Arsenic | 15 | 0.4 | 0.4 | 76 |
| Cadmium | 0.4 | 0.007 | 0.021 | 13 |
| Mercury | 0.2 | 0.0034 | 0.0017 | 4 |
| Lead | 50 | 1 | 1 | 530 |
| Nickel | 10 | 1 | 0 | 100 |
| Zinc | 50 | 3 | 1.5 | 720 |
| Copper | 15 | 0.6 | 0.6 | 190 |
| Chromium | 50 | 2 | 0 | 78 |
*Defined by the Dutch soil regulation circular (MIWM 2013) (see equation 1)
SSIV: standard soil intervention value
Constants A, B and C correspond to parameters based on the characteristics of each element. Table I presents the values of these constants for each element.
The variable x A corresponds to the percentage of clay in the substrate that is being evaluated, expressed as a number between 0 and 100. In case that the clay content is less than a 2 %, the value 2 is assigned to x A (that is, the lowest value it can take is 2 %).
The variable x M corresponds to the percentage of organic matter in the substrate that is being evaluated, expressed as a number between 0 and 100. In case that the content of organic matter is less than 2 %, the value 2 is assigned to x M (that is, the lowest value that it can take is 2 %).
Bearing in mind all previous observations, in this work a referential table of the intervention values has been built. These values are presented in table III. SIVs have been calculated using the method provided by the Dutch guidelines (MIWM 2013) under the assumption that the organic matter percentage in a tailing is negligible (≤2 %). If the concentration in mg/kg exceeds the values indicated in this table for the composition of a given soil, then the tailings deposit must be intervened.
TABLE III SOIL INTERVENTION VALUES FOR EACH ELEMENT ACCORDING TO CLAY PERCENTAGE, ASSUMING ORGANIC MATTER IS < 2 %
| Porcentage of clay | Element | |||||||
| As | Cd | Hg | Pb | Ni | Zn | Cu | Cr | |
| SIV (mg/kg) | ||||||||
| 2 | 43.50 | 7.55 | 2.78 | 336.71 | 34.29 | 303.43 | 91.83 | 42.12 |
| 5 | 46.65 | 7.90 | 2.92 | 355.41 | 42.86 | 349.71 | 101.33 | 46.80 |
| 10 | 51.89 | 8.48 | 3.14 | 386.59 | 57.14 | 426.86 | 117.17 | 54.60 |
| 15 | 57.13 | 9.06 | 3.37 | 417.76 | 71.43 | 504.00 | 133.00 | 62.40 |
| 20 | 62.37 | 9.64 | 3.59 | 448.94 | 85.71 | 581.14 | 148.83 | 70.20 |
| 25 | 67.61 | 10.22 | 3.82 | 480.12 | 100.00 | 658.29 | 164.67 | 78.00 |
| 30 | 72.86 | 10.80 | 4.05 | 511.29 | 114.29 | 735.43 | 180.50 | 85.80 |
| 35 | 78.10 | 11.38 | 4.27 | 542.47 | 128.57 | 812.57 | 196.33 | 93.60 |
| 40 | 83.34 | 11.96 | 4.50 | 573.65 | 142.86 | 889.71 | 212.17 | 101.40 |
| 45 | 88.58 | 12.54 | 4.72 | 604.82 | 157.14 | 966.86 | 228.00 | 109.20 |
| 50 | 93.82 | 13.12 | 4.95 | 636.00 | 171.43 | 1044.00 | 243.83 | 117.00 |
| 55 | 99.06 | 13.70 | 5.17 | 667.18 | 185.71 | 1121.14 | 259.67 | 124.80 |
| 60 | 104.30 | 14.28 | 5.40 | 698.35 | 200.00 | 1198.29 | 275.50 | 132.60 |
| 65 | 109.54 | 14.85 | 5.62 | 729.53 | 214.29 | 1275.43 | 291.33 | 140.40 |
| 70 | 114.79 | 15.43 | 5.85 | 760.71 | 228.57 | 1352.57 | 307.17 | 148.20 |
| 75 | 120.03 | 16.01 | 6.07 | 791.88 | 242.86 | 1429.71 | 323.00 | 156.00 |
| 80 | 125.27 | 16.59 | 6.30 | 823.06 | 257.14 | 1506.86 | 338.83 | 163.80 |
| 85 | 130.51 | 17.17 | 6.52 | 854.24 | 271.43 | 1584.00 | 354.67 | 171.60 |
| 90 | 135.75 | 17.75 | 6.75 | 885.41 | 285.71 | 1661.14 | 370.50 | 179.40 |
| 95 | 140.99 | 18.33 | 6.97 | 916.59 | 300.00 | 1738.29 | 386.33 | 187.20 |
| 100 | 146.23 | 18.91 | 7.19 | 947.77 | 314.29 | 1815.44 | 402.16 | 195 |
In the case that the clay percentage in the soil is not found in table III, a linear interpolation can be used to obtain the result. This will produce the correct result (because the base calculation model is linear). In case that the clay percentage is less than 2 %, it must be assumed that it takes the value of 2 % (in accordance with the Dutch guidelines [MIWM 2013]), so it must not be extrapolated.
The results of table II are graphically represented for each element in figure 4. The clay percentage is on the abscissa axis and the concentration of the corresponding element in mg/kg is on the ordinate axis. These graphs show the straight line determined with the formula of intervention value for tailings (intervention threshold), calculated in the same way as in table II. Two zones can be observed in the graph: the zone above the intervention threshold that indicates the necessity of intervention and the zone below that represents the safe zone that does not require immediate intervention.
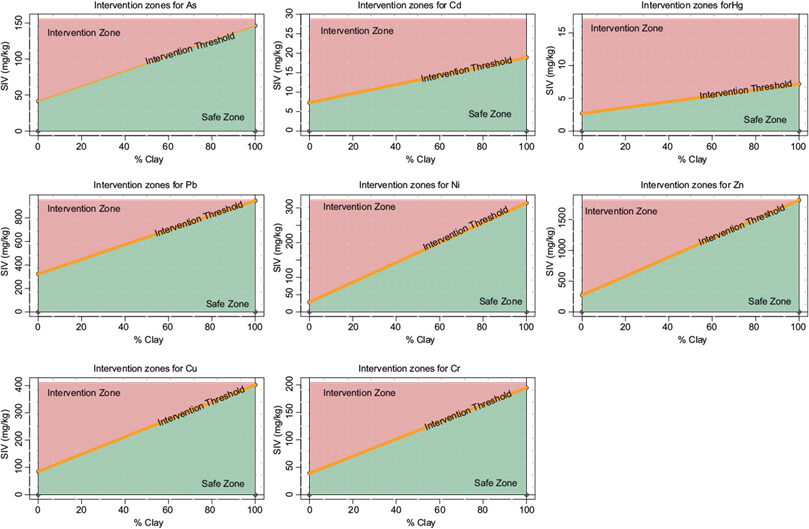
To use these graphs, it is necessary to have data about the percentage of clay and the concentration of the element of interest. By using this information, the sample must be located in the corresponding graph to see in which zone it lies. However, as the direct application of this method requires knowing the clay percentage; it is not possible to apply it directly to the data provided by the available database of SERNAGEOMIN.
If a sample falls within the red zone of figure 4, then it means that it is necessary to intervene the corresponding soil. Likewise, if the sample falls in the green zone of figure 4, it would not be necessary to plan an intervention at the moment. If the sample falls directly on the intervention threshold, it could be argued that doing something to mitigate the environmental impact would be better than assuming the tailing does not require an intervention. Note that as the percentage of clay increases, the intervention threshold rises. Thus, for higher values of clay percentage, a higher concentration of the metal would be needed to require an intervention in the tailing.
Threshold factor
With the purpose of addressing the limitation of the evaluation method shown above, this work defines the concept of threshold factor (C F ), corresponding to the minimum percentage of clay acceptable in function of the concentration of the element measured according to the parameters of the Dutch standard (MIWM 2013). If the real percentage of clay in the soil exceeds this value, then intervention of the soil will not be required. In case the clay percentage is lower than the threshold factor then the soil will require intervention.
The threshold factor is obtained setting x M = 2 (because it is assumed that the organic matter content is negligible) and solving the SIV equation for x A . From this procedure, the following equation is obtained:
Note that although this formula can deliver values lower than 0 or higher than 100, these have no sense physically. However, according to the chemical characteristics of the tailings, which are typically very heterogeneous, intervention values (SIVs) lower than the minimum and greater than the maximum might be generated in relation to the area defined between 2 and 100 % of clay.
The minimum SIV values projected to the zone (2 ≤ x A ≤ 100) will always be located in the safety zone, regardless of the percentage of clay. On the other hand, the SIV maximum values projected to the zone (2 ≤ x A ≤100) will always be in the intervention zone, regardless of the composition.
In fact, these values are utilized as limits to determine if the tailings deposit does not require intervention or if the intervention is strictly necessary, regardless of the real percentage of clay in the soil. It must be taken into account that in a preliminary analysis of the tailings the information on the percentage of clay is not available and, in this context, the C F facilitates the analysis of the tailings deposits by the following considerations:
If C F ≤ 0 then the tailings deposit does not require intervention, regardless of the soil composition.
If C F ≥ 100 then the tailings deposit requires intervention, regardless of the soil composition.
If 0 < C F < 100 then the tailings deposit may or may not require intervention, depending on soil composition. In this case it is necessary to obtain an additional characterization of the soil, specifically, to determine the clay percentage (x A ) by sampling the soil. Once the real value is obtained, there are two possible cases:
If x A ≤ C F the soil must be intervened because it exceeds or equals the intervention value specified for this type of soil. If x A > C F it is not necessary to intervene the soil because it is under the intervention value specified for this type of soil.
Bearing this in mind, it is recommended that samples are obtained to evaluate the clay percentage of the soils in the tailings deposits that have a threshold factor between 0 and 100.
Considering the heterogeneity of tailings, the threshold factor in its original definition brings about problems of scale by graphically representing its distribution. It is therefore necessary to define a non-dimensional scale to create analysis scenarios that allow the evaluation of a wide variety of tailings. In order to simplify the graphical analysis of the results, the adjusted threshold factor (AC F ) is proposed. This minimizes the problems of scale and facilitates interpretation.
It should be noted that this is similar to a logarithmic scale, but admits negative values. The evaluation by means of AC F is carried out as follows:
If AC F ≤ 0 then it is not necessary to intervene (it corresponds to the cases where C F ≤ 0). If AC F ≥ 2 then it is necessary to intervene (it corresponds to the cases where C F ≥ 100). It must be noted that AC F = 2.004 when C F = 100, but for practical purposes the difference is negligible, and the analysis is much simpler in this way. If 0 < AC F ≤ 1 it corresponds to the cases in which the unadjusted threshold factor is between 0 and 10 approximately. In this case the need of intervention is unlikely, however it is considered as a conditional intervention. If 1 < AC F < 2 it corresponds to the cases in which the unadjusted threshold factor is between 10 and 100 approximately. In this case the need of intervention is already more likely, and it is considered as a conditional intervention.
ANALYSIS OF RESULTS
The ecological vulnerability of soils has been evident for decades. However, to date, Chile has no regulations to promote their protection, nor does it have the technological tools that would allow effective protection of the soils against anthropogenic contamination. The legal gaps together with the inadequate management of this resource have brought about the appearance of potentially contaminated soils. This has been a clear limitation to the recovery of polluted soils, and it is imperative to have standardized contamination criteria to assess whether a system requires intervention or not.
The methodology applied in this work considers three factors as significantly influential variables in the evaluation of the need of intervention in areas affected by mining activities: (1) the concentration of metals, (2) the percentage of clays (texture) and (3) the percentage of organic matter. These factors influence the SIV value, corresponding to the concentration of the metal analyzed, from which the safety and intervention zones are defined.
The effect of the evaluated elements’ concentration must consider that the data of the chemical analysis correspond to the metal’s total concentration. However, the bioavailability of an element is a function of the chemical and physical form in which it is found in the environment. It should also be taken into account that the soil acts, in general, as a protective barrier of the hydrological and biological environment; do not consider the bioavailability of metals through processes such as filtration, decomposition, neutralization or storage of contaminants. In this context, it is important to analyze the characteristics of the substrate in which the potentially contaminating elements are found. The mobility of a metal depends not only on its speciation, but also on some characteristics of the soil such as pH, organic matter, concentration of carbonates, and clay minerals, among others (Brümmer 1986).
Regarding the texture, clayey soils retain more metals by adsorption or in the exchange complex of the clay minerals; on the contrary, sandy soils lack this fixing capacity. In particular, each clay mineral is characterized by a specific surface area value and a degree of electrical decompensation, which influence its ability to adsorb or exchange metals.
On the other hand, organic matter reacts with metals forming exchange complexes or chelates. Adsorption may be so strong that they remain stabilized or form chelates that are also very stable. However, in many cases organometallic complexes are formed that facilitate metal solubility, availability and dispersal, considering that they might be degraded by soil organisms (Huertos and Romero-Baena 2008). In the case of tailings originating from metallic mining in the Antofagasta region, these are predominantly alkaline, due to the content of carbonates and other elements that induce alkalization and lack organic matter or have a very low content of it. Previous studies of tailings located in the study area report high concentrations of heavy metals in a substrate characterized as saline-sodic and clayey, with a pH of 8.39 (± 0.08), electrical conductivity of 23.6 (± 3.5) mS/cm and an organic matter content of 0.06 %; all these average values were obtained from sampling in the top 30 cm of substrate (Lam et al. 2016).
The methodology applied to the assessment of tailings in the Antofagasta region is a useful tool, in a context that considers saving monetary resources. It allows prioritizing intervention requirements and management of the tailings must be based on the characterization of the study area and the evaluation of potential risks to the environment and human health.
The results obtained from the different elements studied are presented and discussed. The samples have been identified following the identification number of the tailings deposit and its origin, which can the tailings pond or the wall. Concentration values reported as lower than a number n (in mg/kg) were assigned the value n mg/kg to obtain an estimate corresponding to the worst case. Subsequently, the same scheme is applied when data have that format. Specifically, the state of each tailing is analyzed based on the criterion defined by the threshold factor, which is summarized in the following lines:
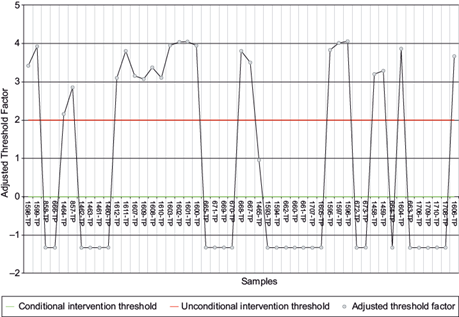
AC F ≥ 2: Unconditional intervention (above the red line in figure 5 to figure 12).
In figure 5 to figure 12, the samples have been identified following the identification number of the tailing deposit and its origin (e.g., from the tailings pond or the wall). All the samples are represented by a point in the graph, and its intervention requirements depend on the previous criteria. For example, in figure 5, sample TP-1595 is above the unconditional intervention threshold. Sample 1606-S falls between the two lines and is a conditional intervention. Sample 1598-TP falls below the green line and thus, it does not require an intervention.
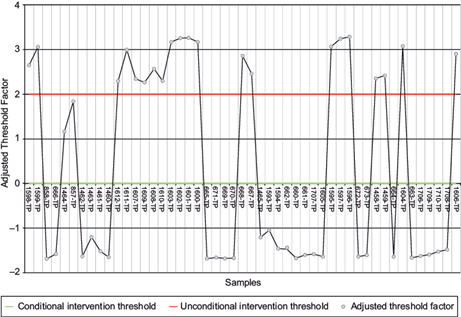
Arsenic
The threshold factors obtained for each sample are shown in figure 5. The results obtained for each sample available in the SERNAGEOMIN data are summarized in table IV. The concentration values reported as lower than 20 mg/kg were assigned the value of 20 mg/kg to obtain an estimate corresponding to the worst case. Subsequently, the same scheme is applied if the data have that format.
TABLE IV SUMMARY OF RESULTS FOR EACH ELEMENT
| Element | Deposit status | (no intervention) | conditional intervention) | (intervention) |
| As | Active | 11 | 0 | 4 |
| Inactive | 14 | 1 | 17 | |
| Abandoned | 0 | 0 | 2 | |
| Cd | Active | 9 | 6 | 0 |
| Inactive | 19 | 12 | 1 | |
| Abandoned | 2 | 0 | 0 | |
| Cu | Active | 0 | 2 | 13 |
| Inactive | 0 | 2 | 30 | |
| Abandoned | 0 | 0 | 2 | |
| Hg | Active | 15 | 0 | 0 |
| Inactive | 31 | 1 | 0 | |
| Abandoned | 2 | 0 | 0 | |
| Pb | Active | 11 | 2 | 2 |
| Inactive | 15 | 0 | 17 | |
| Abandoned | 0 | 0 | 2 | |
| Ni | Active | 4 | 11 | 0 |
| Inactive | 10 | 22 | 0 | |
| Abandoned | 2 | 0 | 0 | |
| Zn | Active | 0 | 9 | 6 |
| Inactive | 0 | 13 | 19 | |
| Abandoned | 0 | 0 | 2 | |
| Cr | Active | 3 | 12 | 0 |
| Inactive | 2 | 26 | 4 | |
| Abandoned | 0 | 2 | 0 |
For arsenic, most active deposits do not require intervention, with only four out of 15 being in the unconditional intervention zone. On the other hand, for the 32 inactive deposits, the majority of the tailings require an unconditional intervention, while only one requires a conditional intervention.
However, since its autocorrelation function (ACF) is slightly less than one, there is a reasonable chance that it does not require an intervention. The remaining 14 inactive deposits do not require any intervention regardless of the clay percentage of the soil. For the two abandoned tailings an unconditional intervention is required in both cases. The fact that active deposits do not require many interventions could be because they are still growing larger and perhaps because of stricter imposed regulations, while older deposits that are either abandoned or inactive could have been created with previous more lenient environmental restrictions.
Considering the total number of deposits, from table IV it can be observed that 51 % of the samples with As available in the SERNAGEOMIN database do not require intervention, while 2 % require a conditional intervention and 47 % an unconditional intervention. The five highest values shown in figure 5 correspond to the following samples:
1596-TP from Sierra Gorda 1 (mass: 14 080 ton).
1601-TP from Caracoles 1-2 (mass: 600 000 ton).
1602-TP from Caracoles 1-2.
1597-TP from Sierra Gorda 1.
1600-TP from Caracoles 1-2.
Note that all these sites are located in the commune of Sierra Gorda.
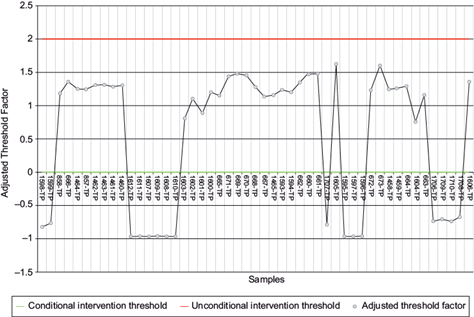
Cadmium
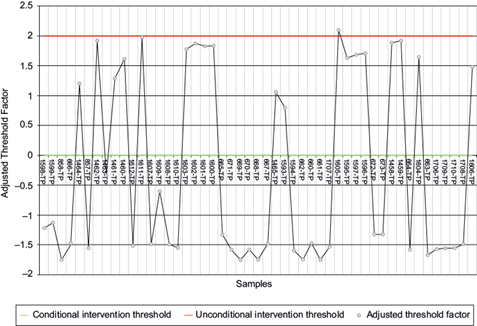
The threshold factors obtained for each sample are shown in figure 6. The results obtained for each sample available in the SERNAGEOMIN data are summarized in table IV.
For cadmium, none of the active deposits require an unconditional intervention and out of the 15 deposits only six are in the zone of conditional intervention. For the inactive deposits, only one of them requires an unconditional intervention, and 12 require a conditional intervention. Most conditional intervention values are on the upper range (i.e., greater than one) and thus there is a considerable chance they actually require an intervention. The remaining 19 inactive deposits do not require any sort of intervention. Finally, the two abandoned deposits do not require an intervention in view of their cadmium levels.
Considering the the total number of deposits, it can be observed in table IV that 61 % of the samples with Cd available in the SERNAGEOMIN database do not require intervention, while 37 % requires a conditional intervention, and 2 % an unconditional intervention. The five highest values shown in figure 6 correspond to the following samples:
1605-TP from Minera Sierra (mass: no information available).
1611-TP from Tranque 3 (mass: 579 000 ton).
1462-TP from Mantos Blanco (mass: 8 000 000 ton).
1459-F from El Peñón (mass: 14 800 000 ton).
1458-F from El Peñón.
Note that the first two sites are located in the commune of Sierra Gorda, while the other three are located in the commune of Antofagasta.
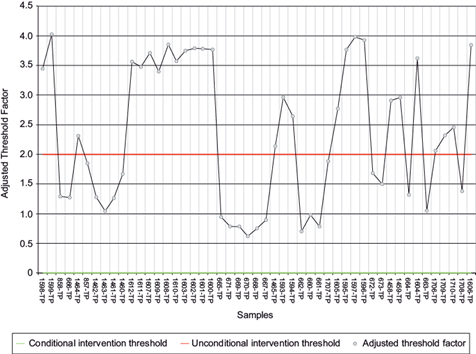
Copper
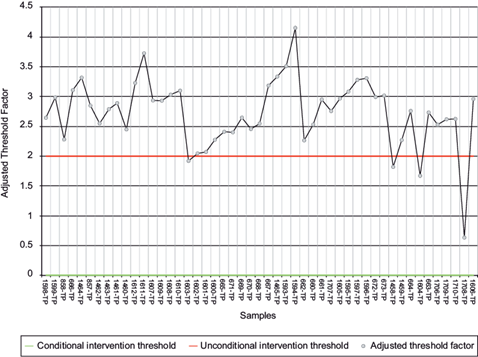
The threshold factors obtained for each sample are shown in figure 7. The results obtained for each sample available in the SERNAGEOMIN data are summarized in table IV.
The analysis of the data reveals the need to intervene the tailing deposits with regard to copper concentration. For this element, all deposits require either an unconditional intervention (practically all of them) or a conditional intervention (only four). This is expected due to the fact that copper mining is the main activity of the region; however, it could still pose a heavy environmental risk, especially in those tailings that are close to population centers.
Considering the total number of deposits, from table IV it can be observed that 0 % of the samples with Cu available in the SERNAGEOMIN database do not require intervention, while 8 % requires a conditional intervention and 92 % an unconditional intervention. It is important to remark that the copper ore law from these tailings is high, thus the intervention could be considered from both the perspectives of remediation or metal valorization, which could be particularly relevant in this case given the importance of copper for the national economy.
The five highest values shown in figure 7 correspond to the following samples:
1594-TP from Doña Ada 1-2-3 (mass: no information available).
1611-TP from Tranque 3 (mass: 579 000 ton).
1593-TP from Doña Ada 1-2-3.
1465-TP from Embalse de Relaves 3A (mass: 15 366 460 ton).
1464-TP from Embalse de Relaves 3A.
Note that the first three sites are located in the commune of Sierra Gorda, while the other two are located in the commune of Antofagasta.
Mercury
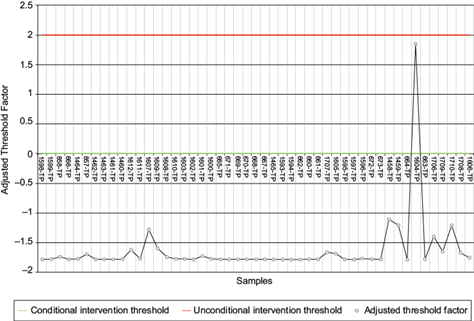
The threshold factors obtained for each sample are shown in figure 8. The results obtained for each sample available in the SERNAGEOMIN data are summarized in table IV.
The particular case of mercury is different from the previous ones, because there are no unconditional interventions required. In fact, there is only one conditional intervention case with AC F ≈ 1.84, which is really close to the threshold of unconditional intervention (so it is probable that it actually requires an intervention). However, given the low AC F values for all the other samples the tailing deposits would not pose environmental problems in the short term.
Considering the total number of deposits, in table IV it can be observed that 98 % of the samples with Hg available in the SERNAGEOMIN database do not require intervention, while only 2 % require a conditional intervention. None of the samples indicate an unconditional intervention requirement.
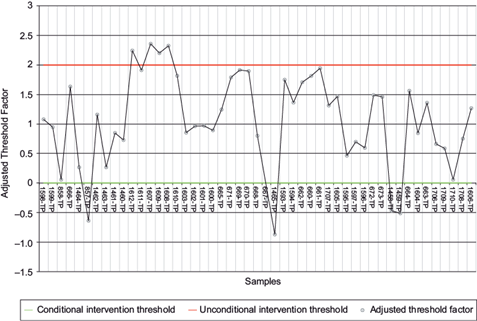
Lead
The threshold factors obtained for each sample are shown in figure 9. The results obtained for each sample available in the SERNAGEOMIN data are summarized in table IV.
Most active deposits of this element do not require intervention, with only two out of 15 being in the unconditional intervention zone and two requiring a conditional intervention. On the other hand, regarding the 32 inactive deposits, the majority of the tailings (17) require an unconditional intervention and the remaining 15 do not require intervention at all. Regarding the two abandoned tailings, an unconditional intervention is required in both cases.
Considering the total number of deposits, in table IV it can be observed that 53 % of the samples with Pb available in the SERNAGEOMIN database do not require intervention, while 4 % require a conditional intervention and 43 % an unconditional intervention. The five highest values shown in figure 9 correspond to the following samples:
1596-TP from Sierra Gorda 1 (mass: 14 080 ton).
1601-TP from Caracoles 1-2 (mass: 600 000 ton).
1602-TP from Caracoles 1-2.
1597-TP from Sierra Gorda 1.
1600-TP from Caracoles 1-2.
Note that in this case all the sites are located in the commune of Sierra Gorda.
Nickel
The threshold factors obtained for each sample are shown in figure 10. The results obtained for each sample available in the SERNAGEOMIN data are summarized in table IV.
As with Hg, none of the extreme values previously observed are present. All of the tailings have been classified as either requiring conditional intervention or no intervention at all. In the cases where a conditional intervention is required, it is necessary to determine the percentage of clay to decide whether they must be intervened or not according to this criterion.
Considering the total number of deposits, in table IV it can be observed that 33 % of the samples with Pb available in the SERNAGEOMIN database do not require intervention, while the other 67 % requires an unconditional intervention. The five highest values shown in figure 10 correspond to the following samples:
1605-TP from Minera Sierra (mass: no information available).
673-TP from Tranque de Relave 2 (mass: 55 725 ton).
661-TP from Punta Morado (mass: 1 682 496 ton).
669-TP from Tranque 1 (mass: 2 085 000 ton).
660-TP from Embalse de Relave (mass: 157 500 ton).
Note that the first tailing sample is located in the commune of Sierra Gorda; however, all the other samples are located in the commune of Taltal.
Zinc
The threshold factors obtained for each sample are shown in figure 11. The results obtained for each sample available in the SERNAGEOMIN data are summarized in table IV.
As in the case of copper, the data analysis reveals the need to intervene the tailing deposits with regard to this element’s concentration. All Zn deposits require intervention either unconditional or conditional. Six of the active deposits require unconditional intervention and nine are in the conditional intervention zone. In the case of inactive deposits, 13 are in the conditional intervention zone and 19 in the unconditional intervention zone. The remaining two abandoned deposits require unconditional intervention.
Considering the total number of deposits, in table IV it can be observed that 0 % of the samples with Zn available in the SERNAGEOMIN database do not require intervention, while 45 % requires a conditional intervention and 55 % an unconditional intervention. The five highest values shown in figure 11 correspond to the following samples:
1599-TP from NN 37 (mass: 600 ton).
1597-TP from Sierra Gorda 1 (mass: 14 080 ton).
1596-TP from Sierra Gorda 1.
1606-S from Minera Sierra (mass: not applicable).
1608-TP from Tranque 2 (mass: 2 025 000 ton).
Note that in this case, all the sites are located in the commune of Sierra Gorda.
Chromium
The threshold factors obtained for each sample of Chromium are shown in figure 12. The results obtained for each sample available in the SERNAGEOMIN data are summarized in table IV.
For this element, most active deposits fall in the conditional intervention zone, with only three do not require intervention. However, none of them requires an unconditional intervention. Regarding inactive deposits, most of them fall in the conditional intervention zone, with only four require an unconditional intervention and two do not require intervention. Finally, for the two abandoned tailings a conditional intervention is required in both cases.
Considering the total number of deposits, in table IV it can be observed that 10 % of the samples with Cr available in the SERNAGEOMIN database do not require intervention, while 82 % requires a conditional intervention and 8 % an unconditional intervention. The five highest values shown in figure 12 correspond to the following samples:
1607-TP from Tranque 1 (mass: 1 875 000 ton).
1608-TP from Tranque 2 (mass: 2 025 000 ton).
1612-TP from Tranque 3 (mass: 579 000 ton).
1609-F from Tranque 2.
661-F from Punta Morado (mass: 1 682 496 ton).
Note that in this case, all the samples but the last one come from tailings located in the commune of Sierra Gorda. The fifth sample in the list comes from a tailing located in the commune of Taltal.
DISCUSSION
Considering the complexity of the system analyzed, classifying a soil as contaminated is not an easy task. It depends on many factors; therefore, on the complete physical and chemical characterization of the evaluated substrate. In the case of aconditional intervention, it is essential to determine the composition of the clays, which controls the mobility and potential toxicity of the associated metals.
The maximum permitted values for uncontaminated soils are considered as pollution thresholds, and they must be contrasted with toxicological studies that show they are not dangerous. On the other hand, in the case of soils that exceed these thresholds, they should not necessarily be considered as contaminated; the toxicity depends on its mobility, therefore in its bioavailability.
In a context of limited resources, the methodology applied has the advantage of defining reference and contamination thresholds. Precise characterization of soils with intermediate values is required considering soil parameters such as texture, organic matter content, carbonates, free iron oxyhydroxides and clay mineralogy. In addition, it is recommended to determine the content of water-soluble metals extractable by EDTA.
Having carried out the analysis for each element, table V shows a summary of the results obtained for each sample of the SERNAGEOMIN data. It should be noted that in general it is necessary to carry out an intervention in every tailing, although the causes can be different in each case. Even if the particular case of copper, which requires intervention in practically all the tailings, is not considered, a conditional intervention is still required in the majority of the cases.
TABLE V SUMMARY OF RESULTS BY SAMPLE FOR EACH ELEMENT
| ID | Cr | Zn | Ni | Pb | Hg | Cu | Cd | As | ID | Cr | Zn | Ni | Pb | Hg | Cu | Cd | As |
| 1598-TP | C | Y | N | Y | N | Y | N | Y | 667-TP | N | C | C | Y | N | Y | N | Y |
| 1599-TP | C | Y | N | Y | N | Y | N | Y | 1465-TP | N | Y | C | N | N | Y | C | C |
| 858-TP | C | C | C | N | N | Y | N | N | 1593-TP | C | Y | C | N | N | Y | C | N |
| 666-TP | C | C | C | N | N | Y | N | N | 1594-TP | C | Y | C | N | N | Y | N | N |
| 1464-TP | C | Y | C | C | N | Y | C | Y | 662-TP | C | C | C | N | N | Y | N | N |
| 857-TP | N | C | C | C | N | Y | N | Y | 660-TP | C | C | C | N | N | Y | N | N |
| 1462-TP | C | C | C | N | N | Y | C | N | 661-TP | C | C | C | N | N | Y | N | N |
| 1463-TP | C | C | C | N | N | Y | N | N | 1707-TP | C | C | N | N | N | Y | N | N |
| 1461-TP | C | C | C | N | N | Y | C | N | 1605-TP | C | Y | C | N | N | Y | Y | N |
| 1460-TP | C | C | C | N | N | Y | C | N | 1595-TP | C | Y | N | Y | N | Y | C | Y |
| 1612-TP | Y | Y | N | Y | N | Y | N | Y | 1597-TP | C | Y | N | Y | N | Y | C | Y |
| 1611-TP | C | Y | N | Y | N | Y | C | Y | 1596-TP | C | Y | N | Y | N | Y | C | Y |
| 1607-TP | Y | Y | N | Y | N | Y | N | Y | 672-TP | C | C | C | N | N | Y | N | N |
| 1609-TP | Y | Y | N | Y | N | Y | N | Y | 673-TP | C | C | C | N | N | Y | N | N |
| 1608-TP | Y | Y | N | Y | N | Y | N | Y | 1458-F | N | Y | C | Y | N | C | C | Y |
| 1610-TP | C | Y | N | Y | N | Y | N | Y | 1459-F | N | Y | C | Y | N | Y | C | Y |
| 1603-TP | C | Y | C | Y | N | C | C | Y | 664-W | C | C | C | N | N | Y | N | N |
| 1602-TP | C | Y | C | Y | N | Y | C | Y | 1604-W | C | Y | C | Y | C | C | C | Y |
| 1601-TP | C | Y | C | Y | N | Y | C | Y | 663-W | C | C | C | N | N | Y | N | N |
| 1600-TP | C | Y | C | Y | N | Y | C | Y | 1706-P | C | Y | N | N | N | Y | N | N |
| 665-TP | C | C | C | N | N | Y | N | N | 1709-P | C | Y | N | N | N | Y | N | N |
| 671-TP | C | C | C | N | N | Y | N | N | 1710-P | C | Y | N | N | N | Y | N | N |
| 669-TP | C | C | C | N | N | Y | N | N | 1708-S | C | C | N | N | N | C | N | N |
| 670-TP | C | C | C | N | N | Y | N | N | 1606-S | C | Y | C | Y | N | Y | C | Y |
| 668-TP | C | C | C | Y | N | Y | N | Y |
N: no intervention, Y: unconditional intervention, C: conditional intervention)
The ID column contains an identifier given by the sample number and the type of sample (TP: tailing pond, W: wall, F: filtered, P: pulp, S: sediment)
The analysis has allowed to identify and prioritize tailings deposits installed in different sites of the Antofagasta region in terms of intervention requirements. As shown in figure 2, tailings can be found in three different states: active, inactive and abandoned. Until a few decades ago, the commercial exploitation of copper was only possible when the mineral had a law over 3.5 %.
However, due to technological development, it is now economically viable to exploit minerals of much lower laws. In particular, some abandoned deposits may have a higher law than active deposits because they were abandoned before the extraction processes allowed for the exploitation of lower laws. This is important to mention, because the intervention of tailings deposits could consider an environmental dimension, related to control and remediation, and an economic dimension, focused on the valorization (i.e., the recovery of elements of commercial interest).
Using the intervention data from table V, a simple measure is devised in order to determine the most critical tailings. For each sample, a zero score is assigned to a sample that does not require intervention, a 0.5 score is assigned to a sample that require a conditional intervention and a score of one for samples that require an unconditional intervention. Thus, for each sample we define the intervention value as the sum of these values for each element. The results from these calculations are shown in table VI, sorted from the highest to the lowest scoring sample.
TABLE VI SUMMARY OF RESULTS BY SAMPLE AND COMMUNE FOR THE INTERVENTION VALUE
| Sample | Score | Tailing | Commune | Sample | Score | Tailing | Commune |
| 1602-TP | 5.5 | Caracoles 1-2 | Sierra Gorda | 857-TP | 3.5 | Talabre | Calama |
| 1601-TP | 5.5 | Caracoles 1-2 | Sierra Gorda | 1594-TP | 3 | Doña Ada 1-2-3 | Sierra Gorda |
| 1600-TP | 5.5 | Caracoles 1-2 | Sierra Gorda | 1462-TP | 3 | Mantos Blanco | Antofagasta |
| 1604-W | 5.5 | Caracoles 1-2 | Sierra Gorda | 1461-TP | 3 | Mantos Blanco | Antofagasta |
| 1606-S | 5.5 | Minera Sierra | Sierra Gorda | 1460-TP | 3 | Sierra Gorda | Sierra Gorda |
| 1459-F | 5 | El Peñon | Antofagasta | 662-TP | 2.5 | Embalse de Relave | Taltal |
| 1464-TP | 5 | Embalse de Relaves 3A | Antofagasta | 660-TP | 2.5 | Embalse de Relave | Taltal |
| 1603-TP | 5 | Caracoles 1-2 | Sierra Gorda | 858-TP | 2.5 | Esperanza | Sierra Gorda |
| 1595-TP | 5 | Sierra Gorda 1 | Sierra Gorda | 1706-P | 2.5 | Laguna Seca | Antofagasta |
| 1597-TP | 5 | Sierra Gorda 1 | Sierra Gorda | 1709-P | 2.5 | Laguna Seca | Antofagasta |
| 1596-TP | 5 | Sierra Gorda 1 | Sierra Gorda | 1710-P | 2.5 | Laguna Seca | Antofagasta |
| 1607-TP | 5 | Tranque 1 | Sierra Gorda | 665-TP | 2.5 | Las Luces 1 | Taltal |
| 1609-TP | 5 | Tranque 2 | Sierra Gorda | 663-W | 2.5 | Las Luces 1 | Taltal |
| 1608-TP | 5 | Tranque 2 | Sierra Gorda | 666-TP | 2.5 | Las Luces 2 | Taltal |
| 1612-TP | 5 | Tranque 3 | Sierra Gorda | 664-W | 2.5 | Las Luces 2 | Taltal |
| 1611-TP | 5 | Tranque 3 | Sierra Gorda | 1463-TP | 2.5 | Mantos Blanco | Antofagasta |
| 1458-F | 4.5 | El Peñon | Antofagasta | 661-TP | 2.5 | Punta Morado | Taltal |
| 1598-TP | 4.5 | NN 37 | Sierra Gorda | 671-TP | 2.5 | Tranque 1 | Taltal |
| 1599-TP | 4.5 | NN 37 | Sierra Gorda | 669-TP | 2.5 | Tranque 1 | Taltal |
| 668-TP | 4.5 | Soledad Ii | Taltal | 670-TP | 2.5 | Tranque 2 | Taltal |
| 1610-TP | 4.5 | Tranque 2 | Sierra Gorda | 672-TP | 2.5 | Tranque De Relave 1 | Taltal |
| 1605-TP | 4 | Minera Sierra | Sierra Gorda | 673-TP | 2.5 | Tranque De Relave 2 | Taltal |
| 667-TP | 4 | Soledad Ii | Taltal | 1707-TP | 2 | Hamburgo | Antofagasta |
| 1593-TP | 3.5 | Doña Ada 1-2-3 | Sierra Gorda | 1708-S | 1.5 | Laguna Seca | Antofagasta |
| 1465-TP | 3.5 | Embalse de Relaves 3A | Antofagasta |
The sample column contains an identifier given by the sample number and type (TP: tailing pond, W: wall, F: filtered, P: pulp, S: sediment)
In figure 13 a summarizing box plot is shown for each commune. Based on these results, the samples from Sierra Gorda suggest a highest necessity of intervention, especially considering the closeness of rural settlements. The tailing deposit Relave Caracoles 1-2 has the highest intervention value (5.5), which implies that practically every metal falls in the unconditional intervention zone in the previous analysis. Another site in this situation is Relave Minera Sierra, also with a score of 5.5. Most of the samples with higher intervention are come from the Sierra Gorda site, thus it is critical to intervene the tailings in this commune.
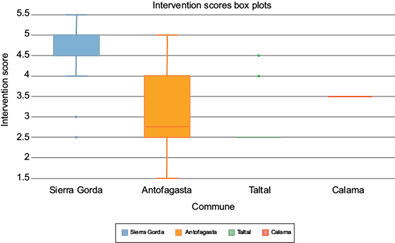
Fig. 13 Intervention scores box plot for the four communes. Error bars represent the interquartile range
In the commune of Antofagasta, intervention values show a high variance, however most deposits seem to be distant from population centers, although special care should be given to tailings of El Peñón (1459-F) and Embalse de Relaves 3A (1464-TP), both of which have intervention values of 5.
In the commune of Taltal, intervention values are not as high, therefore the need for intervention is not as critical although the tailings are close to some human settlements. The highest scoring sample comes from Soledad II (668-TP) with a score of 4.5. However, most the other tailings have values lower than 3.
Only one sample has been analyzed in the commune of Calama, corresponding to the tailing of Talambre (857-TP), with a score of 3.5, which could be considered a moderate environmental risk, especially taking into account its location close to population centers.
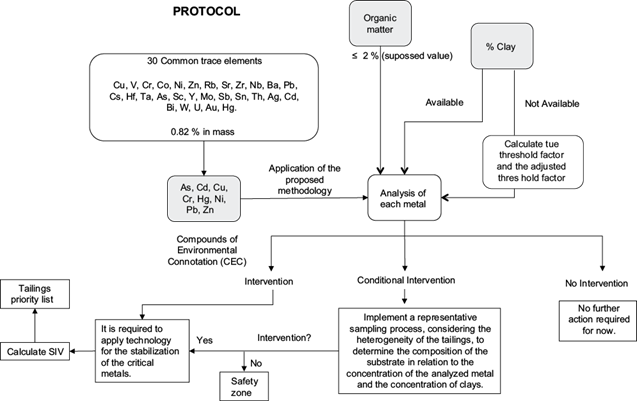
Figure 14 summarizes the functioning of the methodology and its application. Considering the development of the previous case study, it can be said that the methodology has been successfully applied in this first instance of evaluation in the Antofagasta region.
According to the results presented in table VI, based on the score assigned to each of the 49 samples analyzed, it is concluded that the tailings deposits located in the commune of Sierra Gorda are those that mostly require a priority intervention, with a score between 4 and 5.5 out of a maximum of 8, corresponding to 67 % of the deposits classified as in need of priority intervention.
The two largest tailing deposits in Chile, Talabre (commune of Calama, with more than 1600 tons of tailings currently) and Laguna Seca (commune of Antofagasta, with more than 1050 million tons), obtained scores of 3.5 and 2.5, respectively. Therefore, the Talabre dam was classified with an intermediate level of intervention requirement. However, considering that it requires conditional intervention regarding Zn, Ni and Pb, and intervention concerning Cu and As, the dam is categorized as a candidate for priority intervention, given its high tonnage and the presence of Pb and As.
Finally, in the case of the Laguna Seca deposit, which obtained a score between 1.5 and 2.5, a conditional intervention is required for Cr and an intervention for Zn and Cu. It can be concluded that this deposit, despite its large tonnage, does not require a priority intervention.
CONCLUSIONS
This work has studied the need for intervention in tailings deposits in the region of Antofagasta. To accomplish this, the Dutch regulation for soil remediation (MIWM 2013) and the data provided by SERNAGEOMIN have been used.
The analysis of classic intervention values has been adapted to the particular case of the tailings, where organic matter is negligible. Graphs have been provided to directly apply this approach, assuming that the concentration level of the element studied, and the percentage of clay are available. However, as the SERNAGEOMIN data does not include the clay percentage, it was necessary to define another approach for the evaluation of the deposits. In this context, the adjusted threshold factor has been proposed and the data has been analyzed with this new method.
In this work, a simple and practical methodology is applied, which allows developing a prioritized survey of sites affected by tailings. It is expected that the results obtained will be relevant for designing policies, programs and projects that allow executing interventions oriented to strengthening the management of sites with presence of inorganic pollutants, the main source of which are tailings deposits.
The methodology is based on the Dutch Soil Protection Act (MIWM 2013). However, there is evidence for the need of local guidelines and regulations, since these would allow the assessment of risks to the population’s health, considering that, when non-local guidelines or regulations are used, they might be more (or less) restrictive or require more (or less) complex technical solutions.
Currently, Chile has a specific law that regulates the closure of mining operations and facilities. This law requires, when all facilities finish their operations, that a closure plan must be submitted to SERNAGEOMIN. This plan must ensure the physical and chemical stabilization of every facility.
According to their monthly extraction, mining companies have to develop a closure plan that must be submitted to a general application procedure (medium and large-scale mining) or to a simplified application procedure (small-scale mining). Law 20 551 (which regulates mine closures), is certainly a milestone for the mining sector. Its stringent regulations require that companies deliver financial guarantees to ensure the fulfillment of the activities and measures proposed in the closure plan.
In addition to the country’s mining history and lack of rigorous closure processes, gaps in legislation are in part responsible for the great number of mining environmental liabilities, which are scattered and distributed throughout the country. These liabilities, comprised mainly by tailings, pose great risks for the health and safety of people.
Those risks are primarily associated to physical and chemical destabilization caused by the tailings’ exposure to natural phenomena such as seismic events or rains that cause movements of large volumes of tailings, generation of mine acid drainage, dispersion of pollutants to surface and underground waters, contamination of soils and emission of fine particulate matter, among others.
The Chilean state has great challenges to face. Thus, it is necessary to formulate public policies regarding environmental mining liabilities, specifically in relation to their prevention and remediation, which could allow the solution of this problem. It is urgent to generate action-oriented policies as soon as possible, since risks and dangers associated to mining environmental liabilities increase with time, as do people’s exposure to pollution and the uncertainty whether there is a need or not of intervention to deal with the liability.
As it can be seen from this analysis, almost all the records indicate that intervention regarding Hg is not compulsory, inasmuch as only one value was found which requires conditional intervention. Regarding Cu and Zn, 100 % of the measurements indicated these elements were in the intervention or conditional intervention zone, which is consistent with the fact that mines in the study area mainly extract copper and present high concentrations of these two elements.
Finally, the limitations of this method must be addressed, in particular, that the availability of metals in the tailings is not just a function of organic matter content, as is shown by sequential extraction studies that identify the way metals are present in soil. So, in this context, even if metals are found in great quantities in the tailings, it is possible that only a fraction is actually available, which would greatly reduce its environmental impact. While this is a limitation of the current method, it should be noted that given the close location of some of the tailings to human settlements in the Antofagasta region, it could still be environmentally irresponsible not to intervene certain tailings as shown above.

