


 nueva página del texto (beta)
 Inglés (pdf)
 Artículo en XML
 Referencias del artículo
 Enviar artículo por email
 Citado por SciELO
  Similares en
SciELO
Similares en
SciELO 
 Permalink
INTRODUCTION
Thallium (Tl) is a highly toxic post-transitional metal that is more toxic to mammals than any other element or inorganic species, including Hg, Cd, Pb, As, Cu, and Zn (Peter and Viraraghavan 2005). For this reason Tl is considered a priority pollutant by the US-EPA (Keith and Telliard 1979) and other countries, including Mexico, and its quantification is necessary for a precise evaluation of the generalized potential toxicity risk by metals in the environment (Galván-Arzate and Santamaría 1998, Cvjetko et al. 2010). However, its concentration in environmental samples is considerably lower than that of other toxic metals and metalloids, but given its high toxicity it is possible that in many cases these low concentrations are potentially toxic. Despite the fact that maximum permissible Tl levels have been established in water and soils in regulatory agencies of various countries, such as Spain, France, China, and Mexico, these are not consistent and differ in values considerably; or in the case of Mexico, they are not complete because soils are regulated but water is not. In general, the geochemical and environmental toxicity information of this element is sufficiently deficient to not fully justify the particular permissible limits selected.
Non polluted surface waters generally exhibit Tl concentrations below 10 ng/L (Lukaszewski and Piela 1996) and the concentrations of natural Tl in soils range from 0.08 to 1.5 µg/g (Wenqi et al. 1992, von Laar et al. 1994, Tremel et al. 1997); although some sites have been reported with much higher natural Tl concentrations, e.g., of up to 55 µg/g (Morvan North frontier, France [Tremel et al. 1997]).
Soils located in close proximity to Zn and Pb smelters show Tl concentrations that are much higher (Gómez-González et al. 2015, Liu et al. 2016, Cruz-Hernández et al. 2018), and its aqueous mobility is a crucial factor to elucidate its potential toxic effect. This mobility can be determined by sequential extraction procedures employing extracting solutions that may provide information on the geochemical/mineralogical fractions that this metallic ion is associated to (Cruz-Hernández et al. 2018). However, quantification of Tl in the extracts is problematic due to its low concentrations and numerous interfering agents present, and this may explain the relatively few reports that exist on the mobility of Tl in soils. For this, analytical methods with sufficiently low detection limits and relatively controlled interferences are required.
There are electrochemical methods capable of quantifying thallium. For example, differential pulse voltammetry (DPV), also differential pulse polarography (DPP), and differential pulse anodic stripping voltammetry (DPASV). The first is a voltammetry method used to make electrochemical measurements and a derivative of linear sweep voltammetry or staircase voltammetry with a series of regular voltage pulses superimposed on the potential linear sweep or stairsteps (Laborda et al. 2014). The current is measured immediately before each potential change, and the current difference is plotted as a function of potential. This technique has been used to quantify thallium (Wang et al. 2013) but does not offer low enough detection limits as compared with DPASV.
The DPASV when using a hanging mercury drop electrode (HMDE) offers detection limits that are adequate for many metallic ions, including Tl (Batley and Florence 1975, Lukaszewski et al. 1980, Ciszewski et al.1997, Krasnodebska-Ostrega and Stryjewska 2004, Espinosa-Castellón and Alvarado-Gámez 2012). This DPASV technique is a voltammetric method for quantitative determination of specific ionic species. The analyte of interest is electroplated on the working electrode during a deposition step, and oxidized from the electrode during the stripping step. The current is measured during the stripping step. The oxidation of species is registered as a peak in the current signal at the potential at which the species begins to be oxidized. The stripping step can be either linear, staircase, squarewave, or pulse. Recently in the literature the use of other electrodes for thallium determination has been reported, such as bismuth bulk annular band electrode (BiABE) (Wegial et al. 2016) and a hanging galinstan drop electrode (HGDE) (Surmann and Channaa 2015).
The equipment used in this technique is relatively cheaper and is portable with shorter analysis times than other methods with similar detection limits, such as inductively coupled plasma with mass spectrometry (ICP-MS). Additionally, it is oxidation state-selective, as opposed to techniques such as the latter, which measure total Tl (= Tl[I] + Tl[III]).
The main interference in Tl determination by DPASV is lead (II) (Lukaszewski et al. 1992). The voltamperometric peak of Pb(II) (-0.38 V) appears very near the Tl(I) peak (-0.44 V). However, application of a Pb(II) complexing agent, which does not complex Tl(I), such as EDTA (Wegial et al. 2016) reduces this effect because it causes a shift of the Pb(II) peak to more negative potentials (-0.5 to -0.6 V) (Ngila et al. 2005), which allows a thousand-fold Pb(II) tolerance in excess of Tl(I) (Dhaneswar and Zarparkar 1980, Lukaszewski et al. 2003).
However, in the simultaneous presence of Cu(II) and Pb(II) at high concentrations, as is the case in mine and metallurgical-affected environments, because Cu(II) is also complexed with EDTA, the new Cu(II)-EDTA peak, which originally in its free form occurs far from the Tl peak (0.0 V), decreases to more reducing potentials (-0.30 to -0.40 V, at pH 4.6) (Metrohm 1993), and to -0.5 V at pH 7 (Wang et al. 2008), creating thus a new interference for Tl(I) originally not present. Furthermore, the Cu(II)-EDTA affinity constant (Log K = 10.23 at pH 4.6) is larger than that of the Pb(II)-EDTA complex (Log K = 9.46 at pH 4.6) (Wanninen and Ingman 1987), leading to a more favorable formation for Cu(II) than for Pb(II), and thus a high excess of EDTA must be added to ensure all Pb(II) is bound.
In the voltamperometric methods literature, other working electrodes are reported that are usually very expensive in comparison to the mercury electrode, which simultaneously determine Tl, Pb and Cu, such as NiCo2O4 porous nanoplates (Dong and Zhang 2017) and the bismuth-film electrode (BiFE) (Carvalho et al. 2007). However, no specific details are reported about the behavior of the interferences with these electrodes when both ions are present simultaneously, as for example, what are the maximum Pb(II)/Tl(I) y Cu(II)/Tl(I) ratios allowed for accurate Tl(I) determinations, and what the detection limits are under these conditions. The DPASV method to eliminate the Pb(II) interference by using EDTA has been pre-optimized, as mentioned above (Metrohm 1993), but further optimization is required to reliably quantify Tl(I) in the presence of both Pb(II) and Cu(II) ions, while producing stable and reproducible Tl signals, low detection limits, and minimization of the interferent action of these ions. Therefore, the goal of the present work was to study the effects (and perform a fine-tuning optimization) of the following conditions in the previously reported DPASV method using an HMDE: (i) the deposition potential, (ii) the deposition time, (iii) the scan rate, and (iv) the pulse amplitude, to maximize Tl quantification in the presence of the two interfering cations Pb(II) and Cu(II). This will be highly useful for quantification work of thallium in environments contaminated with multiple metals, and will be demonstrated with an application example in real Tl-contaminated soils.
MATERIALS AND METHODS
Equipment
The voltamperometric determination of Tl(I) in the presence of Pb(II) and Cu(II) was performed with a trace metal analyzer (797VA Computrace, Metrohm AGLtd, Switzerland), which consists of a working hanging mercury drop electrode (HMDE) (Metrohm, Switzerland), an auxiliary platinum (Pt) electrode, and a Ag/AgCl/KCl (3 mol/L) reference electrode (Korolczuk 1999).The measuring electrochemical cell is a glass container of 80 mm of diameter and of height, of 20.1 mL capacity, which is covered by a teflon cap containing holes through which the corresponding electrodes are introduced, and for nitrogen gas bubbling.
Reagents
MILLI-Q water was used for all solutions prepared, with an electrical conductivity below 18.2 MΩ.cm.
A pH buffer solution of 4.6 was used by mixing 2 mol/L CH3COOH and 1 mol/L NH4OH (both from Fluka &Poch, of 99 % purity).
An aqueous solution of 0.201 mol/L EDTA was prepared, at its solubility limit from its di-sodium salt (J.T. Baker, 100.3 % purity). In order to prepare Tl(I), Pb(II), and Cu(II) standards at different concentrations, standard stock solutions were used of 10 000 mg/L for Tl(I) and of 1 000 mg/L for the other two, all from Fluka.
The reagents used for investigating the complexing effect on Cu were KCl (J.T. Baker, 99.0-100.5 %), KNO3 (J.T. Baker, 99 %), K2SO4 (J.T. Baker, 99 %) and 0.1 M NaOH (MACRON, 98 %).
Procedure
The analysis technique implemented in this work was optimized from that described in the procedures manual of Metrohm, referenced as AB074 (Metrohm 1993) (adapted from Dhaneswar and Zarparkar 1980) to determine Tl(I) by DPASV using a HMDE. The general procedure is described as follows: 10 mL of sample and 10 mL of the 0.201 M EDTA solution were added to the electrochemical cell, both using volumetric PYREX pipets, as well as 0.1 mL of acetate/ammonium buffer (pH 4.6) to ensure a peak of maximum current for thallium (Batley and Florence 1975, Mahesar et al. 2010). Dissolved oxygen was removed from this solution by bubbling nitrogen gas for 5 min just prior to the voltammetric measurement. The Tl(I) concentration used for most optimization tests was 10 µg/L.
The influence of the following parameters on the response of the reduction current intensity for the electrodeposition of thallium on the HMDE was studied: deposition potential, deposition time, scan rate, and pulse amplitude, by starting from initial values as proposed by the AB074 Metrohm procedure (Dhaneswar and Zarparkar [1980], Lukaszewski et al. [2003]) (deposition potential = -0.700 V, deposition time = 60 s, scan rate = 20 mV/s, pulse amplitude = 0.050 V). This was done in the presence of 2, 10, 20 and 25 mg/L Pb(II), and/or 2, 4 and 5mg/L Cu(II). The voltamperograms were registered between -0.9 and 0.4 V in the differential pulse mode. Tl(I) was quantified by plotting a calibration curve of current intensity vs. concentration in an interval from 2 to 20 µg/L. The following validation parameters were determined: detection limit, quantification limit, sensitivity, coefficient of variation and percentage of recovery according to the method of Taylor (1987), for which eight independent replicates were made.
Mobile thallium in real samples
Sieved soil (0.5 g) was stirred for 16 h with 20 ml 0.11 M acetic acid (J.T. Baker, ULTREX, Ultrapure Reagent) at room temperature and pH 2.85 to determine the most mobile Tl fraction from soils, tailings and soil contaminated with mining waste, after the completely soluble fraction, taking into account the sequential extraction method proposed by the European Bureau of Reference (BCR), modified and described by Vaněk et al. (2010a, b). The thallium fraction extracted here constitutes the carbonate bound, proton-exchangeable, and partially bound Tl to poorly-crystalline Mn oxides (Vaněk et al. 2010a). After an equilibration time of 2 h, the samples were centrifuged for 10 min at 5000 rpm with a centrifuge (PrO-Research from Centurion Scientific Ltd), then filtered using Amicon ultrafilters (Amicon Ultra-15 10K, Millipore, MA) porous cellulose membranes with a pore size of 0.05 μm. Extraction was done in triplicate.
RESULTS AND DISCUSSION
Influence of the presence of Pb(II) and Cu(II) in the determination of Tl(I), in the absence of EDTA
Pb(II) shows an electrochemical reduction peak (-0.38 V) that is found very close to that of Tl(I) (-0.44 V), therefore they interfere with each other, as illustrated in figure 1a for a concentration one thousand times higher in Pb(II). Because the peaks of both species almost superimpose, the method labels the peak at -0.38 V as “unknown”, and the Tl(I) peak appears as a shoulder at -0.44 V. In the case of Cu(II) its reduction potential is found far from that of Tl(I) towards more oxidizing potentials (0.0 V) (Fig. 1b), which allows the determination of high Cu(II) concentrations without interfering with the Tl(I) quantification.
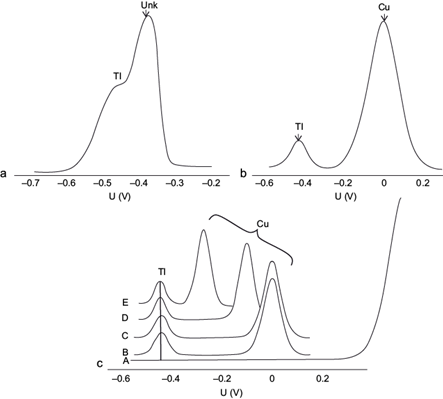
Fig. 1 (a) Influence of the presence of 10 mg/L Pb(II), (b) of 500 µg/L Cu(II) (b) (without electrolytes), and (C) of various electrolytes, in the differential pulse anodic stripping voltammetry (DPASV) potential (U) signal of 10 µg/L Tl(I) in the absence of ethylenediaminetetraacetic acid (EDTA) at pH 4.6 (A: Blank of 10 mL 1 M KNO3 and 3.3 × 10⁻³ M K2SO4; B: 1 M KNO3; C: 3.3 × 10⁻³ M K2SO4 (pH = 4); and D: 0.6 M KCl; E: 1 M KCl). Deposition potential -0.700 V, deposition time 60 s, scan rate 20 mV/s, pulse amplitude 0.050 V
The effect of different supporting electrolyte anions was investigated on the complexing effects and thus on the reduction potential of Cu(II), using KCl, KNO3 and K2SO4. The pH of the system was set at 4.6 with 0.1 M NaOH to ensure that the Tl(I) peak current reached its maximum value, and to make the results comparable to those in the presence of the acetate buffer used further along. The results are shown in the voltamperogram sequence in figure 1c.
The Tl(I) (10 µg/L) reduction peak in the presence of Cu(II) (500 µg/L) was not altered with 1 M KNO3 as electrolyte since the Cu-nitrate complex is very weak (Fig. 1c [B]). The same was observed with sulfate (Fig. 1c [C]) (here the K2SO4 concentration used was 3.3 × 10⁻³ M at pH = 4 in order to simulate the sulfate concentration in a typical mining environment with acid mine drainage (Harris et al. 2003]).
When using KCl, the CuCl4 -2 complex formation is highly favored (Log K = 5.6) (Ritchie 2004).The characteristic reduction potential on a Hg electrode according to thermodynamic calculations is E0 = -0.05 V (equation 1). The Cu(II) voltamperometric signal is progressively shifted to more negative potentials as chloride concentration is increased, to -0.120 V with 0.6 M KCl (Fig. 1c [D]), and up to -0.270 V with 1 M KCl (Fig. 1c [E]).
According to the calculation of the equilibrium potential (Eeq) shown in equation 2, its dependence on the chloride concentration is evident, producing a larger shift in the Cu(II) signal as the concentration of this anion is increased, even if electrochemical equilibrium is not reached.
In contrast, the presence of chloride affects very little both the Tl(I) and Pb(II) signals, because the corresponding formation constants for their predominant complexes are much smaller (TlCl [aq] Log K = 0.51, PbCl2 [aq] Log K = 2.20, MINEQL [Schecher and McAvoy 1992]). If the sample does not contain chloride, it is preferable to use the acetate buffer to attain the Cu(II) peaks with no altered potential (0.00-0.05 V), minimizing its interfering potential with the Tl(I) determination.
Influence of Pb(II) and Cu(II) in the determination of Tl(I), in the presence of EDTA
EDTA is a hexadentate and tetravalent anionic ligand that provides a chelating effect that favors the formation of a Pb(II)-EDTA soluble complex (Chulsung 1996),which may even act on solid Pb(II) compounds. Given the EDTA (Y4-) protonation constants, at the working pH of 4.6 the predominant species is biprotonated (H2Y2-), as shown in equation 3 for its complexation with Pb2+ (Log K = 9.46 [Wanninen and Ingman 1987]).
The Pb(II)-EDTA2- complex shows a reduction potential in the interval -0.5 to -0.6 V vs. the Ag/AgCl reference electrode (Ngila et al. 2005), which is considerably more negative than that of Tl(I), which in turn does not form EDTA complexes, so it maintains its peak at the same potential (-0.44 V), effectively removing the interference of Pb(II) illustrated in the previous section (Fig. 2a).
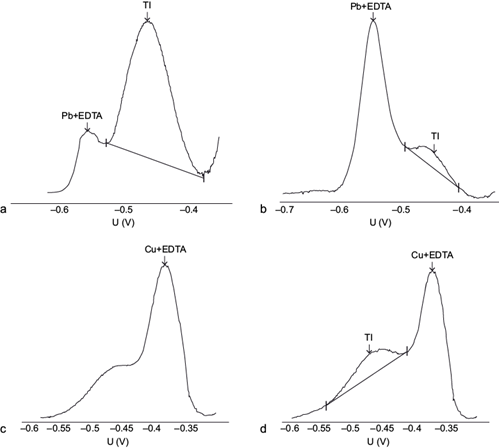
Fig. 2 Influence of the Pb(II) concentration: (a) 10 mg/L, (b) 20 mg/L, and Cu(II): (c) 5 mg/L, (d) 2 mg/L, in the differential pulse anodic stripping voltammetry (DPASV) potential (U) signal of 10 µg/L Tl(I) in the presence of 0.1 M ethylenediaminetetraacetic acid (EDTA). Intensity signal scales are arbitrary and vary among graphs. pH = 4.6. Deposition potential -0.700 V, deposition time 60 s, scan rate 20 mV/s, pulse amplitude 0.050 V
In the same manner as the shift in the Cu(II) signal in the presence of chloride was described (equation 2), the specific concentration of EDTA added to the solution affects the shift in the Pb(II) signal, and to achieve the highest possible shift, a large EDTA concentration (0.1 M) is preferred. However, despite the large shift expected, a very large excess of Pb(II) will eventually cause the large Pb(II)-EDTA signal tail to invade the Tl(I) signal, preventing their adequate separation (Fig. 2b).
Unfortunately, the presence of Cu(II) ions, which also complex with EDTA (Log K = 10.23 [Wanninen and Ingman 1987]), interfere in the Tl(I) determination because the analytical Cu(II)-EDTA signal shifts to negative potentials and approaches the Tl(I) signal (Fig. 2c). This interference does not occur for sufficiently small Cu(II) concentrations (Fig. 2d).
Influence of the scan rate on the separation of Tl(I) y Pb(II) signals
In order to separate as much as possible the Tl(I) signal from those of Pb(II) and Cu(II), the scan rate was varied keeping constant the amplitude pulse at 0.050 V (Dhaneswar and Zarparkar 1980, Metrohm 1993, Lukaszewski et al. 2003). A lower amplitude produced too much noise, and higher amplitudes generated higher current intensities (Fig. 3d), but also loss of resolution and increase in the current load, therefore the value of 0.050 V originally proposed in the Metrohm method was deemed the adequate amplitude (Bond 1980).
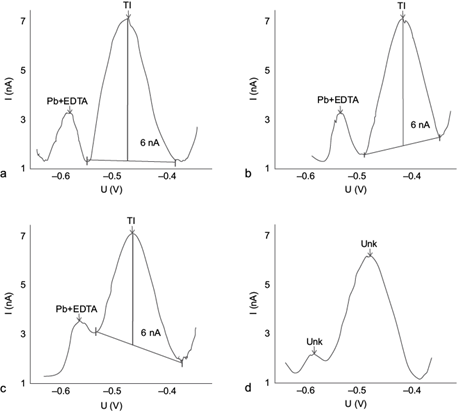
Fig. 3 Effect of the scan rate on the separation of differential pulse anodic stripping voltammetry (DPASV) potential (U) signals of Pb(II) + EDTA and Tl(I), 10 µg/L Tl(I) + 10 mg/L Pb(II) at 0.05 V pulse amplitude: (a) v = 5 mV/s, (b) v = 10 mV/s, (c) v = 20 mV/s, (d) v = 20 mV/s (0.07 V pulse amplitude). Deposition potential -0.700 V, deposition time 60 s, pulse amplitude 0.050 V in all, except 0.07 V in d
In Figure 3 the voltamperograms obtained at three different scan rates are shown: at 5 mV/s (Fig. 3a) the Pb(II)-EDTA signal separates well (reaching background values before the Tl[I] signal appears) but an asymmetric widening occurs and the Tl(I) signal noise increases. At 10 mV/s (Fig. 3b), the signals separate even better with narrower peaks and the noise decreases; while at 20 mV/s (Fig. 3c) the signals do not separate as well. At this latter speed but increasing the pulse amplitude above 0.07 V (Fig. 3d) , the signals widen further, making them unidentifiable by the program. Therefore, the optimal speed chosen was 10 mV/s, i.e., half of that recommended by the standard method (Dhaneswar and Zarparkar 1980, Metrohm 1993, Lukaszewski et al. 2003).
Influence of deposition time and potential on the Tl(I) signal in the presence of Pb(II) and Cu(II)
One of the instrumental parameters that may increase the sensitivity of a voltamperometric method is the deposition time. Under normal conditions, the magnitude of the electrochemical signal tends to be directly proportional to this time. In general, the recommended deposition times should be no longer than the minima required to obtain well defined and easily measurable peaks, in order to maintain short analysis times.
Deposition times from 15 to 60 s at a deposition potential of -0.700 V (Metrohm 1993) (adapted from Dhaneswar and Zarparkar 1980) were investigated (Fig. 4). This study revealed that peak signal for each metal increased linearly from 15 to 30 s of deposition, reaching a maximum current in the Tl(I) peak of 3.24 nA at 30 s. While at 15 s deposition the Pb(II)-EDTA signal is zero, and the largest difference in signals is obtained, where the Tl(I) signal is relatively the largest, unfortunately, the Tl(I) signal appears very noisy at this low deposition time, so we chose a 30 s deposition time as the optimum, given also that a maximum Tl(I) peak is attained. With times above 30 s peak current values increased for Cu(II)-EDTA above those of Tl(I), and the same occurred for the Pb(II)-EDTA peak current above ca. 45 s. Above 30 s, also the absolute value of the Tl(I) peak decreased, possibly from metal saturation on the surface of the electrode (Inam et al. 1999). Therefore, 30 s was selected as the optimal deposition time to minimize simultaneous Cu(II)-EDTA and Pb(II)-EDTA interferences. The values of the peak currents were taken at the corresponding reduction potentials for each system, i.e., -0.44, -0.55, and -0.30 to -0.35 V, for Tl(I), Pb(II)-EDTA, and Cu(II)-EDTA, respectively.
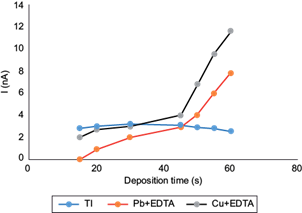
Fig. 4 Effect of deposition time of differential pulse anodic stripping voltammetry (DPASV) potential (U) signals for Tl(I) on the peak current amplitudes of 10 µg/L Tl(I) + 20 mg/L Pb(II) + 3 mg/L Cu(II) and 0.1 M ethylenediaminetetraacetic acid (EDTA), pH 4.6. Deposition potential -0.700 V, scan rate 10 mV/s, pulse amplitude 0.050 V
Deposition potential values were evaluated between -0.700 and -0.500 V, with a deposition time of 30 s. Between -0.700 and -0.600 V adequate signals were obtained for the three species: Tl(I) (i=3.24 nA), Pb(II)+EDTA and Cu(II)+EDTA (Fig. 5a). However, upon increasing slightly the potential to -0.550 V, the signals arising from Pb(II)-EDTA and Cu(II)-EDTA were decreased, especially the first one, relative to the Tl(I) signal (Fig. 5b). Increasing further the signal to -0.500 V decreased the peak current of Tl(I) to 2.60 nA (Fig. 5c). Therefore, the optimal potential was considered to be -0.550 V.
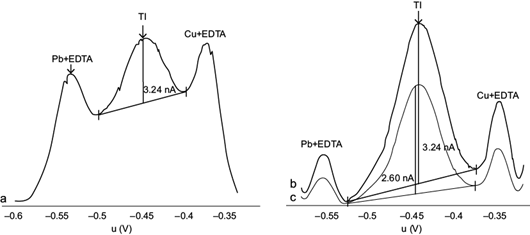
Fig. 5 Effect of deposition potential on the peak current of differential pulse anodic stripping voltammetry (DPASV) potential (U) signals for Tl(I), for 10 µg/L Tl(I) + 10 mg/L Pb(II) + 2 mg/L Cu(II) and 0.1 M ethylenediaminetetraacetic acid (EDTA), (a) from -0.700 to -0.600 V, (b) -0.550 V and (c) -0.500 V. Deposition time 30 s, scan rate 10 mV/s, pulse amplitude 0.050 V. Intensity scales are arbitrary
Performance of the optimized method
Once the optimized parameters were chosen, we investigated the maximum concentrations of Pb(II) and Cu(II) that allow quantification of Tl(I) by DPASV without losing resolution (Fig. 6). For this purpose, the Tl(I) concentration of 10 µg/L that generates a peak current of 3.24 nA was used as reference. A Pb(II) concentration of 2 mg/L + EDTA did not produce a noticeable signal (Fig. 6a), whereas the same concentration of Cu(II) did produce a signal of similar amplitude as that of Tl(I). Pb(II) detection was attained at a concentration closer to 10 mg/L (Fig. 6b), obviously progressively increasing as its concentration was raised (Fig. 6b-d). For a concentration of 25 mg/L Pb(II) and 5 mg/L Cu(II), the Tl(I) peak current was decreased by 10 % (Fig. 6d), and based upon common practice in routine analysis we decided to consider a 10 % variation as the maximum acceptable decrease in peak amplitude. Therefore, these two metals were defined as interferents of the Tl(I) signal under the optimized DPASV method conditions at a Pb(II) concentration 2 000 times higher, and a Cu(II) concentration 400 times higher than that of Tl(I), with the chosen EDTA concentration of 0.1 M.
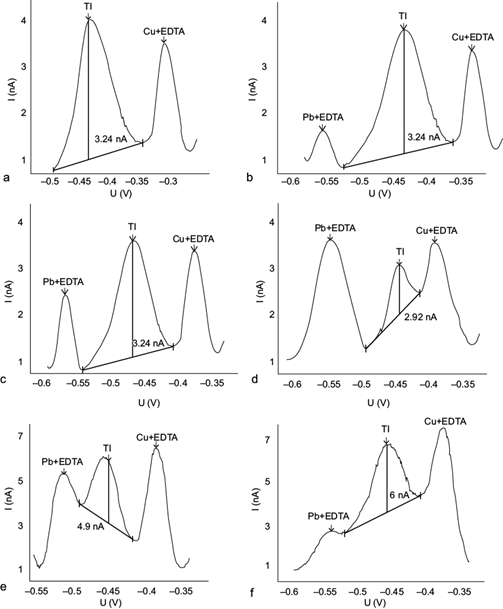
Fig. 6 Influence of the Pb(II) and Cu(II) concentrations on the10 µg/L Tl(I) differential pulse anodic stripping voltammetry (DPASV) potential (U) signal in the presence of 0.1 M ethylenediaminetetraacetic acid (EDTA), with a deposition time of 30 s, deposition potential of -0.550 V, scan rate of 10 mV/s and a pulse amplitude of 0.050 V. (a) 2 mg/L Pb(II) + 2 mg/L Cu(II), (b) 10 mg/L Pb(II) + 3 mg/L Cu(II), (c) 20 mg/L Pb(II) + 4 mg/L Cu(II), (d) 25 mg/L Pb(II) + 5 mg/L Cu(II), (e) 20 mg/L Pb(II) + 4 mg/L Cu(II) scan rate of 20 mV/s, and (f) 10 mg/L Pb(II) + 1 mg/L Cu(II). Deposition time 60 s, deposition potential of -0.700 V, scan rate of 20 mV/s and a pulse amplitude of 0.050 V
Figure 6e shows the corresponding voltamperogram obtained for the optimized method but keeping the scan rate of the original method at 20 mV/s. It is clear that the Tl(I) signal does not separate optimally from those of Pb(II) and Cu(II) (i.e., they do not reach background levels between them), as occurs at a scan rate of 10 mV/s.
In the standard AB074 Metrohm (Metrohm 1993) method (Dhaneswar and Zarparkar 1980, Lukaszewski et al. 2003), these limiting concentrations are 1000 and 100 times higher, respectively. Figure 6f shows the corresponding voltamperogram obtained with this method, which clearly additionally shows a much lower peak resolution especially between the Pb(II) and the Tl(I) signals, as compared to the optimized parameters (Fig. 6c, d), and vary among graphs.
PERFORMANCE OF THE OPTIMIZED METHOD IN THE PRESENCE OF Pb(II) AND Cu(II)
Detection limit, quantification limit and sensitivity
The standard curve for Tl(I) is shown in figure 7a for the concentration range of 2.3 to 20 µg/L with the optimized method. The corresponding linear equation obtained was: peak current (nA) = 0.2334 × (Tl[I]) (µg/L) + 0.9016, and the correlation coefficient r2 was 0.999. The detection and quantification limits (DL and QL) were 2 and 7 µg/L, respectively, and were determined as the Tl(I) concentration that provides a signal equal to three and 10 times the standard deviation (noise) of the blank (0.157 nA), respectively through the criterion of IUPAC (1995) from the mathematical relation: DL = 3*S/m and QL = 10*S/m where S is the standard deviation for 10 blank and is the sensitivity that corresponds to the constant of proportionality between the signal and the concentration.
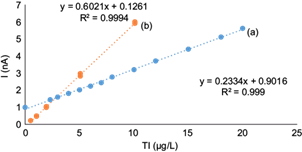
Fig. 7 Standard Tl(I) curve determined by differential pulse anodic stripping voltammetry (DAPSV) in the presence of 0.1 M ethylenediaminetetraacetic acid (EDTA): (a) in the optimized conditions of 2000 times higher Pb(II) concentrations, and 400 times higher Cu(II) concentrations (deposition potential of -0.550 V, deposition time 30 s, scan rate 10 mV/s, pulse amplitude 0.050 V9; and (b) in the conditions of the original AB074 method (Metrohm 1993) (adapted from Dhaneswar and Zarparkar 1980) for 1000 times higher Pb(II) concentrations and 100 times higher Cu(II) concentrations (deposition potential -0.700 V, deposition time 60 s, scan rate 20 mV/s, pulse amplitude 0.050 V)
The Tl(I) standard curve for the conditions of the original method (AB074 from Metrohm [Dhaneswar and Zarparkar 1980, Lukaszewski et al. 2003]) is shown in figure 7b for 1000 times higher Pb(II) and 100 times higher Cu(II). It is clearly a more sensitive curve with a higher slope (0.602), which decreases the Tl(I) DL and QL ca. 10 times.
However, the sacrifice in detection limit shown by the optimized method allows an increase in Pb(II)/Tl(I) and Cu(II)/Tl(I) of twice and four times the latter, respectively. The decrease in sensitivity of the optimized method is basically due to a decrease in the scanning speed to half the value of the standard method. This decrease is necessary to allow a better separation among the three signals (Fig. 6a-c), and therefore to increase the concentration limits of both interferents. If a lower detection of Tl(I) was desired, the scanning rate could be increased to the original value of 20 mV/s, but the analyst should be aware that the signal separation would be sacrificed in this case (Fig. 6e).
Accuracy and precision
The accuracy of the method is verified by the analysis of a certified reference material, or by comparing the results with those obtained by another reliable method on the same sample. If none of these procedures is possible, the recovery tests are used to provide evidence on the validity of the results. In this work the method of addition/recovery was used to assess the accuracy calculating the percentage of recovery (% R) using equation 4:
Where CF is the concentration of analyte measured in the fortified sample, CU is the concentration of analyte measured in the sample without fortification, and CA is the concentration of the analyte added.
Precision is the level of agreement between the results obtained when we apply the same analytical method several times to the same sample. The lower the degree of agreement, the lower the precision, and this is indicative of the method’s random errors, which cause the result to deviate from the mean value. In contrast, the greater the degree of agreement between the results, the greater the precision of the analytical method, indicating that the method does not present random errors or that these errors are acceptable.
The precision is calculated either as the absolute standard deviation (S), or as the coefficient of variation (CV), which is the percentage of S with respect to the average (Ẋ).
Table I shows the results of the analysis of the accuracy and precision of the method under study. The mean recovery achieved (100.8 %) indicates that the proposed method shows the accuracy required to be considered appropriate for thallium determinations (the additional calculated 0.8 % is due to experimental error). On the other hand, the repeatability of the Tl concentration values in the analyses, with low values of coefficients of variation, indicate that the method is precise.
TABLE I RESULTS OF THE ANALYSIS OF ACCURACY AND PRECISION OF THE METHOD BEING STUDIED*
| Sample | Initial concentration of the sample | Concentration of the added pattern | Percentage of recovery (%) | Coefficient of variation (CV; %) | ||||
| Tl (µg/L) | Pb (mg/L) | Cu (mg/L) | Tl (µg/L) | Pb (mg/L) | Cu (mg/L) | |||
| 1 | 10 | 20 | 4 | 0.5 | 1 | 0.2 | 104 | 0.9 |
| 2 | 10 | 20 | 4 | 2.5 | 5 | 1 | 99 | 2.62 |
| 3 | 10 | 20 | 4 | 9 | 18 | 3.6 | 99.4 | 1.31 |
Global recovery (%) = 100.8; global CV (%) = 1.69
*The values expressed are the average of eight independent measurements
REAL SAMPLE ANALYSIS
To further evaluate the feasibility and practicality of the optimized method nine real samples of soils contaminated by metallurgical waste were selected from the San Luis Potosí Mining District in the state of San Luis Potosí (SLP), Mexico (22º 9’ 23.292’’ N; 100º 59’ 7.947’’ W) (Santana-Silva 2016, Ruiz-García 2017, Cruz-Hernández et al. 2018), and processed through an extraction procedure (cf. the Materials and Methods section), because concentrations from total digestions surpass the Pb(II) and Cu(II) limits reported in the present work for the Tl(I) determination. The mineralogical composition of the samples is highly variable. There are major components of most of the primary mineral samples such as quartz, feldspar and plagioclase and minor secondary iron oxide minerals such as hematite and goethite in samples SLP01, SLP02 and SLP08. In samples SLP03, SLP04 and SLP07 the presence of mica and secondary minerals (neoformed or not) such as gypsum, jarosite and kaolinite as minor components is noteworthy (Cruz-Hernández et al. 2018). These samples exhibit high contents of arsenic, lead, copper, manganese and total iron. The manganese present correlates strongly with the total Tl content suggesting a strong association between these two metals (Cruz-Hernández et al. 2018).
The experimental results are shown in figure 8 by taking sample SLP06 as an example. This sample was selected because it shows the highest contents of total thallium, lead and copper of all samples investigated, according to analyses performed by Ruiz-García (2017).
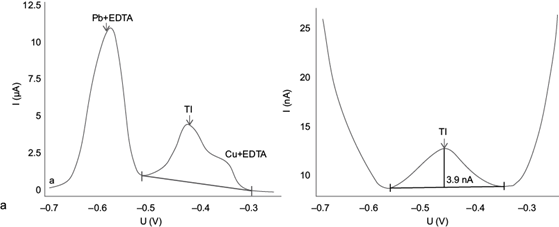
Fig. 8 Voltamperograms obtained for the real sample SLP06 after extracting with acetic acid according to the BCR sequential extraction method, using (a) the original AB074 Metrohm method (adapted from Dhaneswar and Zarparkar 1980); and (b) the optimized method from this work
Figure 8a shows the inability of the original method for adequately separating the peaks of Tl(I), Pb(II) + EDTA and Cu(II) + EDTA. This is mainly because the concentrations of Pb(II) and Cu(II) extracted in the sample exceed the limits allowed by the original AB074 Metrohm method (adapted from Dhaneswar and Zarparkar 1980). When applying the optimized method (Fig. 8b) the clear definition of the thallium peak, separated from the Pb(II) and Cu(II) peaks, becomes evident. Therefore, quantification of thallium using the optimized method developed here is feasible and highly reliable for samples with these characteristics. Table II shows the thallium concentrations in mg/kg obtained in each of the samples by DPASV.
TABLE II RESULTS FOR THE DETERMINATION OF Tl(I) IN REAL SAMPLES FROM EXTRACTIONS USING ACETIC ACID ACCORDING TO THE EUROPEAN BUREAU OF REFERENCE (BCR) SEQUENTIAL EXTRACTION METHOD
| Samples | Concentration determined by DPASV (mg/kg) mean ± standard deviation (n = 3) |
| SLP01 | 0.065 ± 0.0006 |
| SLP02 | 0.28 ± 0.015 |
| SLP03 | 0.05 ± 0.05 |
| SLP 04 | 0.18 ± 0.2 |
| SLP 05 | 0.05 ± 0.06 |
| SLP 06 | 1.18 ± 0.04 |
| SLP 07 | 0.22 ± 0.005 |
| SLP 08 | 0.89 ± 0.21 |
| SLP09 | 3.2 ± 0.07 |
DPASV: differential pulse anodic stripping voltammetry
These results suggest the need to study the geochemical behavior and thallium speciation in this Mexican zone and extend the study to other areas of the country, on account of the extreme toxicity of this elememt. The results also show that the optimized method proposed has potential practical applications for the determination of Tl(I) in the presence of Pb and Cu in real soil samples.
CONCLUSIONS
Differential pulse anodic stripping voltammetry is a robust technique to quantify Tl(I) at low concentrations, similar to those commonly encountered in soils and sediments. But it can also be used for samples with high Tl(I) contents, provided the maximum molar ratios of Pb(II)/Tl(I) of 2000 and Cu(II)/Tl(I) of 400 found in the present work for the optimized method, are not surpassed. This method improved from the suggested standard method (Dhaneswar and Zarparkar 1980, Metrohm 1993, Lukaszewski et al. 2003), in which the maxima are Pb(II)/Tl(I) of 1000 and Cu(II)/Tl(I) of 100. The parameters varied as follows: deposition time was decreased from 60 to 30 s, deposition potential was increased from -0.700 to -0.550 V, scan rate was halved from 20 to 10 mV/s, and the pulse amplitude was kept at 0.050 V. With these adjustments, the Tl(I) detection and quantification limits were sacrificed from 0.18 and 0.6 µg/L, to 2 and 7 µg/L, respectively. The study of the validation parameters concludes that the optimized method is validated.

