


 nueva página del texto (beta)
 Inglés (pdf)
 Artículo en XML
 Referencias del artículo
 Enviar artículo por email
 Citado por SciELO
  Similares en
SciELO
Similares en
SciELO 
 Permalink
INTRODUCTION
Yearly, about eight million liters of mezcal and 271 million liters of tequila are produced in Mexico, from which almost 3400 million liters of vinasses remain as residue after the distillation step (Robles-González et al. 2012, García-Depraect and León-Becerril 2018). These wastes are very aggressive to the environment due to the high organic matter content, high discharging temperature and low pH. If untreated vinasses are discharged into soils or water, the ecosystem could be seriously affected causing eutrophication in water bodies and contamination in soils and crops (Robles-González et al. 2012). Mezcal and tequila are Mexican alcoholic beverages generated after the distillation of broths produced from the fermentation of sugars contained in extracted agave juice. Both beverages are produced in different regions of Mexico and each one possesses a distinctive sensory character (Villanueva-Rodríguez and Escalona-Buendía 2012).
Several methods for vinasses treatment have been researched and used in the recent years (Robles-González et al. 2012). One of the most suited method is the anaerobic digestion (AD) for biogas or hydrogen production (Jiménez et al. 2006, Espinoza-Escalante et al. 2007, López-López et al. 2010, Méndez-Acosta et al. 2010, Barrera et al. 2014). AD has found practical applications in industrialized countries through biogas plants for the production of heat and electricity, for the production of biomethane as biofuel, or as network supply. Nevertheless, the efficiency of the biogas production depends on the operational parameters of the bioreactor and the substrate characteristics such as pH, alkalinity, temperature, organic matter content, or toxic compounds (Espinoza-Escalante et al. 2009).
Through the vinasses AD, monosaccharides such as fructose and glucose are produced. These compounds contribute to the efficient biogas generation and the increase of methane content in biogas (Espinoza-Escalante et al. 2007). For this reason, vinasses are a very suitable substrate for the production of bioenergy. The centralized production of high amounts of vinasses in nearby locations make this substrate a suitable alternative for saving in transportation costs and for a cost-effective energy production. López-López et al. (2010) suggested that AD is a very competitive method regarding technical and economic advantages over aerobic processes.
The adaptation process of the inoculum microbial population to the substrate is a very important step to enhance the capacity of the inoculum to degrade higher amounts of substrate, increasing the methane production (Calabró et al. 2018). Different authors report different methods of microbial adaptation. Calabró et al. (2018) compared the methane production of olive oil mill wastewater (OMW) AD, when using adapted and non-adapted inoculum. Inoculum adaptation was done during 30 days batch tests digesting OMW. Methane production increased by 300 % in the tests with adapted inoculum. Méndez-Acosta et al. (2010) performed the efficient adaptation of anaerobic sludge under continuous operation of a bioreactor operated with vinasses. The bioreactor was started with a low organic loading rate (OLR) and high hydraulic retention time (HRT), thus the microbial consortium was stressed as less as possible. As a result, the adaptation granted the good microbial interaction by the continuous operation of the bioreactor. Eskicioglu et al. (2009) investigated the effect of the adaptation of the biogas production of microwave pretreated activated sludge. Inoculum adaptation did not only accelerate the biogas production, but also enhanced the biodegradation rate of the sludge. Rivera et al. (2002) achieved a successfully 20-day adaptation of a bioreactor digesting sludge, diluted manure and vinasses. The first two days no feeding took place, the next 10 days a daily feeding was carried out and the rest of the adaptation period, feedings were done every two days. After 20 days, the biogas production showed stable values (600 mL/d), and from this point a continuous operation of the reactor was done. Biofilms were used in order to enhance the adaptation process. Méndez-Acosta et al. (2010) achieved the sucessfully adaptation of a 5-liter bioreactor digesting sludge with vinasses. Methane content, biogas production and removal of chemical oxygen demand (COD), achieved stable values after the 50-days adaptation period.
In this work, a 30-day adaptation period of an 8-liter bioreactor operated with mezcal vinasses and activated sludge was carried out under anaerobic conditions. Biogas production was daily measured and characterized. The objective of this work was to start the adaptation process of a bioreactor in order to stress the microbial population as less as possible, and therefore achieve high biogas and methane yields, as well COD removal rate. At the beginning of the adaptation period the OLR was low, and the HRT was high. The OLR increased slowly in order to stress the microbial consortium as less as possible.
MATERIAL AND METHODS
Bioreactor configuration
The bioreactor was made of polyvinyl chloride (PVC), 19 cm high, 36 cm long and 12 cm wide, with a volumetric capacity of 8.2 L and was 90 % filled with vinasses (7.4 L total of sludge and vinasses mixture). For pH adjustment, the bioreactor had an inlet at the top for the addition of sodium hydroxide (NaOH) (Espinoza-Escalante et al. 2007, Espinoza-Escalante et al. 2009, Méndez-Acosta et al. 2010). Also at the top a tedlar bag was connected for biogas storage. The reactor had a twist-off lid at the top and a tap at the bottom to replace every seven days 30 % of the total volume with new substrate. HRT was 24 days and OLR started at 5.22 gCOD/Ld, increasing slowly up to 8.50 gCOD/Ld after the adaptation period. A magnetic stirrer was placed inside the bioreactor so that it could be mixed 15 min/d.
Inoculum and substrate
Activated sludge from the wastewater treatment plant of the Autonomous University of Queretaro was used as inoculum. As substrate, mezcal vinasses were collected from the mezcal factory Laguna Seca located in the Mexican state San Luis Potosi. Vinasses and sludge were collected, transported and kept at 4 ºC prior to use. The characteristics of the vinasses and activated sludge are listed in table I and table II.
TABLE I CHARACTERISTICS OF MEZCAL VINASSES
| Parameter | Value |
| pH @ 27 ºC | 4.77 |
| Chemical oxygen demand COD (g/L) | 59 |
| Sulfate ion (g/L) | 1.04 |
| Phosphate ion (g/L) | 0.3 |
| Nitrate ion (g/L) | 0.48 |
| Total nitrogen (g/L) | 0.126 |
| Total phosphorous (g/L) | 0.017 |
| Sediment solids (mL/L, @ 60 min) | 102 |
| Turbidity NTU (Nephelometric Turbidity Units) | 55.4 |
| Total sugar content (g/L) | 51 |
| Total solids TS (%) | 4.9 |
| Total solids (g/L) | 49.17 |
| Volatile solids (%) | 3.5 |
| Volatile solids (g/L) | 14.58 |
Bioreactor start-up
The reactor adaptation consisted of filling 90 % of the total reactor volume with mezcal vinasses as substrate and activated sludge as inoculum, at a vinasses concentration of 42 % v/v. Four feeding steps were carried out by replacing 30 % of the total volume with new vinasses every seven days, which means by day 7, 14, 21 and 28. The amount of produced biogas and the content of methane, carbon dioxide and hydrogen sulfide were daily measured. Before every measurement was carried out, the bioreactor was mixed with a magnetic stirrer for 15 min, according to the norm VDI 4630 (VDI 2016) for the fermentation of organic materials for biogas production. The reactor was kept in a furnace at anaerobic conditions and mesophilic temperature (39 ºC). The pH value of the reactor was daily measured and adjusted with NaOH. A second bioreactor under the same conditions was run out as control test digesting only inoculum. The biogas production was subtracted to the assay with substrate, in order to determine the real biogas and methane production of the vinasses.
Measurements
The biogas quality (content of methane, carbon dioxide and hydrogen sulfide) was measured with a gas analyzer Multitec 540 from the German company Sewerin GmbH. The pH value was daily measured with the pH-meter 110 from VWR and calibrated with buffer solutions prior to use. Biogas was collected in tedlar bags and the quantity was measured according to the water displacement principle with an Erlenmeyer flask and a graduated cylinder. Biogas and methane were reported in terms of L/kgVSvinasses. Biogas was calculated dividing the liters of biogas produced in one day by the kilograms of vinasses added at each feeding in terms of volatile solids. The methane volume was calculated by multiplying the gas volume by the methane content. COD was measured according to the norm DIN 38414-9:1986-09 (DIN 1986). COD removal (%) was calculated comparing the values measured at the beginning and at the end of the experiments. Sulfate ion (SO4 2-), phosphate ion (PO4 3-), nitrate ion (NO3 -), total nitrogen (TN) and total phosphorous (TP) were measured with Hach vials. Total solids (TS) and volatile solids (VS) were measured according to the norm VDI 4630 (VDI 2016). FOS/TAC value, the quotient of the volatile organic acids and the total inorganic carbonate, was measured to analzye the biochemical state of the fermentation sludge. FOS stands for Flüchtigen Organischen Säuren in German and TAC stands for Total Alkalischen Carbonaten (Voß et al. 2009, VDI 2016). FOS indicates the content of volatile organic acids or volatile fatty acids (VFA, mostly acetic acid) in terms of mgHAc/L and TAC shows the total inorganic carbonat or buffer capacity in terms of mgCaCO3/L. FOS/TAC is measured throughout the titration of sulfuric acid 0.05 M (H2SO4) in the vinasses:sludge solution, in order to change pH to 5 and then to 4.4 (Buchauer 1998, Mézes et al. 2011). In other words, the FOS/TAC value measures the relation between the acid concentration and the buffer capacity in the bioreactor. According to Burgot (2012) the quantity of strong acid or strong base required to modify the pH in a solution, determines its buffer capacity. If a high amount of acid or base is required, the buffer capacity of the system is also high. This buffer capacity (β) is indicated by the value TAC. Lossie and Pütz (2008) published that the FOS/TAC value should oscilate between 0.3 and 0.6, depending on the substrate to be fermented. If the fermentation substrate contains a high organic acid concentration and the pH drops below 6, the methanogenic bacteria will be inhibited.
The biodegradability index (BI) and competitiveness index (CI) were calculated according to Eq. 1 and 2 (Cruz-Salomón et al. 2017).
whereas, BMP is the biochemical methane potential or cumulative methane yield obtained and 350 is the theoretical volume of methane per gram COD removed at normal temperature and pressure (T = 273 ºK; P = 1 atm). The BI indicates the amount of organic matter able to be degraded by the microbial population. If BI is lower than 0.3, the substrate is not suitable for AD or the microbial population conditions are not optimal for biodegradation. Regarding CI, if it shows values higher than 10, no competition between the sulfate-reducing and methanogenic bacteria takes place. Thus a good bacterial interaction can be determined.
Kinetic modelling
In order to understand the kinetics of methane and biogas production of AD vinasses and to predict the further biogas and methane yields, a mathematical model of sigmoidal bacterial growth curve was used. The curves of biogas and methane production were fitted to the curves generated from the modified Gompertz model (Eq. 3), in order to evaluate the specific growth rate and lag phase (first step to bacterial growth) of the bioreactor microbial population (Rolfe et al. 2012, Ware and Power 2017). A regression analysis of non-linear least-squares was carried out by means of the software Statistica 13. A 95 % confidence interval was used for the goodness-of-fit. The correlation coefficient r was calculated in order to determine the correlation between experimental and theoretical data.
from which:
y |
cumulative gas yield (LCH4/kgVS) |
N |
maximum production potential (LCH4/kgVS) |
No |
start gas production (LCH4/kgVS) |
µm |
maximum specific yield growth rate (LCH4/kgVS*d) |
λ |
lag phase (days) |
t |
incubation time (days) |
Figure 1 (right) shows the typical bacterial growth curve, which approaches a typical cumulative biogas and methane curve (Fig. 1 left). The bacterial growth begins with the dilatory gas generation and accelerates to a maximum growth rate µm in a certain time called lag phase λ. At this point the hydrolitic bacteria degrade polymers, carbohydrates, fat and protein, in monomers sugar, fatty acids and aminoacids. Afterwards a quick gas production can be apreciated, where methane is formed from the organic fatty acids, hydrogen and carbon dioxide. Latterly the stationary phase is reached, when the growth rate diminishes at the asymptote N (Ware and Power 2017).
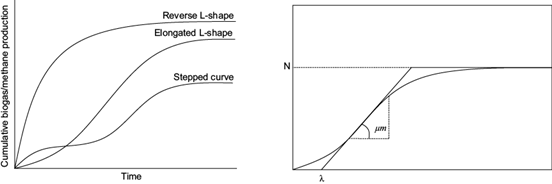
Fig. 1 Left: typical cumulative biogas/methane yields. Right: typical bacterial growth curves (VDI 2016, Ware and Power 2017).
Main objective of the kinetic study was to determine the maximum production potential, maximum specific gas yield growth rate and lag phase. By means of the Gompertz equation the further behavior of the methane and biogas yield curves was predicted.
RESULTS AND DISCUSSION
Biogas and methane production
COD of mezcal vinasses and activated sludge were 59 and 5.7 g/L, correspondingly. Activated sludge had a pH of 8.24 and vinasses 4.77. Total solids and volatile solids were 49.17 and 14.58 g/L for vinasses, as well was 5.34 and 1.97 g/L for activated sludge. The COD determines the content of oxidizable compounds in the biomass, which contribute to the biogas production (VDI 2016). On the other hand, the biomass is composed of water and total solids. The total solids are composed of ash and volatile solids, from which biogas will be produced (SE 2015). The inoculum used at the beginning of the experiments showed to have a low amount of oxidizable matter, because COD and TS are very similar (5.7 and 5.3 g/L). This statement suggests that the microbial activity of the inoculum itself was not responsible for the biogas/methane production, but it was given from the vinasses, whose volatile solids and COD are much higher. Nitrogen content in mezcal vinasses was 0.126 g/L and in activated sludge 0.042 g/L. According to Friehe et al. (2013) a balanced content of essential nutrients like carbon and nitrogen is very important in order to achieve a stable AD process. Nitrogen is required for the activation of enzymes related to the metabolic activities in the bioreactor. When the C/N-ratio is high (content of carbon > content of nitrogen), the existing carbon can not be completely metabolized and the methane yield will be much lower than expected. If the C/N-ratio is low, the nitrogen content will be high. This can result in the generation of ammonia (NH3), which can inhibit the bacterial growth, and thus the biogas and methane production. The COD/N-ratio for AD should lie by 800/5 (Moletta 2005). COD/N-ratios of the vinasses and activated sludge were calculated according to the COD and TN measurements at the beginning of the experiments. The results of the calculations were 59 000/126 or 2341/5 for mezcal vinasses and 5700/42 or 679/5 for activated sludge. In the case of vinasses, the content of carbon was three times higher than it should be. For the long term operation of the bioreactor, a higher nitrogen content should be guaranteed, either using a substrate or inoculum rich in nitrogen (e.g. protein-rich), or directly adding nitrogen to the bioreactor (e.g. ammonium or urea addition) (Borja et al. 1996, Liu et al. 2015).
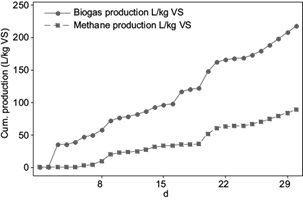
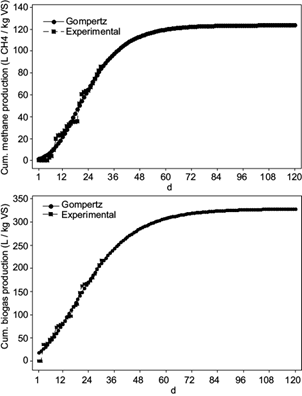
Figure 2 shows the cumulative biogas and methane production of vinasses over a period of time of 30 days. AD reached a biogas yield of 217 L/kgVSvinasses and a methane yield of 85.5 L/kgVSvinasses. In terms of removed COD the biogas and methane production resulted in 196 L/kgCOD removed with 55 % methane content in biogas, after 30 days of experiments. Méndez-Acosta et al. (2010) obtained 160 L/kg COD removed after 30 days start-up. Further operation of the bioreactor could result in an efficient AD, this can be confirmed with the curves of the predicted biogas and methane yields (Fig. 3), which were obtained by means of the modified Gompertz equation. According to the mathematically predicted values, after 120 days of experiments, biogas and methane yields should achieve approximately 325 L/kgVS and 125 LCH4/kgVS. By day 60, the curves should had achieved stable values around 300 L/kgVS and 120 LCH4/kgVS.
Some authors suggest that if all organic matter is anaerobically degradable and converted to methane, the expected methane production should be 350 L/kg COD removed by a long-term AD operation (Gallert et al. 1997, Koutrouli et al. 2009). Moletta (2005) reported a biogas production of 400-600 L/kg COD removed, in a long-term AD operation. Méndez-Acosta et al. (2010) reported a biogas production of 537 L/kg COD removed with 60 % methane, after 200 days of experiments. By day 30 (start-up) the biogas production was approximately 160 L/kg COD removed.
The biogas production began the second day of the start-up process and the methane production the fifth day. AD occurs in four steps: hydrolysis, acidogenesis, acetogenesis and methanogenesis. The different inoculum bacteria groups related to each biogas production stage, reproduce at different rates to degrade polymers and generate acetic acid, hydrogen and carbon dioxide for the methane production (Friehe et al. 2013). The reproduction rate of the methanogenic bacteria is the most slowly of all the bacteria groups. Methanosarcina needs up to 360 hours for reproduction and the methanococcus 240 hours. In comparison, the hydrolytic and acidogenic bacteria need 24 - 36 hours and the acetogenic bacteria 40 - 132 hours for reproduction (KWS 2009). For this reason, methanogenesis is the slowest step to methane production. This is reflected in the present work, where the methane production started five days after biogas generation started. The results of the kinetic study are shown in table III and figure 3. Both experimental curves showed good visual fits to the curves generated from the Gompertz equations. The correlation coefficient r shows also values near to 1, what indicates a positive correlation between experimental and theoretical curves. The maximum specific growth rates µm were 7.77 L/kgVS*d for biogas and 3.81 LCH4/kgVS*d for methane. As expected according to the slow reproduction rate of the methanogenic bacteria, the lag phase or time to achieve µm, was achieved in 2 days for biogas and 7 days for methane.
TABLE III KINETIC STUDY PARAMETERS
| Biogas yield | Methane yield | |
| Maximum production potential (L/kg VS volatile solids) | 328.91 | 123.72 |
| Maximum specific gas growth rate µm (LCH4/kgVS*d) | 7.77 | 3.81 |
| Lag phase λ | 2 | 7 |
| Correlation coefficient r | 0.99 | 0.98 |
The biogas rate in terms of liters of biogas daily produced varied from 0 up to 2.75 L/d in the 30-days adaptation period (Fig. 4). The first feeding had positive effects in the biogas production. On the third day the highest recorded biogas production of 2.75 L/d was achieved, which according to the norm VDI 4630 (VDI 2016) is a normal behavior in AD assays. This result was also reflected on the kinetic study, whereas the maximum specific biogas growth rate, called lag phase λ, was achieved after two days. A second biogas peak was given after the first feeding, when the biogas production increased to more than 1 L/d. After this day, the biogas production diminished and remained low (0.1 - 0.5 L/d). According to Williams (1983) the organic acids content and COD content have a positive correlation with each other, the higher COD content, the higher organic acids content. The content of COD in vinasses is higher than in sludge, wastewater and other substrates, therefore the organic acids content in vinasses is also high. The organic acids measured in the bioreactor after the first feeding was 20 gFOS/L. This measured value was higher than recommended by Voß et al. (2009). According to Mézes el at. (2011), if the amount of organic acids or FOS exceed 10 000 mgFOS/L, an incomplete metabolism by high organic acid content might inhibit AD. At the same time the buffer capacity of the system was low, TAC value was 12 gTAC/L and increased with the time of the experiment up to 31 gTAC/L. In this study the adaptation process was done replacing 30 % of the total volume with new vinasses (Méndez-Acosta et al. 2010), nevertheless the results of the first parameters measured after the first feeding suggest that the amount of vinasses in the bioreactor start-up should had been lower to achieve a better AD performance. The second feeding resulted at first in a reduction of the biogas production, two days later the biogas production increased to 1.6 L/d. By day 20 the biogas production increased almost to 2 L/d, which indicates that the high amount of organic matter was already degraded to simple sugars and carbohydrates, and the organic acids were converted to methane. At this point the amount of organic acids and the buffer capacity of the system increased. Before the third feeding took place, the conversion of VFA to methane decreased and by day 25 the biogas production increased again and gained stable values around 0.75 L/d. Although there was an increase in volatile organic acids (up to 45 g/L) after the last feeding, pH showed stable values around 7, as the buffer capacity of the system increased. These conditions allowed a good adaptation between the microbial system and the vinasses, already by day 30. Some authors have reported adaptation periods of more than two months, by AD of vinasses from wine distilleries (Méndez-Acosta et al. 2010).
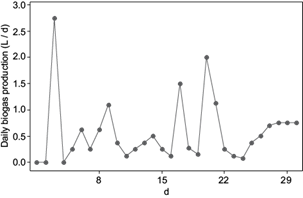
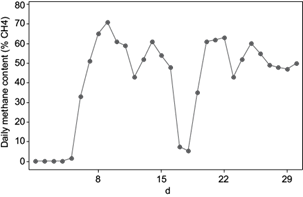
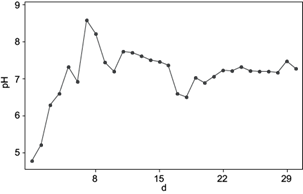
Figure 5 shows the methane content in the daily produced biogas and figure 6 shows the pH measured every day. The daily methane content fluctuates mostly between 40 and 60 %. The first five days, no methane production was shown and the first three days pH was lower than 6.5, which is the minimum recommended for methane production (Friehe et al. 2013). Even when adjusting pH to 7, it dropped after some hours of adjustment. This fact suggests a low buffer capacity of the system, which showed 12 gTAC/L. After the third day, pH adjustment could be successfully maintained by 7, whereas TAC value continued to increase. FOS/TAC value was 1.6, three times higher than recommended by Lossie and Pütz (2008), due to the amount of volatile organic acids (20 gFOS/L). After the first feeding, methane content began to increase to 33 % and by day nine the highest recorded methane content near to 70 % was achieved. This can also be appreciated in the kinetic study, when the maximum specific methane growth rate was achieved by the first feeding. At this point pH achieved also the highest value of 8.5, FOS/TAC remained the same and the amount of volatile organic acids continued to increase to 33 gFOS/L. After this and before the second feeding took place, methane content decreased up to 40 %, where pH remained stable around 7.5. The second feeding showed negative effects in the methane production, when the methane content decreased considerably up to 5 %, pH dropped to 6.3 and FOS/TAC met the highest recorded value (five times more than recommended). The amount of organic acids increased from 20 to 33 gFOS/L, resulting in a low efficiency in converting organic acids to methane. According to Franke-Whittle et al. (2014) the increase on volatile fatty acids reflects the imbalance between acid production and consumption by the microorganisms. It is related to the drop of pH and buffering capacity of the inoculum. Three days prior to the third feeding, methane content increased again and achieved values around 60 %. After this point FOS/TAC dropped, pH continued to be stable (7 - 7.5), TAC continued increasing from 29 to 31 gTAC/L, and so the amount of organic acids (from 40 to 45 gFOS/L) until the end of the adaptation period. These findings indicate that the bioreactor achieved a high buffer capacity after the third feeding. A slightly drop of the methane content to 45 % was recorded by day 23 but after day 24, methane content remained around 50 and 55 %. The amount of volatile organic acids continued increasing, but pH value remained stable (around 7) due to the increase in the buffer capacity. For the long-term bioreactor operation, an enhancement in the methane content is expected, like the case of Méndez-Acosta et al. (2010) and Jáuregui-Jáuregui et al. (2014). Also the mathematical prediction of the methane and biogas curves suggests a succesfull long-term operation. In order to increase the biogas production and especially the methane content, the use of biofilms in bioreactor is recommended (Carlos-Hernández et al. 2014, Martí-Herrero et al. 2014).
Regarding the methane content, after day 25 a constant methane production around 50 and 55 % was achieved. Méndez-Acosta et al. (2010) reported a methane content of 60 % during a 50-days start-up period using a lower COD content of 10 g/L in the mixture wastewater vinasses. In the present study, during the 30-day adaptation period, COD content of the mixture activated sludge and vinasses was 17 g/L. This comparison suggests that a higher COD content in fermenting mixture results in a lower methane content in biogas. A lower COD content should be used to stress the microbial population as less as possible, and achieve a higher AD efficiency. By the end of the experiment COD reduced to 11 g/L. In comparison to other authors, in this experiment a higher amount of vinasses could be used when feeding every seven days instead of every 15 days. The biogas quantity and methane content were similar, altough the organic matter removal was not especially high. Jáuregui-Jáuregui et al. (2014) reported an increase in the methane production from 60 to 70 % during the start-up period of 28 days of a bioreactor using a PVC support as biofilm to enhance AD and COD removal. Main target of biofilms is to avoid the wash out effect in bioreactor, which occurs when active bacteria flows out of the bioreactor before bacteria contribute to AD. When using biofilms, the hydraulic retention time is separated from the solid retention time, decreasing the bacteria wash out effect and increasing the biogas and methane production rates, as well as COD removal. Two kind of biofilms are found in industrial applications, biofilms that grow on supports (resin, concrete, pet) or granular biofilms (forming flocs or granulate formations). Different material have been tested, such as seashell, charcoal, break, gravel, plastic materials, ceramic, sintered glass, fire bricks, natural stones including limestone, gravel, pumice, clay, rocky aggregates, sand, granular activated carbon, saponite and synthetic plastic materials (Qureshi et al. 2005, Carlos-Hernández et al. 2014, Martí-Herrero et al. 2014). From a material comparison, charcoal showed the best COD removal, methane yield and lowest volatile fatty acids accumulation from whey treatment, while pumice showed the worst results (Patel et al. 1995).
Friehe et al. (2013) reported an optimal pH value between 5.2 and 6.3 for the hydrolytic and acidogenic bacteria to reproduce, nevertheless the most favorable pH for acetogenic and methanogenic bacteria lies around 6.5 to 8 pH. Due to the fact that most of the bioreactors work with one stage fermentation process, the optimal pH to be used in AD should lie around 6.5 and 8. According to Jayaraj et al. (2014) when comparing pH of 5, 6, 7, 8 and 9 for biogas production, the optimal pH showed to be 7 for more efficient biogas production.
COD removal
COD of the vinasses-sludge mixture was at the beginning of the experiment 17.37 g/L. Before the first feeding took place, COD removal was 2 %. After the second feeding COD removal was 5 %. Furthermore, COD removal continued to increase to 21 % by day 25 and up to 34 % at the end of the last feeding. COD removal increased to 34 % in 30 days with increasing OLR, whereas the amount of organic acids increased and also the buffer capacity of the system. Accordingly, due to the high substrate availability, as the case of higher organic acid content, there is an increase in microorganism consumption of organic matter (Oliveira et al. 2013). Similar results were obtained by Méndez-Acosta et al. (2010) operating a bioreactor with vinasses with a low COD content. During the start-up period COD removal increased from 3 % to 85 % in 50 days. By day 30 the COD removal was around 70 %. In the present work, COD removal was rather poor, which can be explained because of the low C/N-ratio in the bioreactor. A high C/N-ratio in a bioreactor means that the carbon content is higher than the nitrogen content. In this case the existing carbon could not be completely metabolized and COD could not be efficiently removed. By increasing the nitrogen content in the bioreactor, COD removal might be enhanced. Regarding BI, in this study the BI index was 0.22, what indicates that either vinasses are not suitable for AD or the microbial population conditions were not ideal. Some authors report vinasses as an adequate substrate for AD, due to the high carbon source and sugar content to be used by the microbial population (Robles-González, et al. 2012, Cruz-Salomón et al. 2017). In the present assay, vinasses contained a total sugar content of 51 g/L. In this study CI index oscilated between 16 and 25, what indicates a good bacterial interaction when digesting vinasses with sludge (Cruz-Salomón et al. 2017). All this facts suggest that vinasses are an adequate substrate for AD, altough the microbial population conditions, such as a high FOS/TAC, were not ideal. On the one hand sludge might not be as efficient as other incoulum sources. According to Hidalgo and Martín-Marroquín (2014), the inoculum source is very important when digesting complex substrates with high organic content, like the case of vinasses. Gu et al. (2014) compared different inoculum sources for AD, finding out that manure showed better results than sludge. These findings open new alternatives to consider other inoculum sources for vinasses AD in further experiments. The use of biofilms for microorganisms immobilization could had enhanced also the COD removal, like the case of microbial fuel cells used for wastewater treatment and energy production (Revelo et al. 2013, Santoro et al. 2017).
FOS/TAC
The FOS/TAC value describes the condition of the bacteria in regards to acidification and the buffer capacity of the system. If the FOS/TAC value is more than 0.4, the substrate supply must be reduced. A low FOS/TAC value (0.2) indicates that more substrate needs to be fed in the bioreactor to increase the AD efficiency (Voß et al. 2009). In the present study, FOS/TAC values were always higher than recommended by Lossie and Pütz (2008). According to Buchauer (1998) and Mézes et al. (2011), the FOS or volatile organic acids indicate the VFA content, mostly acetic acid in terms of mgHAc/L. The FOS in the reactor increased after each feeding, it started by 20 gFOS/L and ended by 45 gFOS/L. The first days of operation the system showed to have a low buffer capacity. This could be verified with the pH drop (even adjusting with NaOH), the accumulation of organic volatile acids and the low existing TAC (12 gTAC/L). Later on, TAC values increased up to 31 gTAC/L, which indicates an enhancement of the buffer capacity of the system. By day 16, FOS/TAC achieved the highest value, where also the lowest methane content is recorded. At this point, the amount of organic acids contained in the bioreactor was two times higher than the buffer capacity of the system. These results suggest an accumulation of acids by the first two feeding steps, where the organic matter was high and the bacteria was still too stressed to degrade the substrate efficiently. That is why the methane content and pH value diminished by day 16. Afterwards the organic acids content continued to increase, although the FOS/TAC value continued to decrease. These indicates a higher organic acids availability for their further conversion in methane and a higher bioreactor buffer capacity, which suggests a successfully adaptation of the system where the organic acids did not affect the FOS/TAC or pH value anymore.
CONCLUSIONS
Due to their composition, vinasses are a very promising substrate for biogas and methane production. The bioreactor adaptation is a very important step in order to achieve stable values of biogas and methane production, for the further long-term bioreactor operation. In this work the successfully 30-days adaptation of a bioreactor operating with activated sludge as inoculum and mezcal vinasses as substrate, at a vinasses concentration of 42 % v/v, was achieved. Four feeding steps were carried out replacing 30 % of the total volume with new vinasses every seven days. The adaptation step intends to stress the microbial population as less as possible, getting an efficient conversion of organic acids to methane. This was verified already after the third feeding took place, when pH and FOS/TAC remained constant, even when the amount of organic acids in the reactor increased. The buffer capacity increased at the same time, when TAC value increased. The constant biogas production as well as methane content showed also constant values after the third feeding, what suggests a successfully conversion of organic acids to methane.
An efficient adaptation of the anaerobic sludge to the mezcal vinasses was achieved after three feedings, when the microbial population was better adapted to the environment showing a stable biogas production and methane content in biogas, as well as higher buffer capacity, although the organic acid content increased after every feeding. Biogas production reached 217 L/kg VSvinasses with an average of 50-55 % methane content. The highest achieved COD removal was 34 %, which took place by the last feeding step. This indicates that the adaptation process enhances the efficiency of organic matter removal and eventually other pollutants. COD removal was indeed high after the last feeding took place, however could had achieved higher values when taking in consideration the C/N-ratio for AD (increment of nitrogen content), or like suggested in the literature, when using biofilms in the bioreactor. The use of biofilms should separate the hydraulic retention time from the solid retention time in the reactor, decreasing the bacteria wash out effect and increasing the biogas and methane production rates, as well as COD removal.

