nueva página del texto (beta)
 Inglés (pdf)
 Artículo en XML
 Referencias del artículo
 Enviar artículo por email
 Citado por SciELO
  Similares en
SciELO
Similares en
SciELO 
 Permalink
INTRODUCTION
Three coal fired-power plants have recently been installed in Mexico, which use domestic and imported coal (mainly from the USA) to generate electricity. The control systems of these coal-fired power plants are primarily electrostatic precipitators (ESPs), which results in virtually all mercury being emitted into the atmosphere, leaving only a small amount in the bottom ash and slag, and in the fly ash (USEPA 2005, 2011). Insufficient studies have been conducted about the mercury in the coal used by Mexican power plants, and mercury emissions from these power plants, because there is not a national standard maximum emission level.
The Minamata Convention on mercury, signed by 140 countries including Mexico since 2013, agreed to reduce mercury emissions into the atmosphere, and to identify power plants that use coal to generate electricity (UNEP 2015). Analyzing the mercury content in domestic and imported coal used for electricity generation at the three coal-fired power plants operating in Mexico and determining their mercury emissions is an important task.
In this study, mercury emissions for 2013 from the CETEPEC power plant were calculated using the USEPA methodology and information about fuel consumption per day and generating unit provided directly by the Federal Electricity Commission of Mexico. The obtained daily mercury emissions for 2013 will be useful in further studies of mercury emissions for this and other coal-fired power plants in Mexico (Carbón I and Carbón II). Considering the daily fuel consumption per unit of electricity generated, we can understand and propose control measures to increase the efficiency of each unit to reduce mercury emissions.
Since this study only uses information from the CETEPEC power plant for the year 2013, we think this information should be updated with additional data for the power plants Carbón I and Carbón II, which it will reflect a very important advance towards complying with the Minamata Convention.
Background
Gaseous elemental mercury (GEM), gaseous oxidized mercury, and particulate bound mercury (PBM) are persistent, toxic, and bio-accumulative pollutants in water, soil, and air (UNEP 2013, NADP 2015, USEPA 2015a, b). Galbreath and Zygarlicke (2000) reported that GEM, GOM and PBM are formed during the combustion of coal. Coal contains trace amounts of mercury (typically from 0.01 to 0.5 mg/kg), which are emitted as GEM when coal is combusted at approximately 150 °C (Senior et al. 2000, Hassett et al. 2002, 2004, Heebink and Hassett 2005, Zhang and Wong 2007, Wang et al. 2010).
GEM can travel many thousands of kilometers from its emission source, therefore it has a global impact (Schroeder and Munthe 1998, Streets et al. 2009, Pacyna et al. 2010). PBM falls to the ground near its emission source, whereas GOM is oxidized and reduced to other forms in the atmosphere. The environmental effects of PBM and GOM are manifest at local and regional scales (Pavlish et al. 2003).
Zhang et al. (2008) demonstrated that PBM and GOM might be efficiently retained by the emissions control systems of electrical facilities such as electrostatic precipitators, desulfurizers, and fabric filters. Moreover, Wang et al. (2010) recommended the use of a combination of control systems (electrostatic precipitator and desulphurizer) to reduce mercury emissions 73 %, compared with 24 % when an electrostatic precipitator is used alone. Pirrone et al. (2001, 2010) indicated that desulfurizers can be used in control systems but are not commonly used in developing countries or those with economies in transition.
Mercury emissions from Mexico
Three coal-fired power plants are installed in Mexico. Two operate in the north of the territory (Carbón I and Carbón II in the state of Coahuila), both using domestic (90 %) and imported coal (10 %), mainly come from the USA, Australia and South Africa. The third plant, referred as Presidente Plutarco Elías Calles (CETEPC), is located in the Pacific coast (in the state of Guerrero) and operates 100 % on imported coal, mainly from the USA.
Considering how toxic and persistent is the presence of mercury in the atmosphere, Sosa et al. (2014, 2017) investigated the mercury emissions from 2012 to 2013 using monthly coal consumption data provided directly by the industrial sector for the three Mexican coal-fired power plants, and Fuentes et al. (2017) reported the spatiotemporal variability of atmospheric mercury using per-day and per-generating-unit data of one coal-fired power plant (CETEPEC) in Mexico. Fuentes et al. (2017) reported that mercury concentration in the coal from a Kansas mine in the USA, which is used by CETEPEC, was 0.335 mg Hg/kg of coal, and Múgica et al. (2003) reported a concentration of 0.333 mg Hg/kg in Mexican coal.
Table I shows the mercury emissions from coal-fired power plants by country. Mexico did not report mercury emissions between 2008 and 2011, thus it is very important that Mexican institutions provide better emissions thereafter. In general, Mexico does not have major problem regarding mercury emissions in a worldwide level, since they are very low compared with South Africa, India, Australia, China, and the USA. This is primarily due to the fact that Mexico has only three coal-fired power plants, while other countries have hundreds of these facilities for the generation of electricity. Therefore, Mexico’s mercury emissions do not represent an impact on worldwide levels, but it is necessary to identify if there are national or local effects near the sites of these plants. For the North American region (Canada, Unites States, and Mexico), Canada had minor mercury emissions from 2011 to 2013, because its power plants only work in the periods of peak energy demand (hours, days or weeks), according to CEC (2011). The USA presents the highest levels of mercury emissions within the region; however, the USA government is restricting mercury emissions with technologies and specific control systems. In Mexico, according to the Secretaría de Energía (Ministry of Energy) of Mexico, the three coal-fired power plants are working continuously for electricity generation, and the control system is an electrostatic precipitator that does not completely retain the mercury emissions (SENER 2015).
TABLE I MERCURY EMISSIONS (t) FROM COAL-FIRED POWER PLANTS BY COUNTRY
| Country | 1990 | 1999 | 2001 | 2002 | 2004 | 2005 | 2008 | 2009 | 2010 | 2011 | 2012 | 2013 | In this study |
| USA1 | 60 | 60 | 55 | 49 | 29 | 66 | 26 | 40 | 46 | Mexican CETEPEC power plant: 1.9 t |
|||
| Canada2 | 1.3 | 2.2 | - | - | - | 2.1 | 1.5 | 1.6 | 1.4 | 0.9 | 0.8 | 0.8 | |
| Mexico3,4,5,6,7 | 1.6 | 2.2 | 0.97 | 1.1 | 2.9 | 1.9 | - | - | - | - | 1.7 | 1.6 | |
| China8 | - | 68 | 62 | 69 | 91 | 100 | 257 | 257 | 253 | - | - | - | |
| Australia9 | - | - | - | - | - | 8 | - | - | - | - | 2.8 | 2.8 | |
| India10 | - | - | - | - | 120 | 96 | 120 | - | - | - | 100 | 100 | |
| South Africa11 | - | - | - | - | 31 | - | - | - | - | 125 | 124 | 123 |
1USEPA (2017), 2ECCC (2017), 3Acosta y Asociados (2001), 4Vijay et al. (2004), 5Larralde (2004), 6CEC (2011), 7Sosa et al. (2014, 2016), 8MEP (2016), 9DEE (2017), 10MEFCC (2017), 11DEA (2017)
The technical data about the three coal-fired power plants in Mexico is shown in table II. There are 15 generating units in Mexico, all of them with a control system corresponding to the electrostatic precipitator type, which retains pollutants’ particles with 97 % efficiency. The CETEPEC power plant has a major electricity generation capacity-near 700 MW-, much higher than Carbón I and II. The plant factor is the relation between electricity generated in a specific period (commonly an annual period) and the total generating capacity of the plant. The plant factor can never be 100 % due to the maintenance of the power plant and the equipment for electricity generation, as well as other considerations.
TABLE II TECHNICAL DATA INFORMATION ABOUT THE THREE COAL-FIRED POWER PLANTS INSTALLED IN MEXICO
| Coal fired-power plant | State | Generating units | Total capacity (MW) | Total electricity generation (GW h) | Average electricity generation (GW h) | Plant factor (%) | Control system |
| Carbón I | Coahuila | 4 × 300 MW | 1200 | 10 512 | 9 200 | 88 | Electrostatic precipitator |
| Carbón II | Coahuila | 4 × 350 MW | 1400 | 12 264 | 10 300 | 84 | |
| CETEPEC | Guerrero | 6 × 350 MW 1 × 678 MW |
2778 | 24 335 | 18 000 | 74 |
Table III shows estimated mercury emissions for the three coal-fired power plants located in Mexico according to Sosa et al. (2014). These estimates were calculated using the USEPA methodology, assuming a mercury concentration in coal of 0.113 mg/kg. Table IV shows mercury emissions estimated by Sosa et al. (2017) using the mercury emission rate.
TABLE III MERCURY EMISSIONS BY THE THREE COAL-FIRED POWER PLANTS FROM MEXICO ACCORDING TO SOSA et al. (2014)
| Coal fired-power plant | Mercury emission (kg/year) | |
| 2012 | 2013 | |
| Carbón I | 566 | 505 |
| Carbón II | 515 | 472 |
| CETEPEC | 665 | 659 |
| Total | 1746 | 1636 |
TABLE IV MERCURY EMISSIONS BY THE THREE COAL-FIRED POWER PLANTS FROM MEXICO ACCORDING TO SOSA et al. (2016)
| Coal fired-power plant | Mercury emission (kg/year) | |
| 2012 | 2013 | |
| Carbón I | 526 | 469 |
| Carbón II | 478 | 438 |
| CETEPEC | 4477 | 4433 |
| Total | 4477 | 4433 |
According to the USEPA (2011) it is very important to determine the GEM, GOM and PBM from a coal-fired power plants that use emission control systems such as electrostatic precipitators or consumption of coal by type (subbituminous or bituminous). Mexico does not have a methodology to determine those fractional mercury emissions directly in the power plant, and the USEPA indicates that the fraction of GEM, GOM and PBM is 87.41, 12.52 and 0.06 %, respectively (USEPA 2011).
Also, it is very important to consider the mercury mass balance in the CETEPEC power plant, to determine how much is emitted to the atmosphere and how much was not combusted into the boiler and remains in the solid matter. The fractions corresponding to bottom ash, slag, and fly ash are 11, 5, and 84 %, respectively (USEPA 2002, 2011).
CETEPEC technical data information
Currently, the CETEPEC power plant has seven power generating units and a total capacity for electricity generation of about 2778 MW. The generating units 1 (U1) to 6 (U6) have a daily coal consumption per unit of about 3000 t; however, generation unit 7 (U7) has a daily coal consumption of about 6000 t. The combustion system uses pulverized coal, a system of emission control of low nitrogen oxides (NOx), and electrostatic precipitators for each generating unit. However, there is no control system for sulfur dioxide (SO2), and it does not have washers of output gases for the retention of mercury. Personnel of the CETEPEC power plant indicated that, of the total coal consumed in the process to generate electricity, 10 % corresponds to ash types (bottom, slag, and fly); from this percentage, 16 % correspondes to bottom ash and slag from the boiler, and 84 % to fly ash from the control system. The CETEPEC administration does not perform the elemental analysis of the coal discharge. That is why this study is relevant for the proposal prevention measures, and the minimization and control of a toxic contaminant such as mercury, originating from the coal-fired power plants installed in Mexico.
MATERIALS AND METHODS
The method for calculating mercury emissions into the atmosphere considered the mercury concentration in coal and the modified emission factor (USEPA 1997), from which the following equation is obtained:
This equation accounts for mercury content in the coal. For this study, we used Eq. (1) because mercury concentration is different in the coal used by coal-fired power plants. To determine the mercury emission, we used a concentration of 0.335 mg Hg/kg of coal, determined by Fuentes et al. (2017) for Mexico.
Control systems used by coal-fired power plants installed in Mexico correspond to electrostatic precipitators with value 1, as recommended by the tables developed by the USEPA (1997). In this case mercury emissions are not retained in the control system because they are released as gaseous elemental mercury (GEM). The modified emission factor with value 1 indicates that the GEM is emitted totally into the atmosphere because the ESP retains non-gaseous pollutant particles as GEM. This information corresponds to the USEPA methodology; however, in order to identify mercury emissions into the atmosphere, we determined the fractional GEM, GOM and PBM, as well as the mercury mass balance, in the following manner:
For GEM, GOM and PBM from coal-fired power plants that use electrostatic precipitators and consumption of coal by type (subbituminous or bituminous), we used the profile of GEM, GOM and PBM corresponding to 87.41, 12.52 and 0.06%, respectively (USEPA 2011).
To consider the mercury mass balance in the CETEPEC power plant, we contemplated information about the total coal consumed in the process of generating electricity, of which 10 % corresponds to ash types (bottom, slag and fly); of these, 16 % corresponds to bottom ash and slag from the boiler, and 84 % to fly ash from the electrostatic precipitator and control system.
RESULTS AND DISCUSSION
Mercury emissions from the CETEPEC power plant calculated by Eq. (1) enable the identification of the temporal variability of mercury emissions per day and per generating unit.
Table V shows the results for mercury emissions from each generating unit of the CETEPEC power plant for 2013. We can note the working days for each generating unit. U7 shows the highest emissions (near 2 kg/day) of mercury into the atmosphere. The daily standard deviation of mercury emissions for each generating unit is low.
TABLE V STATISTICAL PARAMETERS FOR MERCURY EMISSIONS (kg/year) BY EACH GENERATING UNIT OF THE CETEPEC POWER PLANT
| Parameter | U1 | U2 | U3 | U4 | U5 | U6 | U7 |
| Data (days) | 335 | 213 | 230 | 319 | 305 | 258 | 325 |
| Total emission | 293.8 | 134.6 | 195.9 | 273.5 | 260.0 | 227.2 | 556.9 |
| Maximum/day | 1.09 | 0.71 | 1.04 | 1.04 | 1.07 | 1.05 | 1.92 |
| Minimum/day | 0.05 | 0.01 | 0.01 | 0.00 | 0.01 | 0.18 | 0.29 |
| Average | 0.88 | 0.63 | 0.85 | 0.86 | 0.85 | 0.88 | 1.71 |
| Standard deviation | 0.17 | 0.09 | 0.16 | 0.18 | 0.17 | 0.13 | 0.17 |
| 25th percentile | 0.84 | 0.63 | 0.82 | 0.85 | 0.79 | 0.86 | 1.66 |
| 50th percentile | 0.92 | 0.65 | 0.89 | 0.90 | 0.91 | 0.91 | 1.74 |
| 75th percentile | 0.98 | 0.66 | 0.95 | 0.95 | 0.95 | 0.96 | 1.81 |
The temporal variability of mercury emissions per day is illustrated in figure 1. From April to July there was an increase in electricity generation, since in this time of the year (spring-summer) air conditioning systems operate at 100 % of their capacity. The highest mercury emissions (above 7.5 kg/day) from all units occurred in April 19, 24, and 25, with 7.53, 7.56, and 7.59 kg/day, respectively; May 2 and 3, with 7.52 and 7.57 kg/day, respectively. Total mercury emissions in 2013 were 1943 kg of mercury into the atmosphere from all units.
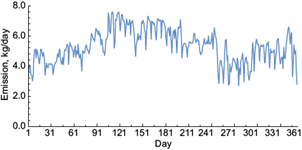
Table VI presents emissions of gaseous elemental mercury (GEM, Hg0), gaseous oxidized mercury (GOM, Hg2+), and particle bound mercury (PBM, Hgp) from the CETEPEC power plant in 2013. GEM is the major emission with respect to GOM and PBM, due to the control system installed in CETEPEC corresponding to the electrostatic precipitator. U7 presented the highest mercury emission as GEM, since it consumes about 6,000 t of coal per day due to its high capacity for electricity generation (about 700 MW).
TABLE VI MERCURY EMISSIONS IN 2013: GASEOUS ELEMENTAL MERCURY (GEM), GASEOUS OXIDIZED MRECURY (GOM) AND PARTICLE BOUND MERCURY (PBM) USING THE USEPA METHODOLOGY1
| CETEPEC power plant | ||||
| Generating unit | Emission (kg) | GEM (kg) | GOM (kg) | PBM (kg) |
| 1 | 294 | 257 | 37 | 0.18 |
| 2 | 135 | 118 | 17 | 0.08 |
| 3 | 196 | 171 | 25 | 0.12 |
| 4 | 274 | 240 | 34 | 0.16 |
| 5 | 260 | 227 | 33 | 0.16 |
| 6 | 227 | 198 | 28 | 0.14 |
| 7 | 557 | 487 | 70 | 0.33 |
| Total | 1943 | 1698 | 244 | 1.17 |
To estimate mercury mass balance in CETEPEC it was necessary to consider the mercury concentration in coal (0.335 mg/kg), mercury concentration in bottom ash and slag (0.148 mg/kg), and mercury concentration in fly ash (0.017 mg/kg), all of them analyzed by Fuentes et al. (2017). CETEPEC consumed 5 832 666 t of coal in 2013, 10 % (583 266 t) corresponding to bottom ash and slag, and fly ash. Table VII shows the mercury retained in the boiler and electrostatic precipitator, and the GEM emitted into the atmosphere, while figure 2 presents the mercury mass balance diagram considering the boiler and control system (electrostatic precipitator).
TABLE VII MERCURY MASS BALANCE IN THE CETEPEC POWER PLANT CONSIDERING 583 266 t FOR ASH TYPES
| Type | Composition | Profile | Mercury concentration | Hg input | Hg output | Hg as gaseous elemental mercury |
| Sub-bituminous coal | - | - | 0.335 mg/kg | 1954 kg | - | 1879 kg |
| Bottom ash and slag, from boiler | 16 % | 93 323 t | 0.017 mg/kg | - | 1.6 kg | |
| Fly ash, from control system | 84 % | 489 943 t | 0.148 mg/kg | - | 73 kg |
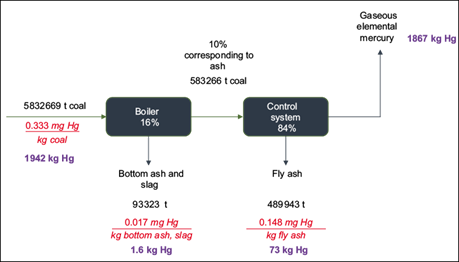
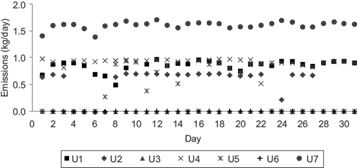
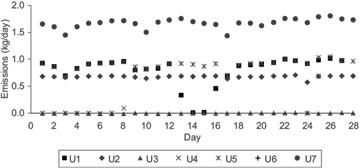
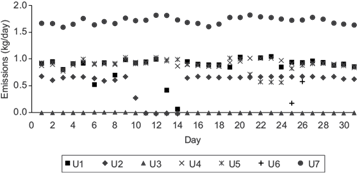
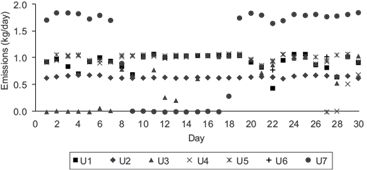
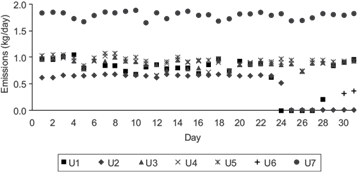
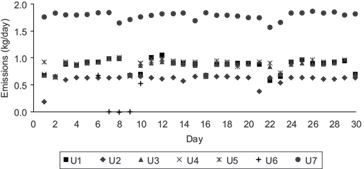
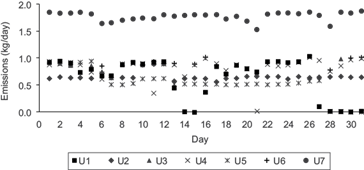
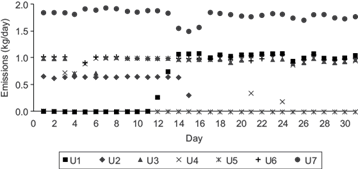
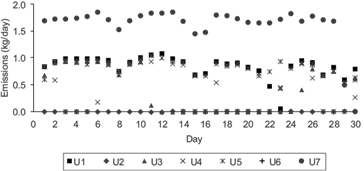
Figure 3 illustrates daily mercury emissions for each generating unit during May, as a case example. U7 emitted the highest amount of mercury, and all generating units were working during that month. Average mercury emitted into the atmosphere from U7 was 1.8 kg, due to its generating capacity of 700 MW; moreover, each generating unit from U1 to U6 have a generating capacity of 350 MW, and their average emission of mercury into the atmosphere was 0.9 kg. Similarly, some generating units were sometimes out of service for a few days or months because they were undergoing maintenance. A slightly higher amount of electricity was generated during April-July because most of the units were working and it was the period of greatest energy demand. Appendix 1 shows the daily mercury emissions for each month during 2013.
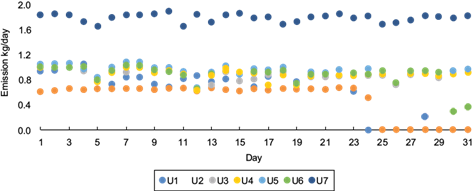
Table VIII shows mercury emission rates for each generating unit during 2013. The values presented in this table are high as compared to mercury emissions from the USA (0.0059 to 0.054 kg Hg/GW h) (NRDC 2012) due to the newer technologies employed in this country for control systems, such as fabric filters, selective catalytic reactors, and activated carbon injection.
TABLE VIII MERCURY EMISSION RATES FROM THE CETEPEC POWER PLANT IN 2013
| Unit | Mercury emission (kg) | Electricity generation (GW h) | Emission rate (kg Hg/GW h) |
| U1 | 294 | 2272 | 0.1294 |
| U2 | 135 | 1041 | 0.1296 |
| U3 | 196 | 1512 | 0.1296 |
| U4 | 274 | 2124 | 0.1290 |
| U5 | 260 | 2051 | 0.1267 |
| U6 | 227 | 1771 | 0.1281 |
| U7 | 557 | 4813 | 0.1157 |
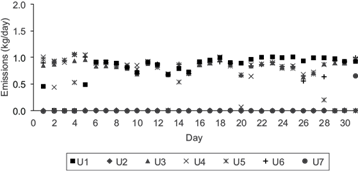
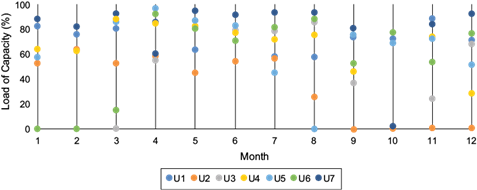
The efficiency of each electricity-generating unit during 2013 is shown in figure 4. The efficiency of U7 was consistently higher than 90 %, whereas U2 was less efficient. This figure also indicates periods during which some generating units were not working.
The percentage of total electricity generation supplied by unit in the CETEPEC plant during 2013 is presented in figure 5. U7 had the highest performance (31 %), whereas U2 had the lowest (7 %) because it was out of service for several months. The other units accounted between 10 and 14 % of the capacity. CETEPEC administration should consider the performance of U7 during the period of major demand for electricity generation.
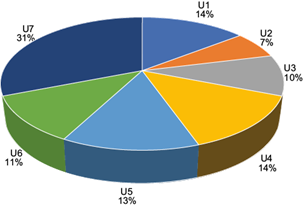
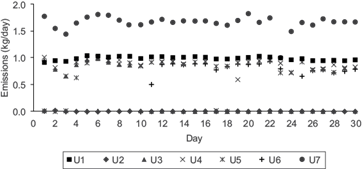
Figure 6 illustrates the amount of mercury emitted seasonally in 2013 by each generating unit of the CETEPEC plant. All units were working during the spring-summer season because of the high energy demand during this period. During autumn some generating units were working below their capacity, but mercury emissions from U7 were always above 90 % of efficiency for electricity generation.
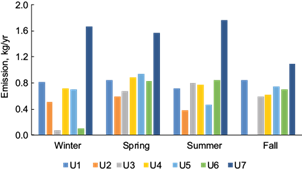
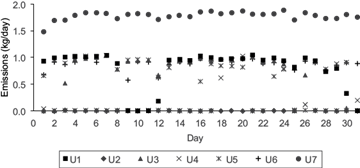
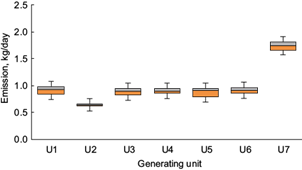
Figure 7 presents the variability of mercury emissions of each generating unit. U2 presented the lowest mercury emissions since it was out of service for several months. The variability of mercury emissions from U1 to U6 was similar and fell within the 50th percentile (0.93 kg/day). The 25th percentile was about 0.83 kg/day, and the 75th percentile was about of 0.95 kg/day. Regarding U7, the 50th, 25th, and 75th percentiles were 1.74, 1.7, and 1.81 kg/day, respectively. The standard deviation is low with respect to the average, indicating that the variability of mercury emissions by each generating unit is low.
CONCLUSIONS
Since in Mexico there is no methodology to determine mercury emissions from its coal-fired power plants, we used the USEPA methodology to estimate mercury emissions from the CETEPEC power plant; however, the most important issue is to generate the emission factors for power plants in Mexico.
Using data information about coal consumption per day and per generating unit provided more reliable mercury emissions, and it also helps to find measures of prevention, minimization and control for each electricity-generating unit.
The period of major demand of electricity generation occurred from April to July, therefore mercury emissions were higher, which confirms that it is necessary to evaluate the load and efficiency of each generation unit during this period.
U7 had the highest mercury emissions into the atmosphere since the load of coal of this generating unit was 95 % of its capacity, and it worked for a longer time in electricity generation during 2013.
GEM emissions were larger than other forms of mercury, so it is necessary to develop new technologies to retain this gas according to the Minamanta Convention for the next years. Considering all the generation units, U7 released the larger amount of GEM into the atmosphere, thus it is important to evaluate this generating unit in the period corresponding to the electricity generation demand in Mexico.
The mercury emission rate for each generating unit was high with respect to the level reported by the USA, thus it is very important that the CETEPEC administration adopts new technologies to reduce the mercury emission rate.
Mexico should plan and implement energy generation alternatives, including reconfiguring or building next-generation power plants that operate at optimal efficiency and emit less mercury into the atmosphere.
The mercury emissions discussed in this study are very relevant because our country has a commitment to reduce them during the following years according to the Minamata Convention signed in 2013.