


 nueva página del texto (beta)
 Inglés (pdf)
 Artículo en XML
 Referencias del artículo
 Enviar artículo por email
 Citado por SciELO
  Similares en
SciELO
Similares en
SciELO 
 Permalink
INTRODUCTION
Most reports on the effects of particulate matter (PM) with aerodynamic diameter equal to or less than 10 µm (PM10) on the pulmonary function of exposed populations were conducted using data from fixed-site air quality monitoring stations (Pope et al., 1991, Dockery et al., 1993, Collins et al. 2003, Bernstein et al. 2004, Peters and Dockery 2005). However, these types of studies assume that each individual in the population is exposed to the same levels of the mixture of pollutants (Moshammer et al., 2006). In fact, the chemical composition and the concentration of air pollutants affecting each individual vary depending on time of day, location, the individual’s activities and their surrounding activities (Al-Zoughool 2015).
Other important factors that influence the estimation of the exposure-response relationships are the types of models used, the length of exposure (i.e., minutes, hours, days), and the time-related delays in the appearance of the associations (i.e., lags) (Bennet and Brown 2005, Moshammer et al. 2006). This has spurred the development of new studies using personal environmental monitoring technology, which improves the estimates of the exposure-response relationships, and complements the studies conducted with data gathered from fixed-site monitoring stations (Delfino et al. 2002, 2004). Most reports found in the scientific literature focus on the impact of air pollutants (e.g., PM) in the pulmonary function of groups of people already presenting a respiratory condition (e.g., asthma) (van der Zee et al. 1999, Peters and Dockery 2005, Reyna et al. 2005, Holguín et al. 2007, Houssaini et al. 2007). However, little attention has been given to the study of groups of people who apparently would be less vulnerable, given their good respiratory health (Strak et al. 2012).
Mexicali offers unique characteristics of PM10 exposure, resulting from natural soil re-suspension and anthropogenic sources, as well as the existence of extreme temperatures characteristic of semi-arid regions. This combination of factors adds value to our study as they represent extreme conditions that might be relevant from the perspective of the impact of climate change on health. The aim of this study was to assess the association between pulmonary function of a group of healthy adults in the city of Mexicali and very short-term exposures (i.e., hours) to ordinary PM10 pollution levels.
MATERIALS AND METHODS
Design
Exposure-response associations were estimated from measurements of the pulmonary function of healthy adults, and measurements of PM10 levels obtained with personal environmental monitors. Pulmonary function was assessed by spirometry tests: forced expiratory volume in one second (FEV1), forced vital capacity (FVC), and FEV1/FVC ratio.
This was an observational prospective study which included repeated personal exposure assessment and a single evaluation of the outcome at the end of the exposure assessment. Healthy adult volunteers were scheduled in groups of three to equip them with a personal environmental monitor on the morning of the day allocated for the study (excluding Saturdays, Sundays or holidays). With the monitors in place, subjects did their normal activities and returned after 24 h to remove the monitor and perform a spirometry test. Monitors registered individual PM10 exposures every 5 min during 24 h and pulmonary function outcomes were measured at the end of the monitoring. Both the 24-h monitoring of personal-PM10 and spirometry test were done only once for each subject. Some subjects were monitored from February to May 2012, and others were monitored from August to October 2012.
Study location and population
Mexicali is the capital of the Mexican state of Baja California, located on the northwestern border with the USA state of California. This medium sized city is located in a semi-arid region and has very high concentrations of air pollution, mainly by PM10 from anthropogenic and natural sources (Reyna et al. 2012). There are large areas of farmland on both sides of the border, where agricultural residues are burned along with continuous discharges of pesticides and fertilizers.
The city has one geothermal power plant and two combined cycle thermoelectric power plants. Most of the vehicle fleet is old and there is no proper program for the inspection of vehicle emissions. The paved roads are not maintained and the outskirts of the city lack paved routes. There are also large areas of cattle feedlots and many industries. The meteorological and semi-desert characteristics of the region also contribute significantly to PM re-suspension from the soil (Reyna et al. 2012).
Figure 1 shows the historical annual averages of PM10 from Mexicali (1998-2009). Averages are permanently higher than those established by the Mexican air quality standards (SSA 2014), i.e., annual average (40 µg/m3) and 24-h average (75 µg/m3). PM10 data is shown up until 2009 because the fixed-site monitoring station network of Mexicali ceased operations in 2010; although two new fixed stations are currently being installed.

The study involved healthy individuals of both genders between 20 to 55 years of age, who studied and/or worked in the central campus of the Autonomous University of Baja California (UABC) and were residents of the municipality of Mexicali. The Ethics Committee of the Faculty of Medicine from UABC reviewed and approved this project. The recruitment of subjects was carried out by three undergraduates that were previously trained as pollsters. The pollsters roamed over the course of the day both the Engineering School and the Engineering Institute of the UABC, surveying potential volunteers who met the initial criteria. To identify healthy individuals, 500 invited potential participants responded to the British Medical Research Council (1996) Standardized Questionnaire for Respiratory Symptoms (Ferris 1978) supported by the American Thoracic Society (ATS 1995). An informed consent was obtained from all respondents.
Of the total respondents, 140 individuals met the selection criteria, meaning that they were identified as having no history of previous or current cardiorespiratory diseases, a negative history of smoking, and no physical disabilities that hindered their performance of normal daily activity and/or influenced the results of the study variables. The information declared by the respondents was analyzed and validated by an MD, PhD medical specialist in allergy with a great experience in spirometry. It was not possible to identify and exclude subjects who lived with smokers, since the ATS-DLD-78-A questionnaire used in the study does not consider this question in adults.
Environmental data
Subjects were instructed on the use of the Personal DataRAM Aerosol Dust Monitor (model pDR-1500 from Thermo Fisher Scientific, Inc.) which they wore for 24 h; it registered the time of the day, PM10, ambient temperature (Temp), and relative humidity (RH), at 5 min intervals. The subjects did not bathe during the 24 h of sampling and when they went to sleep they placed the pDRs as close as possible to their heads, not more than 30 cm away.
The pDR-1500 is a nephelometer with a LED light-source having a wavelength of 880 nm, which measures the PM light scatter relating it to mass concentration with an aerodynamic particle cut-point range of 1.0 to 10 μm. The device has been tested by the National Institute for Occupational Safety and Health (NIOSH), obtaining results comparable to the measurements from other light-scattering dust monitors (Reed et al. 2013). It weighs 1.2 kg (including batteries) and its dimensions are 181 mm × 143 mm × 84 mm.
Before starting the project, all pDRs were calibrated by the manufacturer against a traceable gravimetric standard from the National Institute of Standards and Testing (NIST). The test dust used in the factory is SAE Fine (ISO Fine), supplied by Powder Technology, Inc. (mass median aerodynamic diameter: 2 to 3 µm; geometric standard deviation of lognormal size distribution: 2.5; bulk density: 2.60 to 2.65 g/cm3; refractive index: 1.54). The optical monitoring system of the pDR-1500 allows the monitoring of PM in real time. The light scattering that the particulates produce when they are being monitored, permits to measure indirectly the concentration of total mass in µg/m3 of air. Normally, these instruments produce estimations of mass less accurate than the Federal Reference Methods (FRM) systems (USEPA 1999), because the accuracy of the optical lectures depends to a certain degree on the density of the monitored particulate.
Besides the mass calibration, the manufacturer also calibrated for temperature, relative humidity, barometric pressure, and volumetric flow rate using NIST traceable standards. The pDRs were programmed (i.e., configured) enabling the option of correction per RH, allowing normalization of the response to 40 % of RH when this percentage was exceeded. The equipment was operated with the ACGIH-traceable cyclone (GK 2.05 cyclone red) to measure PM10 at an airflow rate of 1.19 L/min. Before starting a measurement, the instruments were zeroed for establishing the optical signal offset adjustment, following the user’s manual.
To stabilize the equipment, the pDRs were put to work 20 min before being worn by the subjects. The PM10 sampling began around 09:00 LT and ended around 09:00 LT the next day; however, most of the time the monitors ran out of power some minutes before completing 24 h of sampling, so it was decided to work only with the first 23 h (i.e., from around 09:00 LT till around 08:00 LT).
Spirometry data
The spirometry test was performed to measure FEV1 and FVC (both in liters and as a percent predicted), and to calculate the FEV1/FVC ratio. The spirometry test was assessed with a computerized pneumotachometer Multispiro SX/PC (Multispiro, Inc.), which was calibrated before starting each spirometry by means of the Hans Rudolph 3-Liter Calibration Syringe, manufactured and tested to meet recommended ATS standards (ATS 1995). The spirometry maneuvers were performed by a trained allergist at a nursing room on the central campus of the UABC, also following ATS recommendations.
After reviewing the PM10 time-series for gaps, spirometry acceptability, and reproducibility, the final sample size reached n = 97. In general terms, reproducibility is reached under the following ATS criteria (Hankinson and Bang 1991, Miller et al. 2005): from three different maneuvers technically satisfactory, register the largest values of FVC and FEV1.
The back-extrapolated volume must not be greater than or equal to 150 mL, or greater than or equal to 5 % of the FVC, whichever is the greatest. The differences between the registered values of FEV1 and FVC and the following largest values registered from FEV1 and FVC must not be greater than the 150 mL, respectively. If the registered value of FVC is less than or equal to 1.0 L, then the differences must not be greater than 100 mL.
Statistical analysis
The outcomes (i.e., FEV1, FVC, and FEV1/FVC) were analyzed for correlations with Temp, RH, and personal-PM10 concentrations; and the distribution of the pulmonary function outcomes were examined for normality (Shapiro-Wilk test).
Untransformed PM10, log10-transformed PM10, Temp, and RH were categorized into distinct non-overlapping average periods over the 23 h of sampling (i.e., none of the values used in an averaging period were included in the averaging of the next period). The first 1-h average before the spirometry was termed lag1, the second one was termed lag2 and so on. The association of each PM10 average and their lags with the outcomes: FEV1 in liters, FVC in liters, FEV1 percent predicted, FVC percent predicted, and FEV1/FVC ratio, were analyzed using multiple linear regression (Hidalgo and Goodman 2013) with correction of serial autocorrelation.
The study explores the relationship between a covariate variables set (i.e., time, meteorological, demographic, somatometric and air pollutants) and spirometry tests outcomes as the dependent variables.
Separate baseline models for FEV1 in liters, FVC in liters, FEV1 percent predicted, FVC percent predicted, and FEV1/FVC ratio, were built with independent variables not caused by air pollution. Gender, age, height, weight, body mass index (BMI), square of age, height and weight, meteorology (i.e., Temp, RH, and square of Temp and RH) and their 1-23 lags (i.e., the 23 1-h averages) were tested as confounding variables. Day of the week and month of the year were tested as indicator variables for controlling changes in time. On the baseline models, untransformed PM10, log10-transformed PM10, and their 1-23 lags were tested individually. In addition to 1-h averages studied, impacts over longer averages (i.e., 4, 8, 16, and 23 h) were also investigated. To control the possible underlying autocorrelation structure in the pollution levels, model specification was determined using multiple regression with serial correlation with the NCSS9® software (NCSS 2013). This routine utilizes the Cochrane-Orcutt procedure to estimate the autoregressive error model (Neter et al. 1996). It was assumed that the built models were adequate if the partial autocorrelation coefficients of the residuals did not exceed the confidence limits (α = 0.05) and showed normality (Shapiro-Wilk test). The multicollinearity between independent variables in the models was controlled by the variance inflation factor (VIF), and only variables with a VIF < 5 were included in the specifications of the models.
RESULTS
The average age in years was 33.8 ± 11.9 for men (n = 51) and 28.9 ± 10.5 for women (n = 46). The average weight was 80.3 ± 13.4 kg, with an average height of 171.9 ± 6.9 cm for men, and an average weight of 65.0 ± 14.0 kg, with an average height of 160.2 ± 5.3 cm for women. The overall average BMI was 25.3 ± 5.1 and 27.2 ± 4.1 for men and women, respectively. Overweight subjects (i.e., 25 ≤ BMI < 30) represented a 39.2 % of the study population, men (n = 11) had an average BMI of 27.5 ± 1.5 and women (n = 27) of 27.5 ± 1.7. Obese subjects (i.e., BMI ≥ 30) were 17.5 % of the study population with an average BMI for men (n = 9) of 33.4 ± 2.2 and 34.2 ± 2.6 for women (n = 8). Descriptive statistics of the studied variables are shown in table I. During the study period temperature was stable and relative humidity and PM10 did show important variations. Absolute and percent predicted averaged values of the spirometry tests were normal. No subject showed an FEV1/FVC ratio lower than 0.70, which means they had no pathological airflow obstruction.
TABLE I SUMMARY STATISTICS OF OUTCOMES AND INDEPENDENT VARIABLES OF THE WHOLE POPULATION FOR THE SAMPLED PERIODS (FEBRUARY-MAY 2012 OR AUGUST-OCTOBER 2012)
| Variable | Min | Max | Percentiles | IQR | |||||
| Mean (SD) | 10 % | 25 % | 50 % | 75 % | 90 % | ||||
| Demography | |||||||||
| Age (yr) | 20 | 55 | 31.5 (11.5) | 21 | 21 | 26 | 41 | 51 | 20 |
| Somatometry | |||||||||
| Weight (kg) | 44.0 | 116.5 | 73.1 (15.7) | 53.84 | 61 | 71.7 | 82.55 | 97.32 | 21.6 |
| Height (cm) | 151 | 190 | 166.3 (8.5) | 155.8 | 159 | 165 | 172.5 | 178 | 13.5 |
| BMIa | 17.40 | 39.38 | 26.29 (4.65) | 19.77 | 23.19 | 25.34 | 29.11 | 32.73 | 5.93 |
| Spirometry Absolute values (L) | |||||||||
| FEV 1b | 2.24 | 5.56 | 3.60 (0.74) | 2.67 | 3.10 | 3.46 | 4.09 | 4.60 | 1.01 |
| FVCc | 2.58 | 6.57 | 4.30 (0.90) | 3.20 | 3.58 | 4.13 | 4.94 | 5.53 | 1.38 |
| Ratio | |||||||||
| FEV1/FVC | 0.71 | 0.975 | 0.842 (0.053) | 0.78 | 0.812 | 0.841 | 0.871 | 0.912 | 0.061 |
| Percent predicted (%) | |||||||||
| FEV1 | 75 | 128 | 96 (11) | 82 | 88 | 96 | 105 | 113 | 16 |
| FVC | 73 | 124 | 96 (11) | 83 | 88 | 95 | 102 | 110 | 14 |
| Meteorology | |||||||||
| Tempd | 21.3 | 30.7 | 25.3 (2.1) | 22.6 | 23.5 | 25.2 | 26.9 | 28.1 | 3.4 |
| RHe | 18.1 | 57.0 | 34.8 (8.9) | 23.4 | 26.6 | 35.0 | 42.4 | 47.0 | 15.7 |
| Pollutant | |||||||||
| PM10 f | 5.8 | 134.0 | 31.4 (25.1) | 10.2 | 14.0 | 23.1 | 40.2 | 66.5 | 26.2 |
a Body mass index in kg/m²; bforced expiratory volume at 1 s; cforced vital capacity; dtemperature in ºC; erelative humidity in %; fparticulate matter ≤ 10 µm in aerodynamic diameter in µg/m3
The PM10 23-h averages showed low Spearman correlation with Temp 23-h averages (rho = -0.22, p = 0.03) and RH 23-h averages (rho = -0.29, p = 0.004).
Figure 2a shows the time-series of the personal-PM10 1-h averages monitored by the pDRs, and figure 2b shows the individuals’ PM10 variability (average and 95 % confidence limits) during the same period. The vertical numbering on the left in figure 2a represents the lags (i.e., 2 to 24 h before the spirometry test) and the horizontal numbering represents the monitored subject (i.e., 1-97). On the horizontal axis, solid and dashed lines indicate the month in which the monitoring was carried out; for example, monitoring of subjects 1 to 19 took place during February, and figure 2b shows that PM10 average concentration and variability are higher between February and April and lower in May. Although three subjects (triplets) were monitored simultaneously per day, after the debugging of the database some samples were not included in the study ending with only three complete triplets; 29 lost one individual, and the rest lost two individuals. The symbol└┘ used in figure 2a under the individual’s number indicates those that were monitored on the same day; for example, subjects 1 and 2 were monitored on the same day in February and subjects 76, 77, and 78 were monitored on the same day in September. We used Spearman correlation to explore correlations between subjects monitored on the same day. In total, only 11 time-series showed autocorrelation (*p < 0.05).
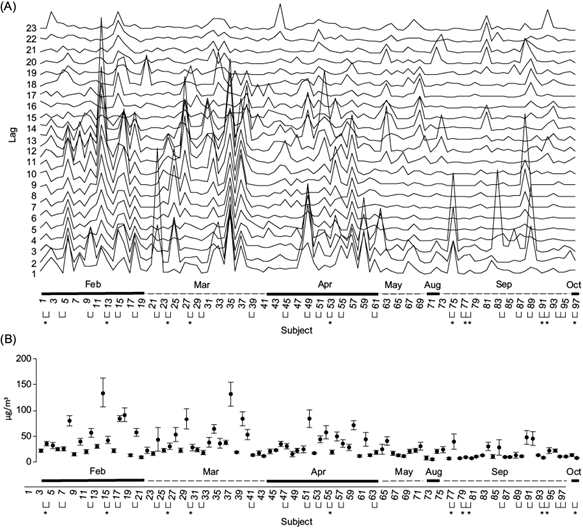
Fig. 2 (a) Time-series of the personal-PM10 1-h averages monitored by the pDRs. (b) PM10 variability (average and 95 % confidence limits) between time-series (i.e., subjects)
Figure 3 shows monthly averages of the personal PM10 1-h averages and the monthly 98th percentiles of the personal PM10 1-h averages that the pDRs recorded during the monitoring periods. The personal PM10 levels declined in time with a peak in September. This behavior follows the monthly averages of the historical time-series (2000-2009) of the Mexicali’s PM10 registered by fixed-site stations which was reported by the Instituto Nacional de Ecología y Cambio Climático (National Institute of Ecology and Climate Change, INECC) (INECC/SEMARNAT 2011).
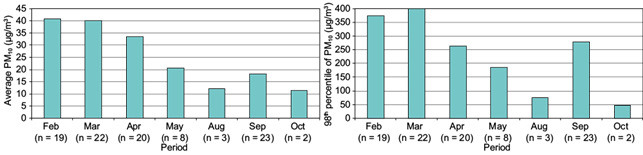
Fig. 3 Monthly averages and 98th percentiles of the personal PM10 1-h averages that the pDRs recorded during the monitoring periods
The best baseline model for FEV1 was observed for FEV1 in liters, adjusting by age-squared, height-squared, and the indicator gender. For FVC, the best baseline model was also observed for FVC in liters, adjusting by age-squared, height-squared, and the indicator gender. No good baseline model was found for FEV1/FVC ratio. Neither Temp nor RH showed statistical significance in any of the models.
On the baseline models, the cumulative effects of PM10 were measured at 1-h averages, which were tested individually (i.e., lags 1 to 23). The cumulative effects of PM10 for longer averages (i.e., 4, 8, 16 and 23 h) were tested also one by one, but did not present important associations with outcomes. The FVC in absolute or percent predicted values did not show statistically significant associations with the untransformed nor log10-transformed PM10. FEV1 in absolute values showed statistically significant associations with the untransformed and log10-transformed PM10. Therefore, the discussion will be focused only for FEV1 results. The best FEV1 models were determined by the 1-h averaged period untransformed and log10-transformed PM10 for the lag16, which had a very similar adjusted R 2 (Table II).
TABLE II SUMMARY STATISTICS OF THE MULTIPLE LINEAR AND LINEAR-LOG REGRESSION ANALYSIS FOR FEV1
| b (95 % CI) | SE | p-Value | Adjusted-R 2 | |
| FEV1 (1) | 0.6212 | |||
| PM10 lag16 + (1) | -0.0042 (-0.0102, 0.0019) | 0.0030 | 0.1740 | 0.6248 |
| Log10 (PM10) lag16+ (1) | -0.1465 (-0.3989, 0.1059) | 0.1271 | 0.2521 | 0.6225 |
| FEV1 (2) | 0.7202 | |||
| PM10 lag16 + (2) | -0.0056 (-0.0108, -0.0005) | 0.0026 | 0.0326 | 0.7311 |
| Log10 (PM10) lag16 + (2) | -0.2635 (-0.4790, -0.0480) | 0.1085 | 0.0171 | 0.7343 |
| FEV1/FVC ratio (3) | 0.2467 | |||
| PM10 lag16 + (3) | -0.0005 (-0.0011, 0.0002) | 0.0003 | 0.1519 | 0.2607 |
| Log10 (PM10) lag16 + (3) | -0.0268 (-0.0520, -0.0016) | 0.0127 | 0.0372 | 0.2874 |
| FEV1 percent predicted (4) | 0.1084 | |||
| PM10 lag16 + (4) | -0.1399 (-0.2783, -0.0015) | 0.0697 | 0.0477 | 0.1359 |
| Log10 (PM10) lag16 + (4) | -6.9234 (-12.6380, -1.2089) | 2.8773 | 0.0181 | 0.1511 |
Note: FEV1 in liters unless otherwise specified. Most significant regression coefficients (i.e., b) were determined when lag16 of untransformed and log10-transformed PM10 was tested in the FEV1 baseline model adjusted by age2, height2, and gender. Other models are presented just for comparison of the goodness-of-fit (i.e., adjusted-R 2 )
CI: Confidence intervals; (1) adjusted for age2 and height2; (2) adjusted for gender (female = 1, male = 0) + (1); (3) adjusted for February, September and age; (4) adjusted for Tuesday and age
Age and/or height and/or PM10 levels may be modifying gender differences, in addition to the different effect that age or height or PM10 may be exerting on FEV1 in each gender (Table III). For purposes of evaluating this, gender interactions with the confounding variables (i.e., gender*age and gender*height) and with the pollutant (i.e., gender*PM10, gender*age*PM10) were assessed in the models, which did not show statistically significant effects. This means that neither age, height, nor PM10, modified gender differences. This also means that the effect of the confounding variables (i.e., age, height) and the effect of the explanatory variable (i.e., PM10) on FEV1 are not different in either sex. On the baseline and significant models (i.e., untransformed and log10-transformed PM10 lag16), Shapiro-Wilk test could not reject the normality of residuals at a significance level of 5 % (i.e., W = 0.98, p = 0.19; W = 0.98, p = 0.19; and W = 0.98, p = 0.20), respectively.
TABLE III REGRESSION COEFFICIENTS FOR THE BASELINE MODEL AND THE TWO SIGNIFICANT FEV1 MODELS
| Independent variable | Baseline model regression coefficients (95% CI) | Regression coefficients (95 % CI) when lag16 of PM10 a was tested | Regression coefficients (95 % CI) when lag16 of PM10 b was tested |
| Intercept | 1.2519 (0.0001, 2.5037) | 1.5324 (0.2784, 2.7864) | 1.8200 (0.5144, 3.1256) |
| Genderc | -0.6909 (-0.9272, -0.4547) | -0.7139 (-0.9465, -0.4813) | -0.7394 (-0.9730, -0.5057) |
| Age-squared | -0.0003 (-0.0004, -0.0002) | -0.0003 (-0.0004, -0.0002) | -0.0003 (-0.0004, -0.0002) |
| Height-squared | 0.0001 (0.0001, 0.0001) | 0.0001 (0.0001, 0.0001) | 0.0001 (0.0001, 0.0001) |
| PM10 | NA | -0.0056 (-0.0108, -0.0005)d | -0.2635 (-0.4790, -0.0480)e |
a Untransformed PM10; bLog10-transformed PM10; cgender = 1 for female, 0 for male; d p-value = 0.0326; e p-value = 0.0171; NA: not applicable
Table IV shows the association of FEV1 with the most significant coefficient (i.e., lag16) of the untransformed and log10-transformed personal PM10. Models were evaluated for 10 µg/m3 of PM10 in air and 44 % increment in PM10, respectively. For the evaluation of the linear-log model, the 44 % increase was calculated by taking as the baseline the overall median concentration of personal PM10 (i.e., 23 µg/m3), then 44 % of that median level would represent around 10 µg/m3 of PM10 in air.
TABLE IV SUMMARY STATISTICS OF THE FEV1 AVERAGE CHANGES PER CHANGE IN PM10. THE LINEAR AND LINEAR-LOG REGRESSION COEFFICIENTS (b) OF THE MOST SIGNIFICANT LAG TIME (i.e., Lag16) WERE USED TO COMPUTE THE FEV1 AVERAGE CHANGES IN MILLILITERS (mL) PER INCREMENT IN PERSONAL-PM10 FOR THE PERIOD SAMPLED. PM10 IN µg/m3 UNLESS OTHERWISE SPECIFIED
| Var | b (95 % CI) | PM10 increment | FEV1 change (95 % CI) | p-values |
| PM10 a | -0.0056 (-0.0108, -0.0005) | 10 | -56.0 (-107.0, -5.0) | 0.0326 |
| PM10 b | -0.2635 (-0.4790, -0.0480) | 44 % | -50.0 (-92.0, -9.0) | 0.0171 |
a Untransformed; bLog10-transformed
Evaluation of the linear and linear-log regression models in this analysis indicates that the decline in lung function (i.e., FEV1) of the study subjects is related with personal PM10. This decline is observed particularly at the lag16 of exposure; for each 10 µg/m3 or each 44 % rise in PM10 (Table IV), there will be an FEV1 decrement of -56.0 mL (95 % CI: -107.0 mL, -5.0 mL) or -50.0 mL (95 % CI: -92.0 mL, -9.0 mL), depending on the model used (i.e., linear or linear-log).
DISCUSSION
Personal PM10 monitoring offers a better alternative in the study of the immediate effects of PM10, since being closer to individuals; these personal instruments achieve a much higher temporal and spatial pollutant sampling resolution. This is the case of the current study, where we could demonstrate important decrements in FEV1 (and sometimes a significant airflow obstruction) resulting from exposure to PM10 that was inhaled during specific periods in the previous hours. The effects were observed independently of gender, age, and height, associated with 1-h average PM10 concentrations occurring 17 h prior (i.e., lag16) to the pulmonary function testing. The study indicates that this pollutant induces an important decrease in pulmonary function in a group of healthy adults when exposed to PM10 17 h prior.
The study was conducted in a sample of healthy adults that, in theory, should not be especially vulnerable to PM10 exposure. It is also important to note that PM10 monitoring and the FEV1 measurements of this study were conducted during the months of February through April, a period in which PM10 concentrations are high but not the highest normally observed during the year in Mexicali. The highest PM10 levels are reached between November and January, and we could expect that the pulmonary function of these healthy adults could decrease even more during those months. It is also worth considering that if PM10 affects the FEV1 of healthy individuals, other more vulnerable individuals (i.e., children, the elderly and patients with COPD or asthma) would suffer much larger declines in FEV1. This has been demonstrated by others also working with personal monitors, at similar or lower PM10 concentrations (Delfino et al. 2004). In Mexicali, the annual rate of visits to emergency rooms per 100 000 inhabitants due to asthma is estimated to be about 341; and the hospitalization rate for every 100 000 inhabitants is estimated to be about 97 (Reyna et al. 2017). Prevalence rate of asthma (2004-2007) was estimated to be at 2 % (Torillo Portilla 2008). In 2013, 88 628 acute respiratory infections were registered (source: Secretaría de Salud del Estado de Baja California) and the population was 936 826 inhabitants (Source: Instituto Nacional de Estadística y Geografía), so the prevalence rate for the year 2013 can be estimated to be 9.5 % (personal communication). Using personal monitoring could complement these studies based on data from fixed-site monitoring stations to show that PM causes inflammation of the airways of healthy people (Gong et al. 2003, Schaumann et al. 2004).
Previous findings about the chemistry of particulate-matter in Mexicali showed an important role in inflammatory processes that could be relevant in explaining the impact of PM10 on the airways as reported in the current paper (Osornio-Vargas et al. 2011).
In Mexicali, in addition to the source of PM10 from human activities, soil re-suspension adds to the complexity of the local PM10. Soil re-suspension is caused, in part due to vehicular flow over unpaved roads, but mainly due to the wind, as the city is geographically located in a desert area known as the Great Sonoran Desert. The PM10 burden that the semi-arid soil adds to the city pollution and the results reported here of assessing its impact on the pulmonary function of healthy subjects, could portray expected conditions around the world as a result of desertification related to climate change.
Study limitations
It would be important to estimate the effects of PM10 using personal monitoring on the pulmonary function of more sensitive groups as compared to the effects on the pulmonary function of healthy people. It is necessary to conduct a larger scale study in the future, increasing the sample size, the repeats of the measurement of the response variable (Spirometry tests), and a greater number of monitoring days. This will create the opportunity to test if the intra-subject spirometry variations could affect the correlation between the pulmonary function and exposure to PM10.
As mentioned in the subsection Environmental data, nephelometric equipment, such as the pDR-1500 used in this study, produce a less accurate mass estimation of PM10 than the FRM systems (USEPA 1999), mainly because the accuracy of optical lectures depends on the monitored particulate density. To improve the accuracy of estimations, pDRs are gravimetrically calibrated by the manufacturer with a correction factor of 1.00, which scales the optical lectures so the estimated mass of PM in µg/m3 of air matches as much as possible with the primary calibration (i.e., ISO Fine). In the current study the inaccuracies that pDRs can produce must be considered. For example, the density of the Mexicali’s PM could differ in respect to the density of the PM used by the ISO Fine (i.e., calibration by the manufacturer), or the density of the PM could vary depending on the microenvironments through which the subjects wearing the DataRAM move. What is commonly done in these circumstances to improve the accuracy of the lectures on the DataRAMs, is to co-locate the devices as close as possible to a fixed FRM or Federal Equivalent Methods (FEM) (USEPA 1999) environmental monitoring station and monitor in parallel for a period of time. The mass concentrations registered by the FRM or FEM systems are divided by the mass concentrations registered by the DataRAM to estimate a ratio. This result practical when DataRAMs are utilized either as fixed monitors or as mobile monitors following a previously known monitoring route, allowing comparability of results with nearby stations encountered in the track.
In the current study we need to consider limitations since the pDRs were not used as fixed-site monitors, the subjects wearing the equipment move randomly through different places of the city, and the city had no active fixed-site environmental monitoring stations during the study period. In order to explore for trend consistency we compared personal PM10 data with the monthly historical series (2000-2009) of the Mexicali’s fixed-site PM10 levels. Although it was not possible to obtain a ratio (i.e., correction factor) for the conditions of the city’s PM10, we consider it does not influence the estimation of the regression coefficients, since the logarithmic transformations allow modeling relationships in terms of relative values (i.e., percentages), unlike the linear models where the relationships are modeled in terms of absolute values. That is, in linear-log modeling (i.e., level-log regression), the regression coefficient associated to the log-transformed regressor variable (PM10 in the current study) is not altered when scaled; unlike in linear modeling (i.e., level-level regression), where the regression coefficient associated to the regressor variable is affected.
Other important aspect to consider is the possible effect of body mass on respiratory function (Guerra et al. 2002, Salome et al. 2010, Yeh et al. 2011). The associations of altered spirometric variables with BMI normally appear when body mass becomes significant (BMI ≥ 30) or the distribution of the body mass is also altered (Attaur-Rasool y Shirwany 2012). However, it has been observed that measures of forced spirometry in overweight subjects (25 ≤ BMI < 30) with no associated disease in progress, is usually normal (Lazarus et al. 1997). Despite those reported alteration in obese individuals, the small proportion of subjects presenting obesity (none with severe obesity) in our study, showed values (mean ± SD) of respiratory function in the range of normality: 97 ± 10 %, 95 ± 10 %, 0.84 ± 0.04 for FEV1, FVC and FEV1/FVC, respectively. Similar values were observed in the overweight subjects: 99 ± 11 %, 98 ± 11 %, 0.83 ± 0.04 for FEV1, FVC and FEV1/FVC, respectively; and those with normal weight: 95 ± 12 %, 93 ± 11 %, 0.85 ± 0.06 for FEV1, FVC and FEV1/FVC, respectively. In addition, both weight and BMI were analyzed as control variables and even as confounding variables, but neither of them presented statistically significant effects on the respiratory function variables analyzed. More studies of this type must be carried out, where larger samples are analyzed in the three weight categories, to observe if body mass such as BMI or waist circumference have important associations with respiratory function, and comparing them with associations of measured PM with personal environmental monitors.
It is also important to have a network of fixed-site air quality monitoring stations in the city, which allows identification of the correlation between PM concentrations measured by this network and those obtained by personalized sampling. This would allow comparison between risk estimates using PM measurements from the fixed-site stations and PM data from personal monitoring.
Another important issue that requires further analysis is the evaluation of the impact on human health of PM toxic effects, related to its concentration and physicochemical characteristics (i.e., speciation). In vitro assays can be performed to measure apoptosis or genotoxicity that occurs at various concentrations of PM and during different periods of exposure, with the purpose of assessing the cell membrane and DNA damage caused by the PM captured by fixed-site stations, and damage caused by the PM captured by personal environmental monitors. This is very important, since in Mexicali the rate of incidence and mortality by respiratory-tract cancer is above the state average and the national average (source: Secretaría de Salud).
CONCLUSIONS
Personal PM10 exposure was associated with small but significant decreases in FEV1 (about 50 mL decrease in FEV1 for an increment of 10 µg/m3 of PM10) in subjects from Mexicali. Personal PM10 caused a delayed observed decrease of the respiratory function (around 17 h later) in the studied healthy adult people. Further studies are required to assess if the effects identified in healthy individuals in this study regarding personal exposure to PM10 in Mexicali, represent a risk for developing future respiratory diseases.

