


 nueva página del texto (beta)
 Inglés (pdf)
 Artículo en XML
 Referencias del artículo
 Enviar artículo por email
 Citado por SciELO
  Similares en
SciELO
Similares en
SciELO 
 Permalink
INTRODUCTION
Brazil is one of the largest tourist markets in the world, and the World Travel and Tourism Council (WTTC 2015) estimated that in 2014 over 6 million international tourists visited the country. According to a survey conducted by Moscardo et al. (2009), considering different types of tourists, different environmental impacts can be generated, both positive and negative, which depend on distinct habits and the modes of transportation used.
Undoubtedly, the hotel business is closely associated with social, economic, and ecological issues of the country where the hotels are located, which significantly contributes to local and regional development. However, they may also seriously affect the environmental quality, primarily the natural resource consumption, waste generation, water use, and environmental pollution (Melissen 2013).
Generally, the transportation and displacement modes, energy spent by habitation units, and solid waste generated in convention activities are among the major tourism activities that greatly impact the environment (Park and Boo 2010). From this perspective, in the convention and event activities, a large number of people can meet in the same sector, usually for a short period of time, which can lead to a great visibility with regard to the environmental impact. For that reason, they are becoming important considerations of environmental sustainable strategies in planning successful events (Boo and Park 2013). Ma et al. (2011) emphasize that when planning a large event a holistic approach is recommended, where several sustainable issues are to be addressed, including waste management, which is an important contribution to an efficient environmental management.
According to Radwan et al. (2010), hotels contribute to environmental degradation worldwide by the disposal of thousands of tons of waste in landfills. The constituents thus generated represent a high diversity and may have excessive volume. These materials often contain heavy metals and toxic organic compounds that, when untreated, can cause the wastage of materials and soil, water and air pollution (Buyukipekci 2014). It should be noted that landfills must fulfill a number of requirements, such as topographic, hydrological, social, and economic, which involve operational, technical, and financial investments (Eskandari et al. 2012). Despite fulfilling these requirements regarding environmental control and prevention, the performance of these sites has been impaired due to the exacerbated supply of waste received daily, leading to a reduction in the lifespan of expensive engineering works.
Public policies have been developed and improved in national and international scenarios, as well as economical instruments, that aim to control waste and generated substances, including the usable by-products in the production chain (MMA 2010, Rickera et al. 2013, Park et al. 2014). With this objective, local governments should financially encourage the hotel sector and provide more effective and cheaper waste recovery services than the disposal in landfills, aiming at the reduction, reuse, and recycling of wastes (Radwan et al. 2012).
Nowadays, many hotel chains are making efforts to promote their environmental commitment in order to differentiate from their competitors (Park et al. 2014). Han et al. (2011) claim that companies are increasingly concerned about the environmental impacts arising from their activities, which cause hotels to invest in environmental practices that affect guest’s preferences. Therefore, in hotels that look for this type of customers, innovative forms of general environmental management should be developed in order to inculcate in customers the feeling that they are paying a fair and justified price for the implementation of environmental practices (Kim and Han 2010).
As discussed above, the management should look for reducing the costs and enabling the use of recyclables in order to reduce the generation of residual materials. Thus, the solid waste management in lodgings can improve environmental health, resource shortages, and social inequalities (Moliner et al. 2012). Jones et al. (2014) complement that solid waste management is one of the factors that contribute to sustain the hotel industry and, in general, benefits customers and society besides owners and suppliers.
However, considering the demands involved in the administration and lodging management, are there any other plans than the existing daily activities of establishments to properly manage the amount of waste generated by event services? What kind of wastes are being generated by this activity in the lodging? The knowledge of the generation sources, the waste classes, the nature of events, and the management conditions can be important factors to answer these questions and to assist in the management of solid waste in hotels.
Considering the environmental responsibility of lodgings, the development of environmental plans, environmental audits, and the creation of a plan for implementation and/or improvement of an environmental management system associated with the aspects and impacts caused by the enterprise should be encouraged (Radwan et al. 2012). To follow the guidelines and recommendations of the waste management described by ISO 14.001 (2004), the design of a waste management plan must be conformed by the peculiarities inherent to the generation sources of the waste, characteristics of the disposal such as the frequency, the quantity, and the types of materials (Vega et al. 2008, Murphy and Pincelt 2013).
Thus, estimating the quantity and types of the generated materials is essential to support the planning of a solid waste management program (Saldaña et al. 2013). In addition, the importance of the characterization of solid waste generated in lodgings focusing on the occurrence of events, and the lack of studies on this matter, suggest the need to investigate the composition of solid waste. Because of the several factors that influence solid waste generation, the aims of this work were to characterize the solid waste generated in different sectors of a hotel in a qualitative and quantitative way, and to compare the generation of wastes in the enterprise according to the different types of events organized.
MATERIALS AND METHODS
The investigation was conducted in southern Brazil (31º46’19’’S; 52º20’33’’W) in a medium-sized lodging site with 74 housing units (6800 m2 approximately). The services provided are: living rooms, breakfast, garage, laundry, maintenance, messengers, office, swimming pool, rooms adapted for people with special needs, reservations, gym room, convention rooms, ballroom, and steam room.
The primary reason for the lodging in the establishment is business and commercial tourism, but clients are also attracted by leisure tourism and historical culture of the region.
Waste characterization
The data collection method applied was the quantitative and qualitative waste characterization, which was performed through identification of fractions that compose the sample and quantify the materials in relation to their weights (al-Jarallah and Aleisa 2014).
The wastes collected for evaluation were generated for three days, i.e., the time the wastes were stored until the collection by the municipal public service. Monthly characterizations were performed for nine months and the following parameters were evaluated: number of employees, number of guests, number of people in events, types of festive events (birthdays and graduations) and types of business events (divulgation of commercial products, business meetings, and conferences). Three characterizations were also evaluated without event occurrence for control effect.
The waste generation sectors were identified through direct observation and interviews (Flick 2009) with people responsible for cleaning. To identify the waste generation sources, the staff responsible for the cleaning service at the hotel was directed to identify the bags during the internal collection step with the corresponding generation sector. For the determination of waste composition, all bags stored were opened in plastic canvas and their various components were grouped and weighed individually by category and sector.
The wastes generated in the establishment were grouped according to the event, where the experimental design for gravimetric compositions was completely randomized with three replications, i.e., following a one-factor scheme with three types of events: festive events (FE), business events (BE), and no occurrence of events (NE). The response variables were types of wastes generated, e.g., putrescible organic matter (POM), biological contaminant (BC), glass, plastic, paper and cardboard (PC), miscellaneous, mixed, and cloths, rags, leather, and rubber (CRLR), metal and chemical contaminants (CC), were grouped according to their recycling potential. The categories of POM, plastic, PC, metal, and glass are considered with a high recycling potential (HRP). The categories of BC, CC, CRLR, mixed, and miscellaneous are considered with a low recycling potential (LRP).
Statistical analysis
The normality of the data collected was analyzed with the Shapiro-Wilk test, the homoscedasticity with the Hartley test, and the residue independence with graphical analyses. Given these assumptions, data were presented for the analysis of variance (p < 0.05). Observing a statistical significance, the treatment effects on the response variables were evaluated by the Tukey test and the t-test (p < 0.05), with three or less treatment factors. In cases where the assumptions of normality were not satisfied, the Friedman analysis of variance was applied and the paired Wilcoxon test of signalized position was applied to evaluate the effect between factors (p < 0.05).
The data groups evaluated by parametric analysis were those related to waste categories in the observation of different types of events (FE, BE, and NE), as well as those related to the characterization of each generation sector according to the types of events (FE and BE). In this work, a p-value below 0.05 was considered significant.
Per capita generation
Considering the number of guests for three days, including people in events and the waste generation in the corresponding period, the per capita generation, as well as the per capita generation of waste with HRP and LRP, were calculated. In addition, the per capita generation of people in the ballroom was also estimated, considering only the waste generated in this sector.
RESULTS
As shown in table I, it is possible to determine 14 sectors where wastes are generated in the lodging. People in events, including guests and visitors, occupied the ballroom and bathrooms located in the reception, corridors, convention hall and the hotel ballroom. Employees exclusively occupied the sectors of warehouse, laundry room, maintenance, and clothing, while the other sectors were used by both guests and employees.
TABLE I MAIN SECTORS AND SERVICES OFFERED IN THE LODGING
| Sector | Service offered |
| Administration | Control of guests number, accounting and other administrative services |
| Warehouse | Inventory of products offered to guests |
| Bathroom | Bathrooms of the reception, clothing and corridors |
| Events’ bathrooms | Located in the convention hall and the hotel ballroom |
| Room’s bathrooms | Guests use |
| Kitchen | Breakfast preparation, guest requests and party buffets |
| Ballroom | Hall for celebratory events, conferences, meetings and other events |
| Hall/reception | Check-in/out of guests, requests, visitors waiting |
| Laundry room | Cleaning of bedding, bath and table |
| Maintenance | Maintaining the functioning of the various services offered |
| Rooms | Air conditioning, TV, safe box, internet and other facilities |
| Dining hall | Breakfast consumption |
| Clothing | Employer’s use |
| Pool/gym | Entertainment area/exercise |
Based on 10 categories, the classification of compounds was made according to the waste presence mentioned in table II.
TABLE II CATEGORIES OF SOLID WASTE IN THE LODGING
| Category | Waste presence |
| Putrescent organic matter | Food remains from animal and vegetal origin (fruit peel, yerba mate, food preparation), pruning trees, flowers, leaves and grass |
| Plastic | Bottles, bags, food packaging, plastic cups, Styrofoam, sponges, cosmetic packaging, non-toxic cleaning products, packaging, crates, hangers |
| Paper and cardboard | Boxes of foods, beverages, medicine, newspaper, magazines, books, brochure |
| Glass | Beverage bottles, glass, packaging of food products and medicine |
| Metal | Beverage cans, canned food products, steel wool and covers |
| CRLR | Tissue debris from dryer, Velcro, garments, pieces of fabrics, cleaning cloths, gloves and caps |
| Chemical contaminant | Batteries, shoe ink, medicine packaging, pressurized packs, poison packaging, impregnated chemical clothing, pens with ink, cosmetics in general and lamps |
| Biological contaminant | Toilet paper, napkins, cotton swabs, sharp objects (needles, syringes, ampoules, shaving blades), toothpicks, diapers and pads sanitary napkins |
| Mixed | Tetra pack packaging, medicine chart, laminated food packaging, A4 paper packaging, scotch tape, badge, electronics, toothpaste packaging, aluminum paper, lighter, cleaning sponge |
| Miscellaneous | Cigarette butts, soap remains, stoppers, printer ribbon, carbon paper, toothbrush, water filters, porcelain, wood, match |
CRLR: cloths, rags, leather and rubber
During the experimental period, the sum of waste categorized was 858 kg, corresponding to the total waste quantified. Monthly data are shown in table III, including number of employees, guests, and people in events of each characterization, where a proportional relation with the generated waste was not verified. On the other hand, the characterizations with the occurrence of a festive event obtained the largest waste generation in the three occasions, followed by the occurrence in commercial events with 79, 74, and 69 kg, while the lack of events obtained the lowest values, not exceeding 50 kg.
TABLE III TOTAL OF WASTE (kg) AND CHARACTERIZATION PARAMETERS FOUND DURING THE STUDY
| Characterization | 1 | 2 | 3 | 4 | 5 | 6 | 7 | 8 | 9 |
| Month | Jan | Feb | Apr | May | Jun | Sep | Oct | Nov | Dec |
| Employees | 68 | 70 | 50 | 77 | 60 | 34 | 67 | 62 | 51 |
| Guests | 255 | 179 | 103 | 214 | 253 | 112 | 230 | 127 | 134 |
| People in events | 295 | 0 | 0 | 270 | 340 | 0 | 345 | 170 | 320 |
| FE | 1 | 0 | 0 | 0 | 0 | 0 | 2 | 1 | 0 |
| BE | 1 | 0 | 0 | 3 | 2 | 0 | 3 | 0 | 3 |
| Total of waste (kg) | 117 | 49 | 40 | 79 | 74 | 37 | 238 | 154 | 69 |
FE: festive events, BE: business events
The waste categories generated in each sector can be seen in table IV. In the kitchen, ballroom, rooms, and room’s bathrooms sectors all types of waste were generated. In other sectors, the generation of at least four categories of waste can occur except in laundry, where only the generation of plastic and CRLR were identified.
TABLE IV DISTRIBUTION OF WASTE CATEGORIES AND SECTORS (GENERATION SOURCE) IN THE LODGING
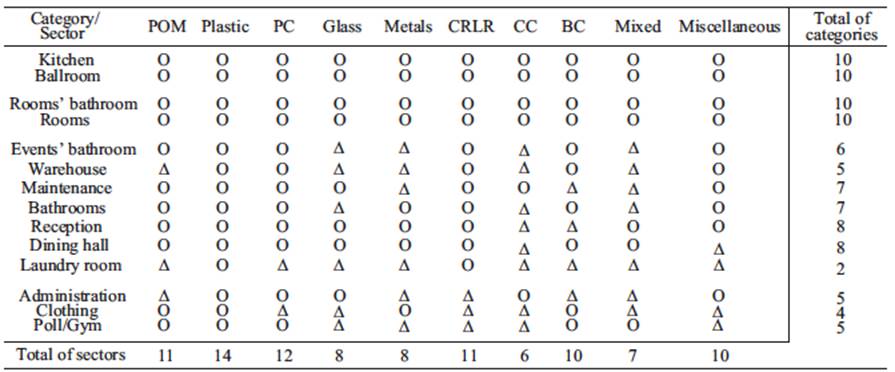
O: occurrence, Δ: non occurrence. POM: putrescible organic matter, PC: paper and cardboard, CRLR: cloths, rags, leather and rubber, CC: chemical contaminants, BC: biological contaminants
It can be seen that biological contaminants can be generated in at least nine sectors of the hotel. This type of waste is generated primarily in bathrooms (room’s bathrooms and events’ bathrooms), where another six to 10 categories can be found.
Chemical contaminants may be found in the maintenance sector generated by lamps and batteries and in the laundry sector by household cleaning packages.
Putrescible organic matter made up the highest proportion of total waste with 43.7%, which is followed by the biological contaminants category with 15.1 % and by glass, plastic, paper, and cardboard with 12.9 %, 11.2 %, and 8.7 %, respectively. The percentage of all categories of waste is shown in figure 1.

On the other hand, the miscellaneous categories, mixed, CRLR and metals, contributed equally (p > 0.05) with 9.5 % of the total waste (Table V). The chemical contaminants category generated the least amount of wastes (p > 0.05) and only in specific sectors (Table IV), which can be attributed to the particular use of this type of waste.
TABLE V PERCENTAGE OF COMPOSITION OF SOLID WASTE IN THE LODGING UNDER STUDY AND OTHER COMMERCIAL ESTABLISHMENTS
| Category | Mean* | Dangi 2011a | Sokka et al. 2007B | Dangi 2011C | Vega et al. 2008D |
| POM | 41.2a | 57.8 | 26 | 53.4 | 54.1 |
| BC | 14.2ab | - | - | - | - |
| Glass | 12.1cd | 8.8 | 5 | 31.6 | 4.6 |
| Plastic | 10.5bc | 9.6 | 7 | 5.1 | 8.2 |
| PC | 8.2bcd | 3.3 | 51 | 5.3 | 23.3 |
| Miscellaneous | 3.4e | - | - | - | - |
| Mixed | 3.1de | - | - | - | - |
| CLRL | 1.3e | 0 | - | 0 | - |
| Metals | 1.1e | 16.9 | 2 | 0.9 | 4.5 |
| CC | 0.2f | 0 | - | 0 | 0 |
| Other | - | 2 | 9 | 3.7 | 4.3 |
*Mean of waste characterized in the study lodging. A: hotel, B: market, C: restaurant, E: university campus. Different letters indicate significant differences between waste categories by Tukey’s test (p < 0.05). POM: putrescible organic matter, PC: paper and cardboard, CRLR: cloths, rags, leather and rubber, CC: chemical contaminants, BC: biological contaminants
Before the grouping of characterizations by event type, the mean for waste category characterization was calculated and is shown in table VI. As expected, the categories of the characterization of FE waste corresponding to BE and NE showed a significant difference between them, although characterizations with BE and NE did not show a significant difference (p > 0.05). The highest generation in FE may be attributed to the per capita generation of people in the ballroom due to a rise in the categories POM, plastic, miscellaneous and primarily glass, which increased 10 times compared to BE.
TABLE VI QUANTITY OF DIFFERENT CATEGORIES OF RESIDUES FROM THE HOTEL IN FESTIVE EVENTS (FE), BUSINESS EVENTS (BE), AND NO OCCURRENCE OF EVENTS (NE) CHARACTERIZATIONS
| Category (kg) | FE | BE | NE | |||||
| kg | % | kg | % | kg | % | |||
| POM | 71.8 | 42.2 | 32.2 | 43.5 | 19.4 | 46.3 | ||
| BC | 17.0 | 10.0 | 17.0 | 22.9 | 8.7 | 20.6 | ||
| Glass | 32.1 | 18.8 | 1.3 | 1.8 | 3.0 | 7.1 | ||
| Plastic | 20.0 | 11.7 | 8.1 | 10.9 | 3.6 | 8.5 | ||
| PC | 13.0 | 7.6 | 8.0 | 10.8 | 3.6 | 8.7 | ||
| Miscellaneous | 7.7 | 4.5 | 2.0 | 2.7 | 0.5 | 1.2 | ||
| Mixed | 4.8 | 2.8 | 3.0 | 4.1 | 1.5 | 3.5 | ||
| CRLR | 2.0 | 1.2 | 1.2 | 1.6 | 0.8 | 1.9 | ||
| Metals | 1.6 | 1.0 | 1.1 | 1.5 | 0.6 | 1.3 | ||
| CC | 0.2 | 0.1 | 0.1 | 0.1 | 0.3 | 0.8 | ||
| Mean | 17.0a | 7.4B | 4.2B | |||||
Different letters indicate significant difference between characterizations by Tukey’s test (p ≤ 0.05). POM: putrescible organic matter, BC: biological contaminants, PC: paper and cardboard, CRLR: cloths, rags, leather and rubber, CC: chemical contaminants
The waste obtained from HRP corresponds to 30-139 kg of waste generation regardless the waste type. The waste with LRP weighted between 12 and 32 kg, as shown in figure 2. The percentage of these values corresponds to 19-28 % of waste with LRP and it is higher than the one found by Dangi et al. (2011) in a hotel study (2 %).
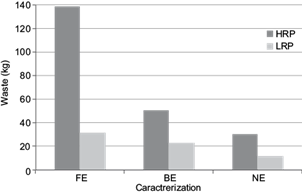
Fig. 2 Quantity of waste with high recycling potential (HRP) and low recycling potential (LRP). FE: festive events, BE: business events, NE: no occurrence of events
From the values shown in figure 2, it is evident that the solid waste of the hotel is primarily constituted of materials that could be reused, composted, and recycled. Regarding LRP, known as rejects, programs to minimize its generation must be directed to identify the lowest volume of treatment or the final disposal.
Table VII shows that the increase in waste generation of FE is due to the increment in the generation of waste with HRP (p < 0.05) and not of waste with LRP, which did not show a significant difference between the characterizations. This difference is attributed to the activities and food/beverage consumption that occurs in the ballroom and it is reflected in the per capita contribution of waste with HRP.
TABLE VII STATISTICAL SUMMARY OF WASTE GENERATION IN FESTIVE EVENTS (FE), BUSINESS EVENTS (BE), AND NO OCCURRENCE OF EVENTS (NE) FOR WASTE WITH HIGH RECYCLING POTENTIAL (HRP) AND LOW RECYCLING POTENTIAL (LRP)
| Q2 | Df | Z | p-value | |
| HRP | 8.400 | 2 | 0.015a | |
| FE-BE | 2.023 | 0.043b | ||
| EF-NE | 2.023 | 0.043b | ||
| BE-NE | 1.483 | 0.138b | ||
| LRP | 5.200 | 2 | 0.074a |
Q2: chi-square value, Df: degrees of freedom, Z: z-value, a: Friedman test, b: Wilcoxon test
Table VIII shows the categories found in each sector and the quantity of residues between the characterizations grouped in relation to the event type.
TABLE VIII QUANTITY OF WASTE (kg) GENERATED IN FESTIVE EVENTS (FE) AND BUSINESS EVENTS (BE)
| Sector | FE | BE | |||
| kg | % | kg | % | ||
| Ballroom | 81.2 | 47.7 | 5.9 | 8.0 | |
| Kitchen | 47.7 | 28.0 | 32.8 | 44.3 | |
| Bathroom’s rooms | 13.3 | 7.8 | 12.4 | 16.8 | |
| Rooms | 11.4 | 6.7 | 9.8 | 13.2 | |
| Warehouse | 4.3 | 2.5 | 1.8 | 2.4 | |
| Events’ bathrooms | 3.4 | 2.0 | 4.7 | 6.4 | |
| Dining hall | 2.0 | 1.2 | 0.5 | 0.7 | |
| Bathrooms | 1.3 | 0.8 | 1.0 | 1.4 | |
| Laundry | 1.2 | 0.7 | 0.9 | 1.2 | |
| Clothing | 1.2 | 0.7 | 0.2 | 0.3 | |
| Hall/reception | 0.9 | 0.5 | 1.3 | 1.8 | |
| Maintenance | 0.9 | 0.5 | 1.2 | 1.6 | |
| Administration | 0.9 | 0.5 | 1.0 | 1.4 | |
| Pool/gym | 0.6 | 0.4 | 0.4 | 0.5 | |
| Mean | 12.2a | 5.3b | |||
Different letters indicate a significant difference between characterizations by t-test (p < 0.05)
The kitchen is among the sectors that generated the greatest quantity of waste, since it is responsible for the preparation of most of the meals served in the lodging. The ballroom, kitchen, room’s bathrooms, and rooms contributed with more than 80 % of the total amount of waste in the lodging. It was observed that in FE, the waste generation in the ballroom contributed to 48 % of the total waste, while in BE this value was 8 %.
From the data observed, it is possible to estimate the per capita generation by guests in the lodging. In table IX, the mean from the per capita generation of waste with HRP, including guests and people in events, resulted in 0.3, 0.1, and 0.23 kg/day for FE, BE, and NE, respectively. The values obtained from the per capita generation with LRP were 0.07, 0.05, and 0.09 kg/day for FE, BE, and NE, respectively, which when added to those of high potential gave a total of 0.359, 0.145, and 0.320 kg/person/day. Although the quantities are significantly low for waste in NE, its per capita generation is close to that of the FE, indicating the dependence of the number of responsible people for the generated residues. The generation from the ballroom section, which depends on the occasion and the number of people, can result in 0.3 kg/person arising from only two sectors of the hotel (ballroom and bathroom’s events).
TABLE IX NUMBER OF GUESTS AND PER CAPITA GENERATION (GP)1
| Characterization | FE | BE | NE |
| Guests | 204 | 200 | 131 |
| People in events | 270 | 310 | - |
| GP HRP | 0.292 | 0.099 | 0.230 |
| GP LRP | 0.067 | 0.046 | 0.090 |
| GP events | 0.313 | 0.117 | - |
1kg/person/day.
FE: Festive events; BE: bussiness events; NE: no occurrence of events; HRP: high reciclyng potential; LRP: low recycling potential
DISCUSSION
The estimated value in the characterization of waste types can be affected by the month and quantity of events, considering the increase in the consumption during these periods. The number of guests and people in events corresponds to a distinct group of waste generators in a city, as shown by Li et al. (2011). In the latter study, the floating population (tourists) contributed to a large portion of the urban solid waste, thus they are considered an important factor to estimate the generation of waste.
Wastes from bathrooms are compounds that, by their nature, cannot be reused or recycled because of their biological risk, therefore they are treated as rejects (Vega et al. 2008). In addition, when they are in contact with waste from other categories, these materials are contaminated, which prevents or complicates their reuse. Consecuently, the lack of segregation between wastes from a biohazardous category and the others can result in spending resources in transportation as well as reducing the lifespan of the dumping ground because the waste occupies more space where it is disposed (Singh et al. 2011).
In the case of chemical contaminants, these materials should be included in a reverse logistic system. Manufacturers of these chemicals should be responsible for collecting or adequating routes for their collection since their management has occupational hazards and environmental risks when included in the collective system and final disposal in conventional dumping sites (Tan and Li 2014).
Plastic is generated in all sectors of a hotel, which can be attributed to the diversity of its use in derivate materials of nonrenewable energy sources, such as pet bottles, cups, disposable tableware, styrofoam, covers, cleaning product packages, cosmetics, food, etc. (Kalanatarifard and Yang 2012). In total, this category corresponds to 11.2 % of the weight of the constituents of wastes in the lodging, which is not far above the percentage found in other hotels (with a value of 9.6 %; Dangi et al. 2011).
The categories of miscellaneous, mixed, CRLR and metal wastes differ from other studies shown in Table V, except for the study of Dangi et al. (2011), who found that in a restaurant the consumption of beverage in glass bottles is common.
According to table V, a similar percentage was observed for chemical contaminants in studies conducted in other generation sources, including a hotel in Nepal (A), a commercial establishment in Finland (B), and a restaurant in a university campus (D), where plastic did not reach 1 % of the total waste generation.
According to Saeed et al. (2009) and Gómez et al. (2009), the solid waste composition of a hotel can be affected by the time of the year, developmental activities, and by the habits of the generators. It could be observed that the putrescible organic matter category prevails in most cases of gravimetric composition. One of the particular characteristics of the organic material fraction-considering the wet fraction of the waste, as in cooked food scraps and leftovers of fruits and vegetables-is its degradation on a short period of time, that is, if it is not controlled it can intensify environmental problems (Colón et al. 2010). On the other hand, when composting is applied as a specific destination for organic matter, from a well-conducted degradation process, great advantages are obtained because there is no generation of slurry and greenhouse gases that are issued in lower concentrations than in dumping grounds, except for the organic fertilizer production at the end of the process (Adhikari et al. 2013). According to Radwan et al. (2010), composting represents a suitable option for recovering organic waste in a hotel, so it is necessary that local authorities support companies to make composting in their own backyard with sufficient tools and information.
The variation of wastes in the ballroom can be attributed to the multiple uses of the sector, e.g., a place for meetings, such as business meetings and anniversary celebrations, which can determine the characteristics and quantity of the generated waste.
The differences noticed between the characterizations of wastes, the average of glass and also the total waste generated in the ballroom, can be attributed to the large quantity of food and drinks consumed in the FE, which increased the per capita generation of waste.
According to Park and Boo (2010), for the activities carried out in the convention sectors, food and beverages consumption was at the top of the set for environmental problems. So, knowing the potential of this waste generation in different events, proceedings to decrease the quantity generated in the categories organic and glass should be provided to the staff.
As the above data showed, in the hotel industry including events services, the generation of solid waste and energy use in illumination, refrigeration, equipment, and heating is common, which leads to the characterization of an entity that acquires goods and services, discards waste, consumes resources, and, as any other subject, leaves an ecological footprint (Kasim 2009).
Considering the mobility of the visitors in the lodging, mostly tourists, the daily generation index is explained by the low residence time in the hotel. It includes activities such as going to bars and restaurants, cultural and sports activities, thematic parks, among others, that occurr outside the lodging. The research conducted by Trung and Kumar (2005) in different types of lodgings shows that the per capita generation of waste can range from 0.4 to 17.5 kg/person/day, considering the variance attributed to the types of lodgings, where there is a variation in the size of the establishment and in the services and products offered.
The waste is an inevitable product generated by a range of services provided by the lodging. The organization of events in hotels requires that the waste management of the residues generated from this sector must take into consideration its environmental impact and sustainability.
The relevance of data among the per capita waste generation in the ballroom sector should be considered so that the conditioning devices of waste, central storage, and other management steps can be established according to the demand produced. Thus, problems due to the lack of devices and excessive waste accumulation in the ballroom sector should be avoided because the guest-customer is in direct contact with this sector and may have an unfavorable overall image of the hotel.
Furthermore, these data must support the waste management plan of the establishment, prioritizing the routing of the waste with HRP for composting or recycling and the final disposal in the environmental system for those with LRP.
CONCLUSION
Putrescible organic matter (44%) was one of the largest categories generated and the glass category (13%) contributed in a similar way as plastic and cardboard. In the kitchen, room’s bathroom, rooms, and ballroom sectors, all categories of the identified wastes were generated.
There was no difference in the generation of biological contaminants (14 %), plastic (10 %), and paper and cardboard (8 %). The same was observed for the miscellaneous (3 %), mixed (4 %), CRLR (1 %) and metals (1 %) wastes. The lowest weight corresponded to the category of chemical contaminants.
In characterizations with FE, the event service was responsible for 48 % of the total amount of wastes generated in the lodging, while for BE the average percentage was 8 %. The generation of waste with high potential of recycling was higher in FE.
This study shows that the types of events orginized in a hotel can determine the total quantity of the waste generated.
The per capita generation of waste for FE, BE and NE was 0.359, 0.145 and 0.320 kg/person/day, respectively.
The methods applied for the qualitative and quantitative analysis of the constituents of solid urban waste can also be used in other tourist resorts. Moreover, for the development and implementation of waste management in a hotel, it is essential to know the specific characteristics of each hotel, where the type and quantity of waste can vary according to the structure, economic condition of the guests, and its geographic location, among others.

