


 text new page (beta)
 English (pdf)
 Article in xml format
 Article references
 Send this article by e-mail
 Cited by SciELO
  Similars in
SciELO
Similars in
SciELO 
 Permalink
INTRODUCTION
Vinasses from mezcal and tequila production
In Mexico, Agave is a natural resource of great economical, sociological, and agro-ecological importance. More than 200 different Agave species, 75 % of the total, are found in the country. Agave is used to produce two important commercial Mexican products; tequila and mezcal. About 8 million liters of mezcal are produced yearly in Mexico, from which 90 million liters of vinasses remain as organic waste from this industry. Depending on the feedstock and distillation parameters, mezcal vinasses consist of organic substances such as acetic and lactic acids, glycerol, polyphenols, phenols, melanoidins, and inorganic substances such as sulfates or phosphates. The general characteristics for vinasses are low pH (3-5) and high organic matter content (biological oxygen demand of 35 000 to 50 000 mg/L and chemical oxygen demand of 70 000 to 150 000 mg/L). Due to their acidic composition, high concentration of mineral salts, and high recalcitrant organic matter, vinasses can contaminate the environment and their discharge into soils and water and can have a negative impact on the ecosystem. When used on fertile soils, vinasses may affect the soil structure, nutrient uptake and crop yield (López-López et al. 2010, Robles-González et al. 2012, Moraes et al. 2014). For this reason, in Mexico, biological and physicochemical treatments of vinasses have been researched recently. The principal target is to reduce the biodegradable organic matter, convert major toxic organic substances to compounds that can be easily biodegraded, and reach the permissible levels of contaminants in wastewater discharges into national waters according to the NOM-001-SEMARNAT-1996 (SEMARNAT 1996).
Microbial fuel cells
Microbial fuel cells (MFC) are electro-chemical reactors, which use microorganisms from an electrolyte solution as catalysts to generate current by the oxidization of organic matter such as acetate, glucose and volatile fatty acids, or inorganic matter such as sulfides. This system generates clean electricity directly from chemical energy in one step, treating wastewater simultaneously (Higgins et al. 2013, Xiao et al. 2014, Baicha et al. 2016). The production of electricity is not the only objective of MFC operation. Also the removal of pollutants such as nitrites, sulfides, or sulfates, and especially of organic matter and thus wastewater treatment are targets of the MFC. During the recent years, the interest in lab-scale and large-scale applications has increased tremendously, as well as the power output generated from MFC. The efficiency and performance of MFC, including the power density and coulombic efficiency, depend on the chemical and biological composition of the substrate used in the cell (Pant et al. 2010).
MFC performance has been tested with different substrates as electrolyte solution, such as swine wastewater, domestic wastewater, distillery wastewater, alkaline substrates, glucose, acetate and microalgae, among others (Martin et al. 2010, Mohanakrishna et al. 2010, Liao et al. 2014, Baicha et al. 2016, Kim et al. 2016).
Vinasses in microbial fuel cells
The results found in the literature in regard to power density, coulombic efficiency, organic matter, and pollutant removal in MFC differ according to the substrates utilized, cell design, operating conditions, and electrode materials. Vinasses from Agave have a high content of organic matter as well as sulfides or phosphates, which could be used as electron donors in MFC. Little research has been done in regard to vinasses in MFC, even though this substrate is very promising. MFC technology is a promising alternative to treat the recalcitrant compounds of vinasses before they are being discharged into soils and water, in addition to the potential for electricity production. Few papers report results regarding the electricity production from microbial fuel cells using substrates with high organic matter in terms of chemical oxygen demand (COD). The aim of this study was to analyze different vinasses COD concentrations tested in microbial fuel cells for the purpose of electricity generation and organic matter degradation.
MATERIALS AND METHODS
MFC configuration
Microbial fuel cell MFC-900 consisted of two plexiglass chambers separated by a Nafion 117 proton exchange membrane with a surface of 7 cm2. The total volume of the MFC was 900 mL, with 450 mL in each chamber. Temperature was kept at 34 ºC using a water bath. The cathodic chamber was aerated by means of an Elite 801. Anode was made of graphite felt from supplier, Rooe Group, with a volume of 4.8 cm3. The cathode consisted of an AISI 304 stainless steel plate with the dimensions of 4 × 2 x 0.1 cm. Electrodes were connected with a stainless steel rod with a diameter of 0.7 mm and the distance between electrodes was 15 cm. External resistance was 5000 Ω. In the anodic chamber, wastewater was mixed with different concentrations of vinasses from Agave salmiana mezcal production, while in the cathodic chamber deionized water was used.
Vinasses samples were stored at 4 ºC until they were used. The pH and the conductivity of concentrated vinasses were 4.22 and 7.35 mS/cm. The wastewater had a pH of 8 and a conductivity of 2252 mS/cm. The pH of the vinasses diluted with wastewater varied from 7.5 to 7.9. Every time a new concentration of a specific amount of vinasses diluted with wastewater was tested, new wastewater was used and the biofilm was kept in deionized water injected with nitrogen in order to achieve the absence of oxygen. COD of the wastewater ranged between 1100 and 1500 mg/L. COD of concentrated vinasses was 140 000 mg/L.
Start-up and operation
As an inoculum, sludge was provided by a treatment plant, in which the wastewater produced was being aerobically treated for removal of organic matter and recalcitrant compounds. Sludge was used in the MFC-900 without vinasses for 30 days at 34 ºC for inoculation. To test the COD effect on the electricity production, different vinasses concentrations were used as electrolyte solution in the MFC by diluting them with wastewater. The different vinasses concentrations were chosen according to values in the literature regarding the use of other substrates utilized in MFC with high COD tested. No values for Agave vinasses were found for comparison. Wastewater was used to facilitate the formation of the biofilm, to buffer the low pH of vinasses, and to provide a varied microbial community for organic matter degradation. Three experiments were carried out. Due to lack of capacity, no blank test with only wastewater was performed. First, vinasses were diluted resulting in COD of 1209, 4059, 6000 and 17 143 mg/L. These tests were run in the MFC-900 until a constant voltage production was achieved or until the voltage decreased. The second experiment consisted of testing a high COD (10 604 mg/L) in the MFC-900 over a longer period. This was done to check if the microbial community would begin to degrade the vinasses once the hydrolyzed substrate was available for the exoelectrogenic microorganisms and to test if a thicker biofilm could be formed using a longer time period. The MFC was run out over two months. In the third experiment lower COD (6760 mg/L) was tested over two months in MFC-900 in order to corroborate if a lower COD would result in a better MFC performance.
Measurement and calculations
Voltage data was recorded continuously by the data acquisition system, Labview 2011 from National Instruments, and measured daily with a multimeter Steren Mult-010. Power density P was calculated according to Eq. 1 and current I according to Eq. 2, where R means resistance, V means voltage and V anode means the volume of the anodic chamber.
 ()1
()1
 ()2
()2
Polarization curves were calculated only in the first experiment, when a constant voltage was shown for more than 48 hours. In the second and third experiment no polarization curves were calculated, in order not to interrupt voltage production. Polarization curves were calculated with a potentiostat BASi Epsilon-EC, Bioanalytical Systems, Inc. Internal resistance was calculated according to the data from the polarization curves. COD was measured at the start and the end of each experiment according to the German Standard Method DIN 38409-41:1980-12 (DIN 1980). Three samples were analyzed for COD measurement. Prior to these measurements, a COD calibration curve was done with controlled samples using a wavelength of 620 nm. COD removal was calculated as the ratio between removed COD and initial COD. The pH and the conductivity were measured with an Orion 4 Star pH-meter from Thermo Scientific. Power density and internal resistance were calculated using the different COD by means of polarization tests, measuring anode and cathode potentials against an Ag/AgCl in NaCl reference electrode.
RESULTS AND DISCUSSION
Effect of COD in power output and internal resistance
Figure 1 shows the polarization curves of the first experiment, where vinasses at COD of a) 1209, b) 4060, c) 6000 and d) 17 143 mg/L were tested. The highest power density was achieved when using the COD concentration of 6000 mg/L resulting in 80.64 W/m3 (c). When COD increased to 17 143 mg/L, the power density was the lowest recorded with 5.138 W/m3 (d). COD of 1209 mg/L and 4060 mg/L achieved 53.39 (a) and 23.78 W/m3 (b) correspondingly. The fact that the highest COD concentration showed the lowest power output occurred because the anodic reactions in the anodic chamber of the MFC depend on the substrate characteristics and carbon availability. If the substrate has colloidal particles, as the case for vinasses, these particles can act as limiting factors and increase the internal resistance, so that power density is diminished. Power density rises when the organic loading rate increases up to a certain concentration. When the organic load exceeds the specific concentration, power density decreases, although organic load removal increases. High COD could produce a saturated state in the MFC generating a power density decrease (Nam et al. 2010, Liu et al. 2011, Oliveira et al. 2013).
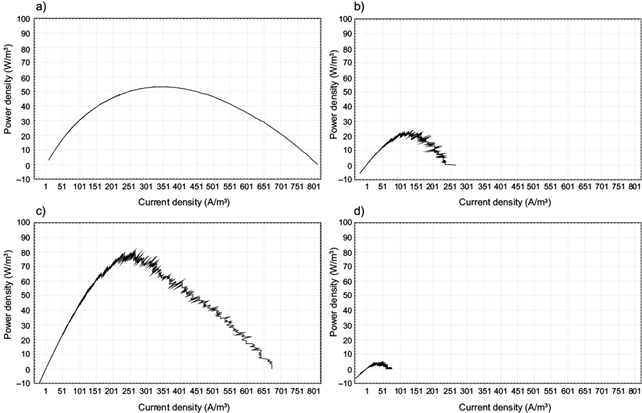
Fig. 1 Polarization curves using different organic matter concentrations in the electrolyte composed of vinasses and wastewater: a) chemical oxygen demand of 1209 mg/L, b) chemical oxygen demand of 4060 mg/L, c) chemical oxygen demand of 6000 mg/L and d) chemical oxygen demand of 17 143 mg/L
Similar results were obtained by Belafi-Bako et al. (2014), who tested the power output of an MFC inoculated with anaerobic sludge from an anaerobic digestion (AD) plant using wastewater from a sugar beet factory as substrate. The highest power density of 8652 mW/m2 was achieved with COD of 7150 mg/L and the lowest power density of 3380 mW/m2 with a higher COD of 19 800 mg/L. COD of 4060 mg/L yielded 4500 mW/m2. Nam et al. (2010) found the highest power density of 2981 mW/m2 by testing fermented wastewater produced from hydrogen fermentation of coffee processing wastewater with an organic loading rate of 3840 mg/L/d. However, an increase of the organic loading rate up to 4800 mg/L/d generated less power, 2959 mW/m3. The influent characteristics and consortium’s metabolism affected the power generation. Reddy et al. (2010) tested four different organic loading rates (OLR) of an anaerobic mixed consortia of UASB treating wastewater with COD of 0.195, 0.458, 0.911 and 1.589 kg/m3/d, where power generation increased with increasing OLR but only up to 0.911 kg/m3/d generating 76.17 mW/m2. With the highest OLR tested, 1.589 kg/m3/d, the power generation decreased to 49.86 mW/m2. Martin et al. (2010) tested different concentrations of glucose and acetate. Using glucose as a substrate, a power output of 8.2W/m3 was achieved using an organic load with a COD of 3.72 mg/L/d. With the further increase of organic load to a COD of 7.44 mg/L/d, the power output decreased to 6.6 W/m3. Similar results occurred when testing acetate in the MFC. OLR of 4 mg/L/d produced 53.3W/m3 and 8 mg/L/d produced only 50.6 W/m3. When increasing the glucose load, substrate availability for the methanogenic population also increased. Thus, at a higher load, 34 % of substrate was used to produce CH4 and 2 % to produce electricity.
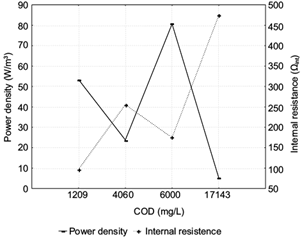
Figure 2 shows the results of the polarization tests regarding internal resistance and maximal power density of the first experiments, in which vinasses with COD of 1209, 4060, 6000 and 17 143 mg/L were tested for power generation. Internal resistance was correlated with the organic matter availability. With the lowest COD tested, 1209 mg/L, the internal resistance was the lowest achieved, 97.10 Ω. The highest internal resistance of 474.58 Ω was achieved with the highest COD of 17 143 mg/L. The internal resistance increases if the substrate has colloidal particles, as is the case for vinasses (Nam et al. 2010). Contrary to what was expected, Martin et al. (2010) found out that using glucose in a MFC, the lowest internal resistance was achieved using the highest glucose load, suggesting that a high volatile fatty acid concentration resulted not only in the increase of ionic strength, but also the catalytic activity and density of anodophilic microorganisms increased, which resulted in the internal resistance drop.
Effect of COD in voltage output
Figure 3 shows the voltage measured with a multimeter during the first experiment, where COD of 1209, 4060, 6000 and 17 143 mg/L were tested. The highest voltage was produced when using vinasses with COD of 4060 mg/L and the lowest when using vinasses with a COD of 17 143 mg/L.
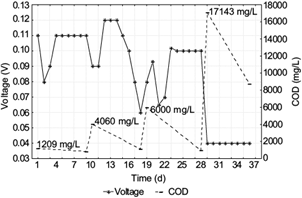
Fig. 3 Voltage output using different chemical oxygen demand concentrations (COD) in the electrolyte composed of vinasses and wastewater
As already described by the effect of COD on power density and in internal resistance, if COD exceeds a specific concentration, the electricity production could be hindered through the saturated state of the substrate. Vinasses from alcohol production, distillery slops, contain a high percentage of organic matter. The contained colloidal particles increase the vinasses density, depending on the distillation parameters, up to 1.72 g/cm3. The potential of electricity production in a MFC is given by the bacterial metabolic activity or in other words by the reduction oxidation reaction generating electrons and protons, as well as by the electron acceptor conditions. This is influenced by the anode potential and the substrate used as electrolyte. If the electrolyte solution has a significant amount of colloidal particles, the electron and proton transfer could be hindered.
Regarding the last two experiments, voltage production tested over a longer period (68 days) was compared using two different COD, 10 604 and 6760 mg/L. Results are shown in figure 4 and figure 5 respectively. Regarding the test using vinasses with a COD of 10 604 mg/L, during the first 34 days, a low voltage, between 0.006 and 0.1 V was recorded. Between days 35 and 44, voltage rose to 0.37 V and then decreased over the next six days. From day 51 to 62, voltage increased up to the highest value of 0.61 V. The last six days the voltage dropped down to 0.38 V, when the experiment was suspended. Voltage production of MFC using vinasses with a COD of 6070 mg/L showed higher voltage production. The first 31 days voltage varied between 0.42 and 0.65 V. On the day 35, voltage reached the highest value of 0.81 V. Between days 36 and 42 voltage dropped to 0.35 V and oscillated around 0.27 and 0.35 V until the experiment was suspended on day 68. With a higher COD of 10 604 mg/L, 0.61 V were obtained after 62 days and with a lower COD of 6760 mg/L, 0.62 V were obtained only after 13 days. Because of the high COD, the reactants availability was not very high during the initial phase, until the hydrolysis of vinasses took place (Nam et al. 2010). When using vinasses with a higher COD concentration, more organic matter needs to be degraded before a significant electron and proton exchange starts and higher voltages can be produced. Molecules need to be first broken into smaller ones in order to be more suitable as MFC fuels.
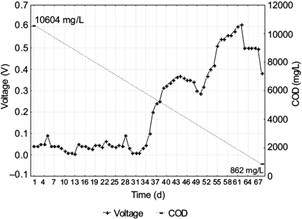
Fig. 4 Voltage output of batch microbial fuel cell MFC-900 using an electrolyte chemical oxygen demand (COD; vinasses and wastewater) of 10 604 mg/L
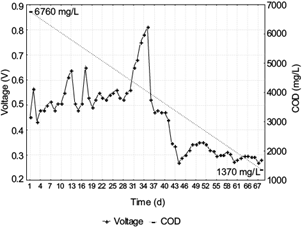
Fig. 5 Voltage output of batch microbial fuel cell MFC-900 using an electrolyte chemical oxygen demand (COD; vinasses and wastewater) of 6760 mg/L
With COD of 6760 mg/L the voltage increased further to 0.81 V after 35 days. Voltage production with a COD of 1 0604 mg/L did not increase higher than 0.61 V. According to Vogl et al. (2016) substrates that are easy to degrade lead to higher power densities in comparison to substrates with a high amount of organic pollutants. A portion of the substrate is used for biomass synthesis. Complex substrates, as in the case of vinasses with high COD, lead to high internal resistance and low power output (Nam et al. 2010). The anodic reactions thus increase electricity production when carbon sources are available with a low COD. This is not the case of wastewater with a high vinasses concentration, because vinasses are complex substrates that contain high concentrations of dissolved solids (such as reducing sugars), nonvolatile compounds, and high concentrations of mineral salts.
COD degradation
Table I shows the results of COD degradation of all the experiments performed. From a COD of 1209 to 10 604 mg/L, the COD removal rate increased to 92 %. Nevertheless, at the highest COD of 17 143 mg/L, COD removal diminished by 49 %. The most efficient COD removal was shown at a COD of 10 604 mg/L and the lowest at a COD of 1209 mg/L. The increase in substrate removal at high load rates (in this study up to 10 604 mg/L) could have occurred because of the direct anodic oxidation mechanism in the anodic chamber. There was an increase in microorganism consumption of organic matter. If the organic load in the substrate is higher, in this case 17 143 mg/L, the saturated state of the electrolyte hindered the oxidation mechanism.
TABLE I PERCENTAGE OF REMOVED CHEMICAL OXYGEN DEMAND (COD) IN THE ELECTROLYTE SOLUTION BEFORE AND AFTER MICROBIAL FUEL CELL OPERATION

Similar results were obtained by Belafi-Bako et al. (2014), when higher COD were tested, COD removal diminished considerably. For example, when using a COD of 19 800 mg/L, only 25 % COD was removed. When using 5025 mg/L, COD removal was 61 %.
CONCLUSIONS
The analysis of testing different vinasses concentrations in MFC demonstrate that an increase in COD from 1209 up to 10 604 mg/L results in an efficient MFC performance in terms of electricity production and COD removal achieving values higher than 80 W/m3 produced with a COD of 6000 mg/L and 92 % COD removed from a COD of 10 604 mg/L. The anodic reactions were able to occur more efficiently when carbon sources within the electrolyte were better available. However, when using a higher COD of 17 143 mg/L, power output dropped to 5 W/m3 and COD removal reduced to 49 %. Internal resistance increased with the organic load due to a higher percentage of colloidal particles in the electrolyte. Over a longer period of MFC operation, substrate with lower COD (6760 mg/L) produced 0.6 V only after 13 days, while substrate with a higher COD (10 604 mg/L) needed 62 days to reach the 0.6 V. This happened due to the high organic content of vinasses, which needs to be hydrolyzed before an important amount of electrons can be released for electron and proton exchange and thus voltage production. On the other hand, the voltage from the MFC operating with 6760 mg/L, continued increasing up to 0.8 V after 35 days, whereas the MFC operating with 10 604 mg/L did not produced more than 0.6 V. This confirmed the results of the first experiments, where a higher COD showed a lower MFC performance, due to the saturated state of the electrolyte solution and lack of availability of carbon sources in the anodic chamber. When COD in the electrolyte solution increased up to 10 604 mg/L, substrate removal occurred because of the direct anodic oxidation mechanism in the anodic chamber. Due to the high amount of colloidal particles in vinasses, a higher COD in the electrolyte solution inhibits the oxidation reactions and thus substrate degradation.

