


 nova página do texto(beta)
 Inglês (pdf)
 Artigo em XML
 Referências do artigo
 Enviar este artigo por email
 Citado por SciELO
  Similares em
SciELO
Similares em
SciELO 
 Permalink
INTRODUCTION
In Colombia, according to international policies, the integrated monitoring of water and soil quality promotes sustainability in basins regarding the conservation of environmental resources (IWMI 2007, MAVDT 2010). The analysis has focused on the physicochemical characteristics (IDEAM 2007, Bates et al. 2008), but these are not complemented by biological parameters to calculate quality and pollution indexes and support decision-making processes (Whitehead 2009, Muñoz et al. 2012).
These specific measurements of water quality do not reflect the interaction between anthropic activities and water pollution in the decline of ecosystem services (ES) in the Andean basins (Balthazar et al. 2015). The benthic communities’ biomonitoring is suggested as a complementary alternative to the traditional techniques of water quality analysis because it incorporates the response to environmental conditions in the structure and function of their communities, which are sensitive to the agriculture management effects (Lock et al. 2011).
Some basin models have been widely used to estimate the impact of nutrient pollution from crop production to the water supplies in the Andean region. However, the control of water conditions has been an uncertain aspect to the crop spatial distribution and its impact on the water quality (Guo et al. 2014). To obtain an integral approach, the multitemporal spatial analysis of land cover shows the transformation of landscapes and provides information to determine the alteration of ecosystem functions in the basin. These analyses generate indirect information about landscape functions. Due to their complexity, the land cover data can be used as a proxy for ecological assessments in natural areas (Balthazar et al. 2015). This information is relevant to recognize the influence of land management in Andean basins that comprises the endemic affectation of ES and the welfare of rural communities (Balvanera et al. 2012, Frank et al. 2012).
The spatial change of land cover provides information to understand the trends of occupation, degradation and biodiversity loss, as a result of the expansion of the agricultural lands and deforestation (Llausàs and Nogué 2012, Nagendra et al. 2013). Different land cover histories assess the effect of land use change on the erosion process. Additionally, changes in the area and crop yield distribution can relate to increases in runoff (Molina et al. 2012). Inputs of pollutants in different zones help to establish critical areas of land management.
Quantification of spatial patterns like aggregation and adjacency in land uses within different landscape units found along the basin, shows correlations between the dispersion of agricultural areas and the management techniques (Mouri et al. 2011, Salman et al. 2011). This determines the incidence of crop spatial distribution in river pollution.
From that perspective, this research approaches the integral techniques of water and soil analysis, linking physicochemical and biological variables through a multivariate analysis (Andrade and Stigter 2009). The objective was to generate a tool that assesses the spatial and temporal dynamics of the water quality in Andean basin areas, considering the influence of agricultural activities in water management.
MATERIALS AND METHODS
Study area
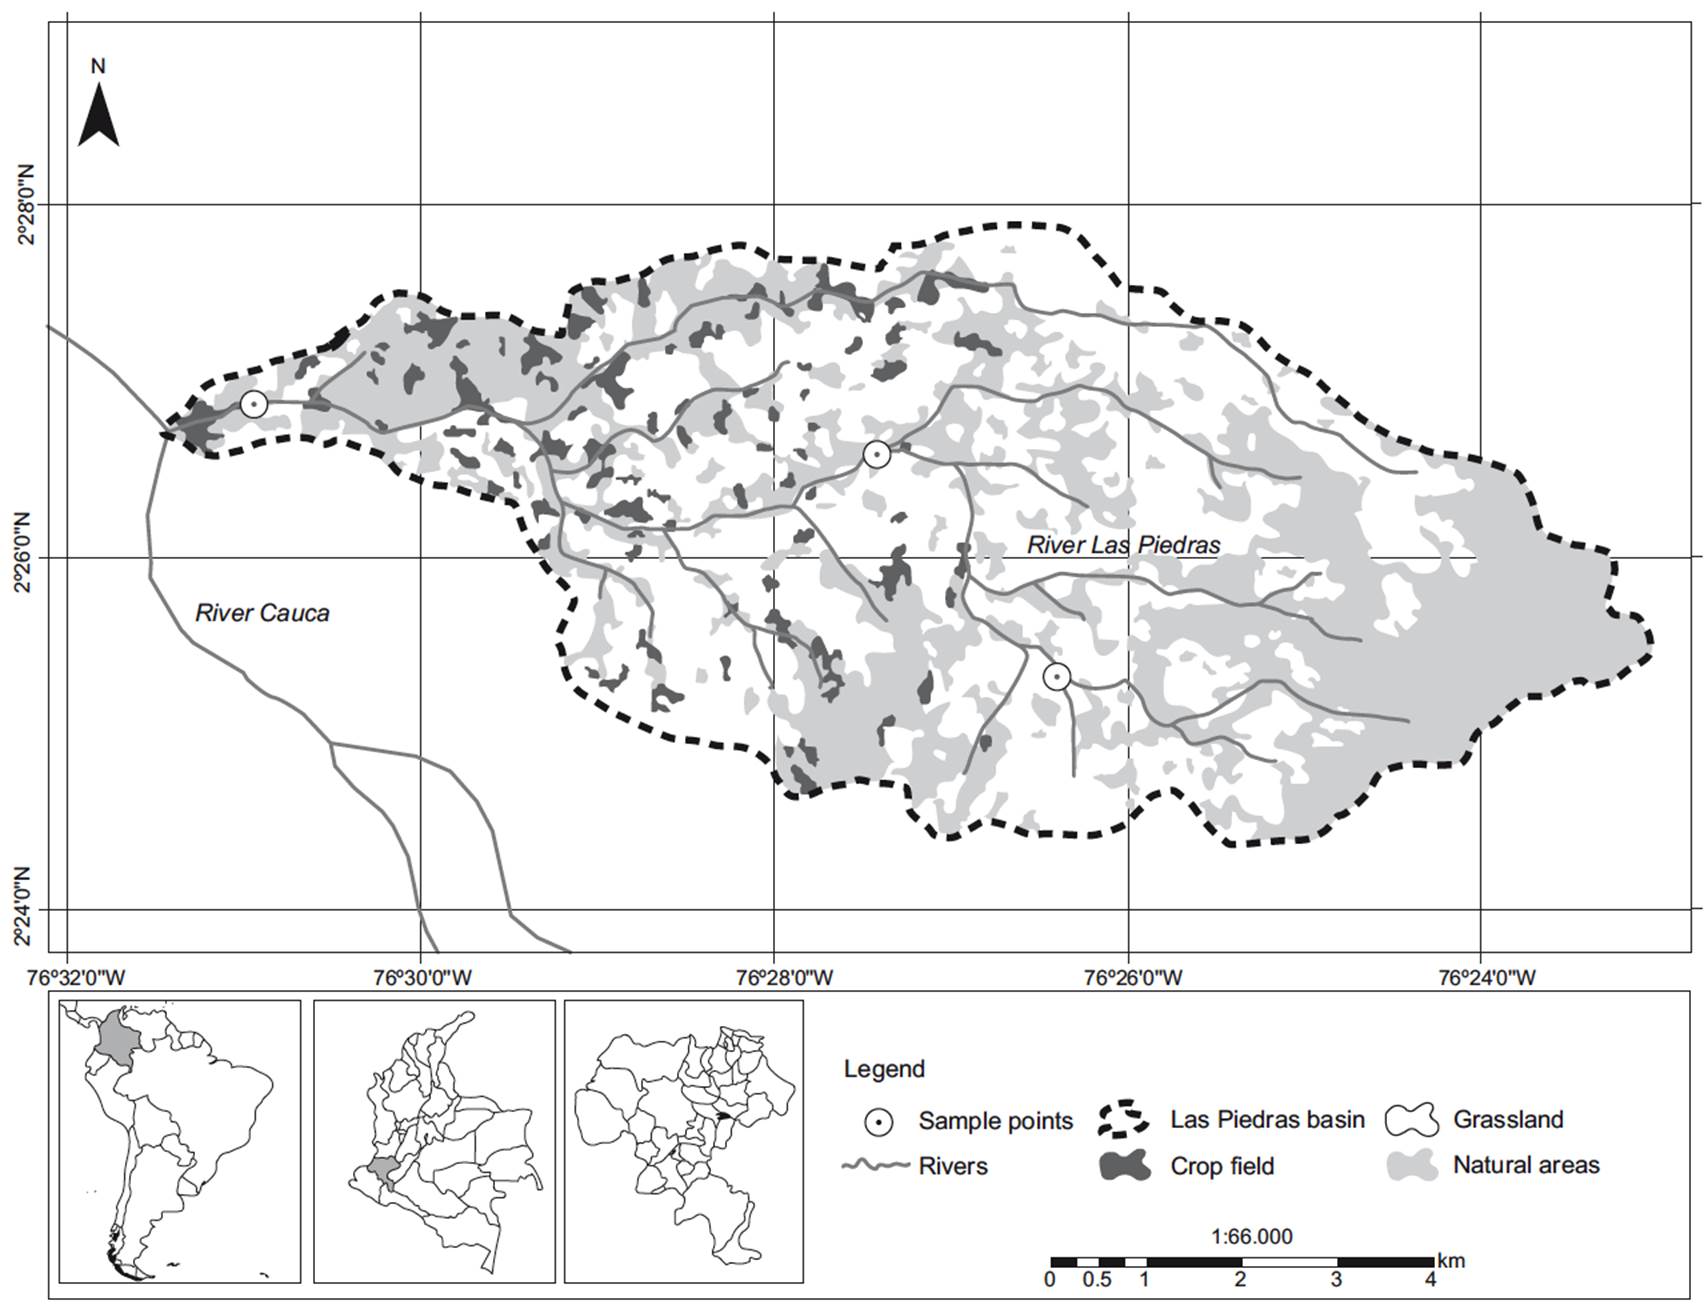
The Las Piedras river basin is located in the municipalities of Popayán and Totoró (Cauca -Colombia), situated between 76º 31’ 10” W - 2º 21’ 45” Nand 76º 23’ 45” W - 2º 25’ 40” N. Its extension is 6626 ha, the temperature ranges from 10.4 ºC in the upper area to 18.4 ºC in the lower area. The climatic zones are typically cold and temperate (1980 to 3820 masl), the topography is mountainous with steep, long and straight slopes in the middle and upper area, while in the lower area is flat and concave.
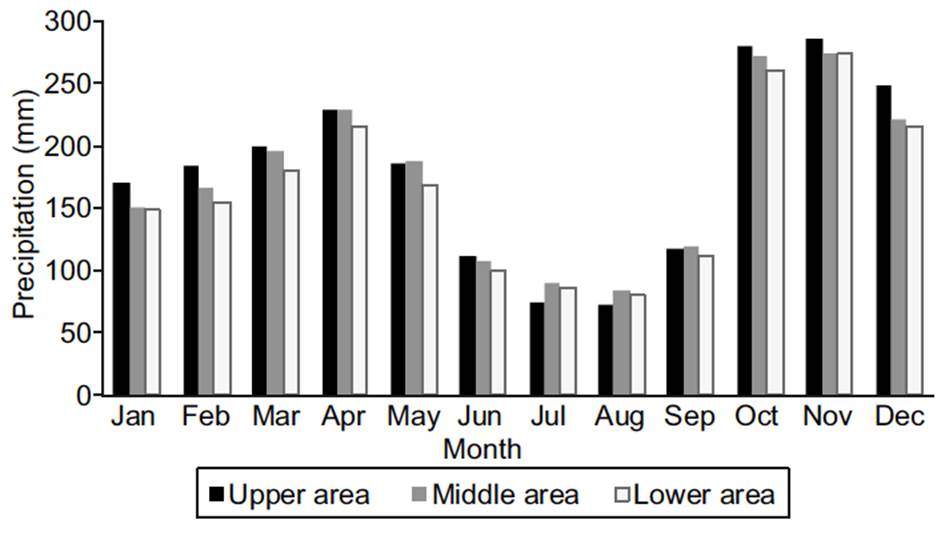
According to the multi-annual average monthly rainfall for the period of 1950 to 2010 (Fig. 1), the precipitation regimes in the basin were identified. The rainiest months (260 mm - 285 mm) were Octoberand November, medium rainfall occurs between June and July (99 mm - 119 mm), and low rainfall (72 mm - 89 mm) during August and September. The annual rainfall average for 2014 was 135 mm.
The soil is composed of volcanic ash; it is poorly structured and well drained with silty clay. It has low acidity (pH ranges 5 to 5.9) and high aluminum saturation (50-85 %). The main land uses are forest with 1720 ha (27 %), pasture 3125 ha (52 %), and crops 267 ha (3 %) according to Figueroa et al. (2012). In the basin there are peasants and indigenous communities from the reserves of Quintana and Puracé.
Experimental set-up
Three points were selected along the main stream to analyze water quality and surface runoff in the basin, covering the upper (3150 masl), middle (2550 masl) and lower (2050 masl) areas (Fig. 2). Selection criteria adhere to the land use distribution map, the analysis of basin morphometric and crop aggregations, which have been developed along the mainstream and parallel to the road in order to commercialize the products. For surface runoff analysis a rain simulator “under controlled conditions” was set up in order to produce fast, reliable, efficient, replaceable and costeffective data. The simulator trickled water droplets of about 2.75 mm in diameter, by means of hypodermic needle-like nozzles (n = 24), distributed in an area of 0.42 m × 0.33 m. This simulated rain had droplets with terminal velocities of around 4.0 m/s, and rain kinetic energy of 17.9 J/mm/m (Cobo 1998). The simulated rain intensity was calibrated according to climatic conditions in the region and the methodology proposed for andean soils (Otero et al. 2011). In this study, the time period chosen for the tests was 30 min according to the historical rainfall distribution series.
Biological diversity
The biological diversity was analyzed according to the variation of the alfa (α) and beta (β) diversity: the Margalef index for specific richness and the Shannon Weiner index (H´) to characterize species diversity in the epicontinental aquatic macroinvertebrate (EAM) community. The H´ index accounts for community structure in both abundance and evenness of the species. The relation between this indexes was evaluated by the linear regression model with the determination coefficient (R2). The β diversity analysis was studied with the Jaccard similarity coefficient.
Water quality assessment
Discrete grab samples were collected manually in amber-colored 1l glass recipients, three replicates by sample were taken from the middle of the stream and at mid-depth; they were labeled and refrigerated in a portable fridge. Sampling period was seven months. The variables analyzed were those in the National Sanitation Foundation index (NSF), pH, nitrates, phosphates, biological oxygen demand (BOD), dissolved oxygen, fecal coliform, total dissolved solids (TDS), turbidity and temperature. To calculate diversity and biological indexes for water quality was studied the composition of the EAM community. Samples were taken manually by using nets as indicated by Villamarín et al. (2013). Surface runoff was obtained using rainfall simulators (Otero et al. 2011). Physicochemical analyses of the water samples were developed according to the Standard Methods (APHA et al. 2012), the bacteriological and BOD tests were performed in a certified laboratory (15/12/05 Resolution No. 004645 of the Ministry of Social Protection).
Anthropic and spatial analysis
The human activities related to agricultural production were characterized by checklists. An influence-dependent matrix determined the main indicators related to water quality. These indicators were classified into four types: key, driver, regulatory, and resulting. The key variables are expressed directly in the dynamic of the system. The driver types are the variables that condition the system, generating synergies with other ones. The regulator types are those variables determining the change in the system according to its transformation by the effect of certain activities. Finally, those of the resulting type are representing the changes in the system.
The spatial locations of crops in the basin favor the sediment yield of nutrients and contaminants in runoff to the river. To analyze the distribution pattern of agricultural land use in the study area, a supervised classification of Landsat TM image (2010) was performed with a multi-spectral composition (bands 4,5,3) using the software ERDAS IMAGINE 9.1. A map of land use classification using Corine Landcover Colombia (level 3) was obtained and processed with the ArcMap Spatial Analysis module (Clusters). Using the software FRAGSTATS V.4 next variables were calculated: Total class area (CA), number of patches (NP), percentage of landscape (PLAND) and aggregation index (Al) to quantify the grouping of crops in three subzones (upper, middle and lower) and its relation to the percentage of the occupied area.
Experimental design
Using a randomized design during seven months (June to December of 2013), a total of 630 samples were obtained to perform the physical and chemical analysis, integrating 10 variables and three replications in the study sites. The EAM sample plan included the exploration of different types of habitats such as mud, rocks, riparian and emerging vegetation, as well as rapids.
For the upper area, the climatic conditions were analyzed according to the daily rainfall data reported by Institute of Hydrology, Meteorology and Environmental Studies of Colombia (IDEAM); for the lower area, the climatic station of the University of Cauca-Environmental Study Research Group, provided the data.
The statistical analysis was performed by the software SPSS v.13.0, Statistica v.7.0, Past v.1.44, Estimates v.7.5 and Biodiversity Pro, which included a distribution analysis and data mining with A Kruskall Wallis and Mann Whitney U test gathering significant differences (p < 0.05) among variables, and a multivariate analysis to integrate the main parameters.
RESULTS
Physicochemical parameters
The nitrate (NO- 3) mg/L concentration oscillates from 0.60 to 3.47 mg/L. The spatial and temporal variation was significant (p = 0.01) and the minimum and maximum values across the basin were found during November and December. In this case, the rainfall has an influence on nitrate concentrations. The nitrates in surface runoff values range from 0.64 to 2.57 mg/L (Fig. 3). The nitrite (NO- 2) and ammonium (NH4) concentration ranges between 0.01-1.12 mg/L and 0.01-0.23 mg/L respectively, the p value (0.02-0.01).
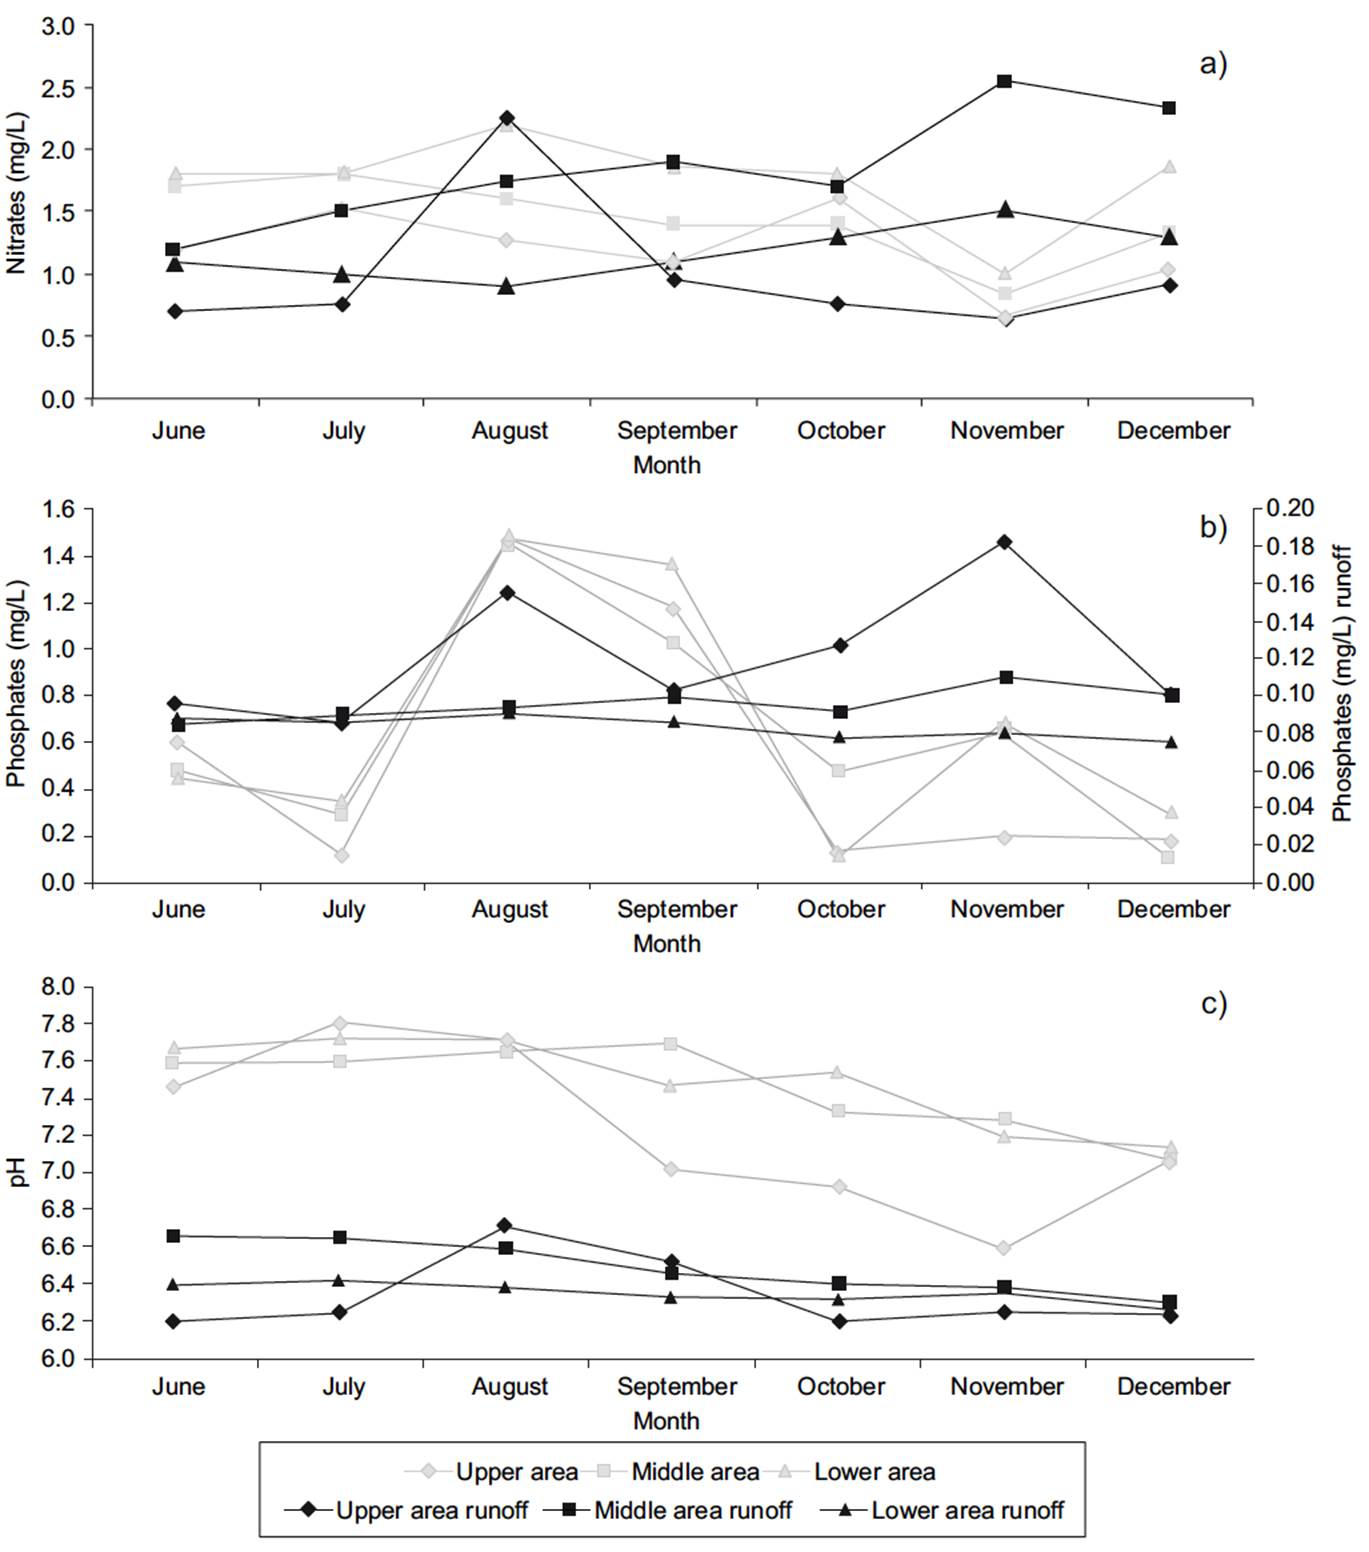
Fig. 3 Spatiotemporal variation in water and runoff samples: (a) nitrates, (b) phosphates and (c) pH
The phosphates in the water vary from 0.09 to 4.29 mg/L and in surface runoff from 0.09 to 0.18 mg/L, with significant temporal variation (Kruskall Wallis 0.02). Months with the lowest rainfall show differences in concentration (U test 0.03), which increases toward the lower area of the basin (≤ 2000 masl), where crops have a major extension (Fig. 3).
The pH values range from 6.59 to 7.80 units in the water, and between 6.1 and 6.71 units in the surface runoff. The spatial and temporal variations were a significant aspect to the rainfall, according to the Kruskall Wallis test (p < 0.05). The lowest rainfall intensities were observed in the upper area with similar trend throughout the basin (Fig. 3).
The water conditions were evaluated using the NSF index, pollution indexes as Suspended Solid Index (ICOSUS), contamination index by organic matter (ICOMO) and EAM community, which indicates an acceptable and poor rating for water quality. Results suggest that the contamination processes are caused by the excess of nitrogen and phosphorus (Hahn et al. 2012) in concordance with the percentage of crop fields in the upper, middle and lower zones of the basin (Fig. 4).
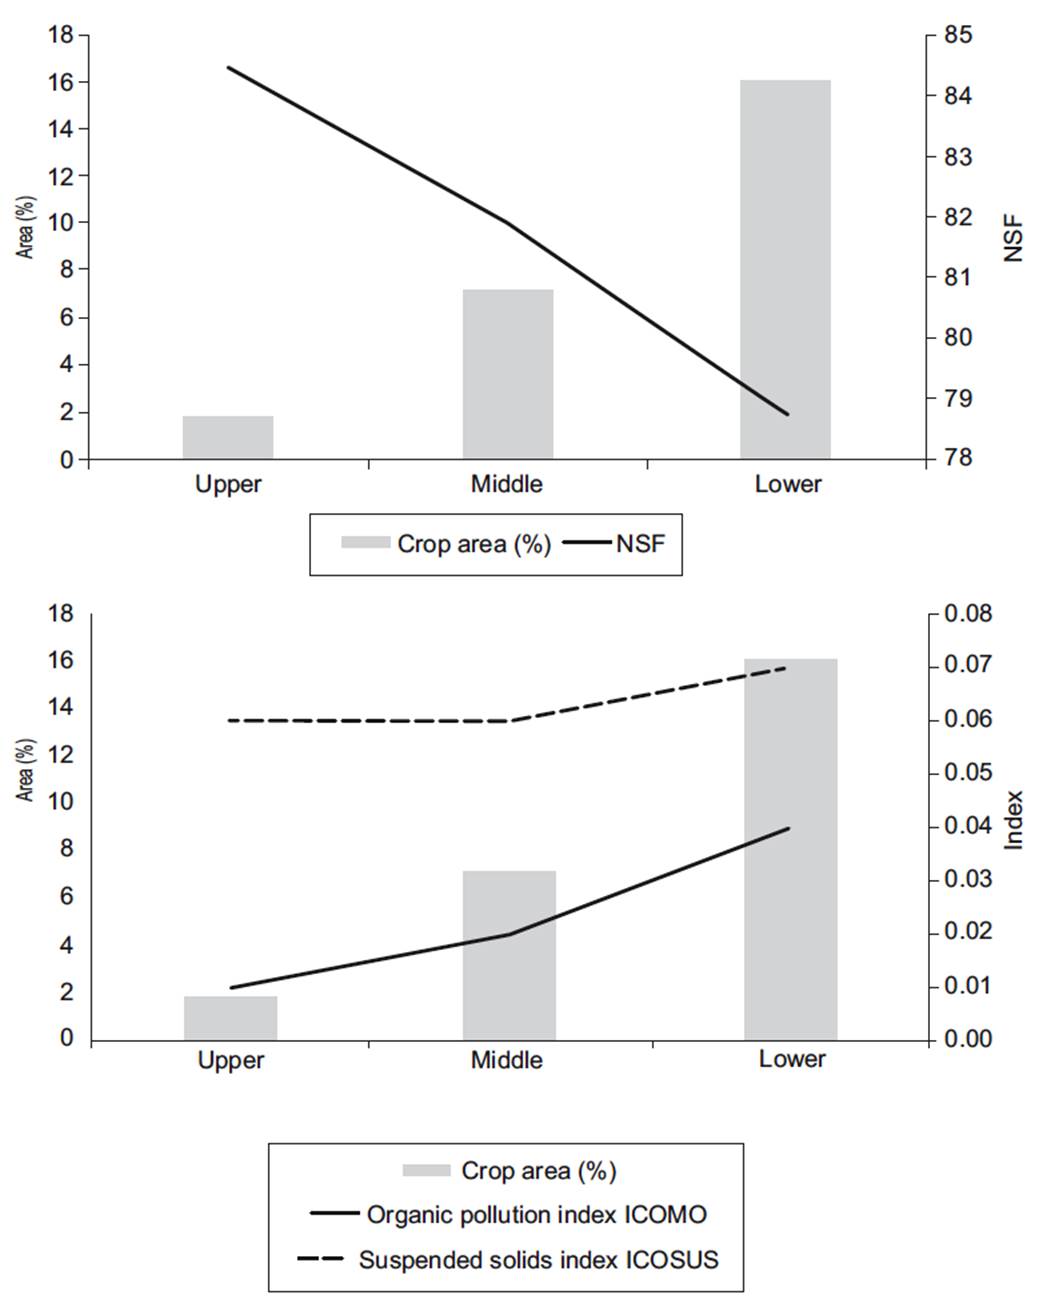
Fig. 4 Crop field area by zones and pollution indexes. NSF = National Science Foundation index, icomo = organic pollution index, icosus = suspended solids index
Plecoptera, Ephemeroptera, Trichoptera (PET) and Diptera organisms were found in the Las Piedras River. The total collection of EAM had a sample efficiency of 90 %. Organisms of the order Glossiphoniformes were found in upper areas of the basin, Hemiptera organisms in the middle area, and Nematomorpha in the lower area. Variations of abundance and richness were not significant (p = 0.01 Kruskall Wallis). The middle area had the highest diversity while the upper area showed the most abundance of species.
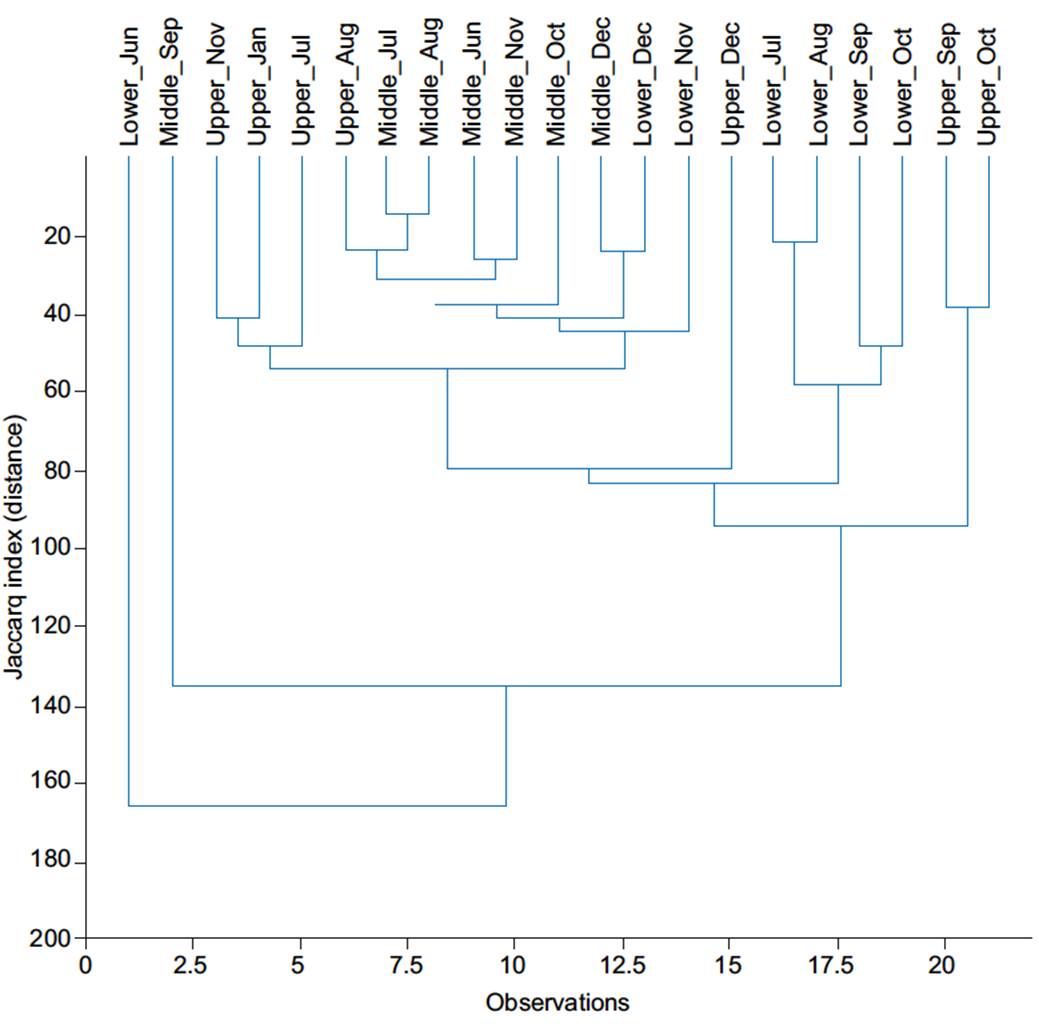
The similarity of the EAM communities across sampling sites was assessed using cluster analysis. The results indicate that samples collected in the lower area were the most dissimilar, and a relationship exists between the sites in the upper and middle areas (Fig. 5).
Biological indexes (Table I) showed that diversity is medium in the upper and middle areas, with high dominance and low equitability, while the lower area was the least diverse. Water quality was also evaluated considering the presence of EAM families and their tolerance to pollution by calculating the BMWP quality index (Fig. 6).
TABLE I BIOLOGICAL INDEXES IN LAS PIEDRAS RIVER
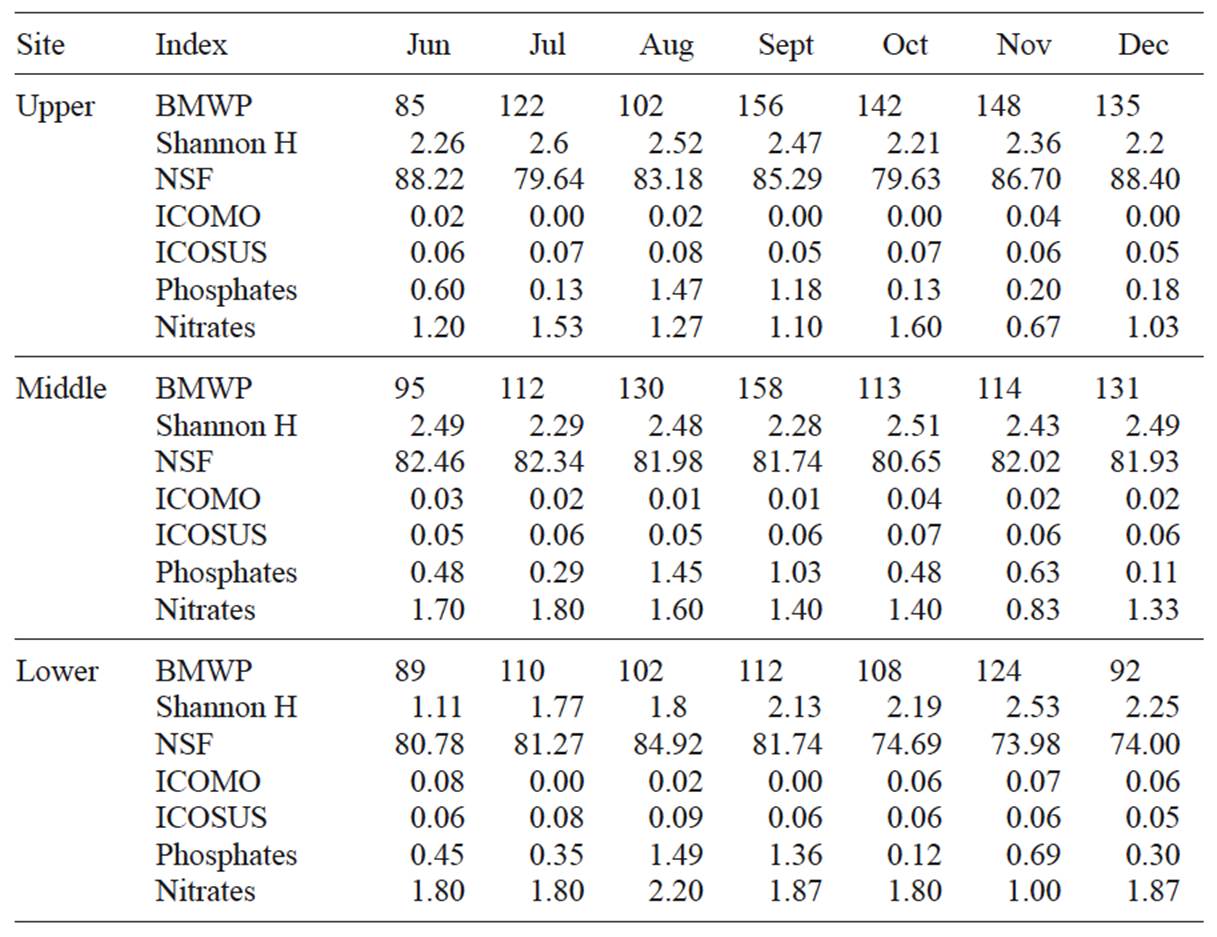
* The highlighted values indicate some alteration processes. BMWP = biological monitoring working party index, NSF = National Science Foundation index, ICOMO = organic pollution index, ICOSUS = suspended solids index
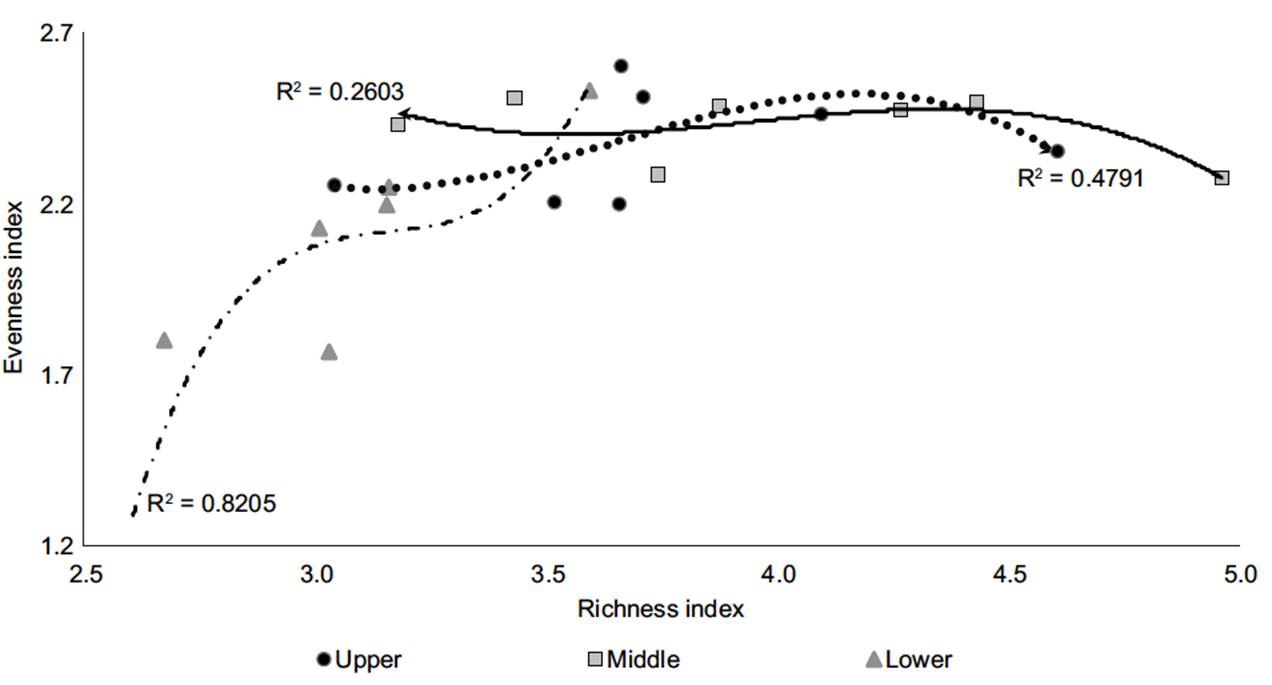
Fig. 6 Coefficient of determination (R2) for diversity indexes. Evenness (Shannon H´ index) and richness (Margalef index).
The next figure shows the correlation by the sample site between the specific richness and the evenness diversity, the R2 indicated the high values for the lower zone (0.82).
Human activities impact
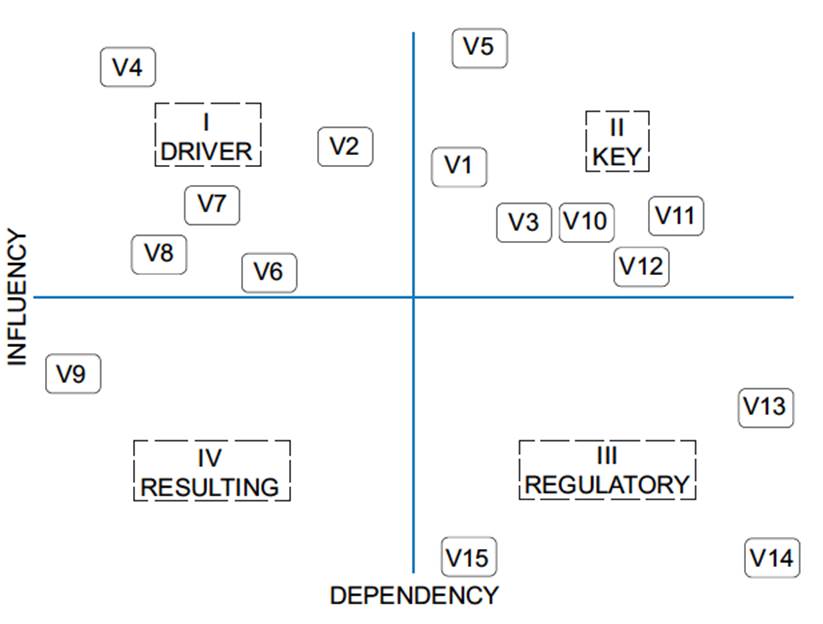
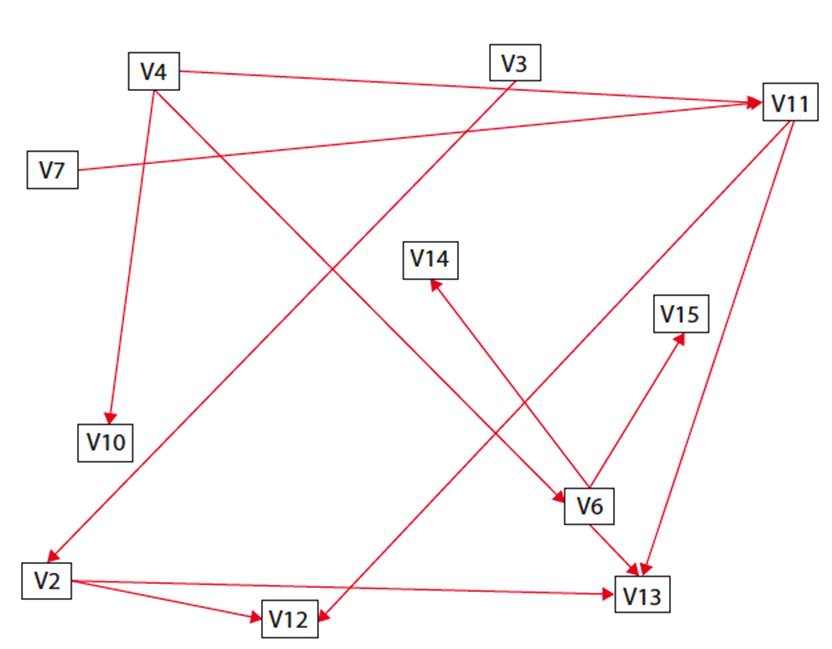
According to the evaluation matrix, anthropogenic activities were observed: riparian area transformation (V1), replacement of native vegetation by production areas (V2), landscape fragmentation (V3), agriculture techniques (V4), crop field’s expansion (V5), fertilizer use (V6), community organization and participation (V7), livestock (V8), vehicular traffic (V9), crop production (V10), forest conservation (V11), local climate variability (V12), runoff, soil erosion and nutrient loss (V13), changes in the physicochemical water quality (V14), and modification of the EAM community (V15).
The distribution of the driver (I), key (II), regulatory (III) and resulting (IV) variables in the direct influence/dependency plane (Fig. 7) and the map (Fig. 8) represents the variables that exert direct influences in the basin transformation and ecological condition. In this sense, the agricultural techniques determine the crop production and the fertilizer use which cause changes in the physicochemical water quality and modification of the EAM community. The social organization and the agricultural techniques affect the forest conservation and this with the replacement of native vegetation to production areas, influence the local climate variability and the runoff, soil erosion and nutrient loss (Ruiz et al. 2015).
The natural land-cover in the basin ranges during the period 1989-2010 showed a reduction of 49 ha in the Paramo, and ~850 ha in succession zones (shrublands and riparian vegetation). As a result of agricultural activities expansion, crop fields increased by 9.4 % in the same period. Crop fields are spatially aggregated and their extension increases towards the lowest area of the basin. In the upper area, field crops occupy 1.9 %, 7.2 % in the middle area and in the lower basin extend to 16.1 %. Those situations modify the ecological relationships between the components in the river. This can be seen by relating the value of the NSF water quality index, and the nutrient concentration (PO4) with the percentage of crops, which has a positive relationship (Fig. 9).
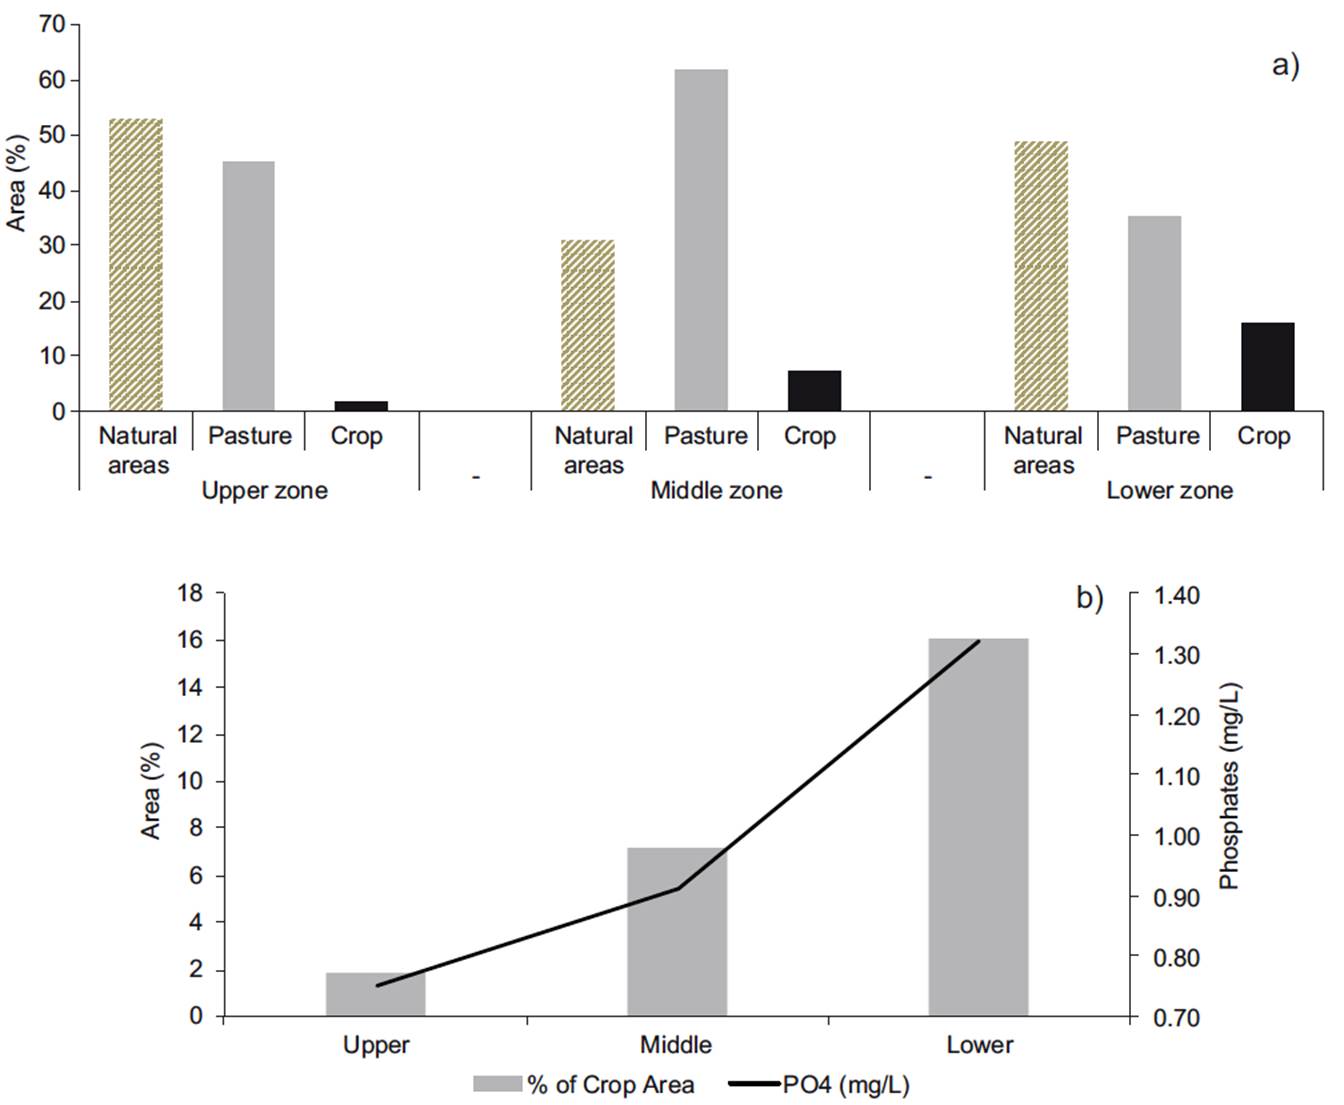
Fig. 9 Percentage of landcover areas by zones (a) and nutrient concentration (PO4) related to % crop area by zones (b)
The forest fragmentation and the crop field’s expansion increase the erosive processes, concomitant losses of organic matter, nutrients and other key elements involved in soil’s fertility. Soil is also affected by land preparation for agriculture; tillage tools or machinery turns it and this modifies the function of the soil pore matrix, thus, changing the structural stability (Otero et al. 2011).
Additionally, the management activities are limited by the land tenure conflicts, this situation becomes more complex in extreme climatic events such as ENSO (El Niño Southern Oscillation), which has generated the construction of open channels along the basin to carry out water for domestic, agricultural and fishery uses, affecting the ES in the watershed (Valencia et al. 2014).
Multivariate statistical analysis
Negative correlations with the spatial variation were identified between the phosphates in the surface runoff and quality-diversity indexes (physical and chemical NSF and Shannon (H´) and Margalef biological diversity indexes). Also the nutrient input varies with the elevation in the basin. In the lower area there was an increase of the phosphates concentration, the dominance of some EAM species and the pollution according to the NSF index (Fig. 10).The climatic condition was negatively correlated with pH and phosphates variables along the basin.
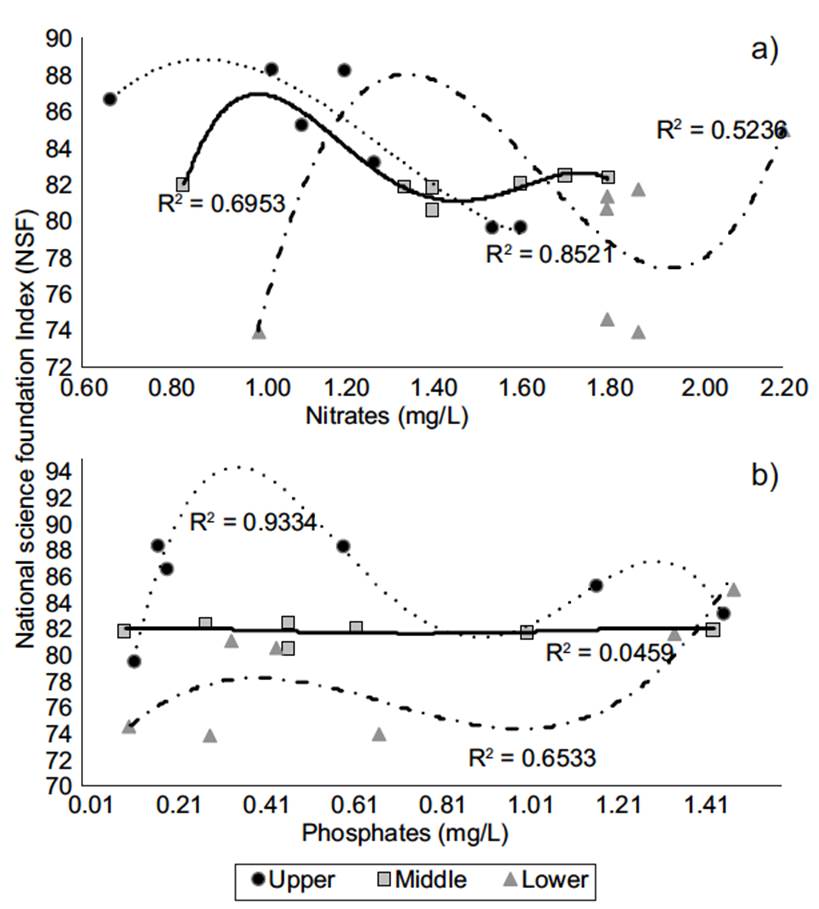
Fig. 10 Nutrients variation in contrast to the National Science Foundation index (NSF): a) nitrates variation, b) phosphates variation. R2 = coefficient of determination
Positive correlations were found between the nitrates in the surface runoff with the pH since the nutrient becomes soluble in acid conditions such as in the Andean soils. Additionally the correlation between phosphates in the surface runoff with the diversity-quality indexes, results from the agricultural activities near the river as it can be seen in the crop spatial distribution map (Fig. 2), with major density in the lower zone of the basin.
According to the multivariate tests (Fig. 11) there were differences between the sample sites, in the upper zone the biological indexes were high, the middle zone was influenced by surface runoff parameters (pH and nitrates) and the phosphates in the stream, finally in the lower area the correlated variables were an abundance of EAM and nitrates in the river.
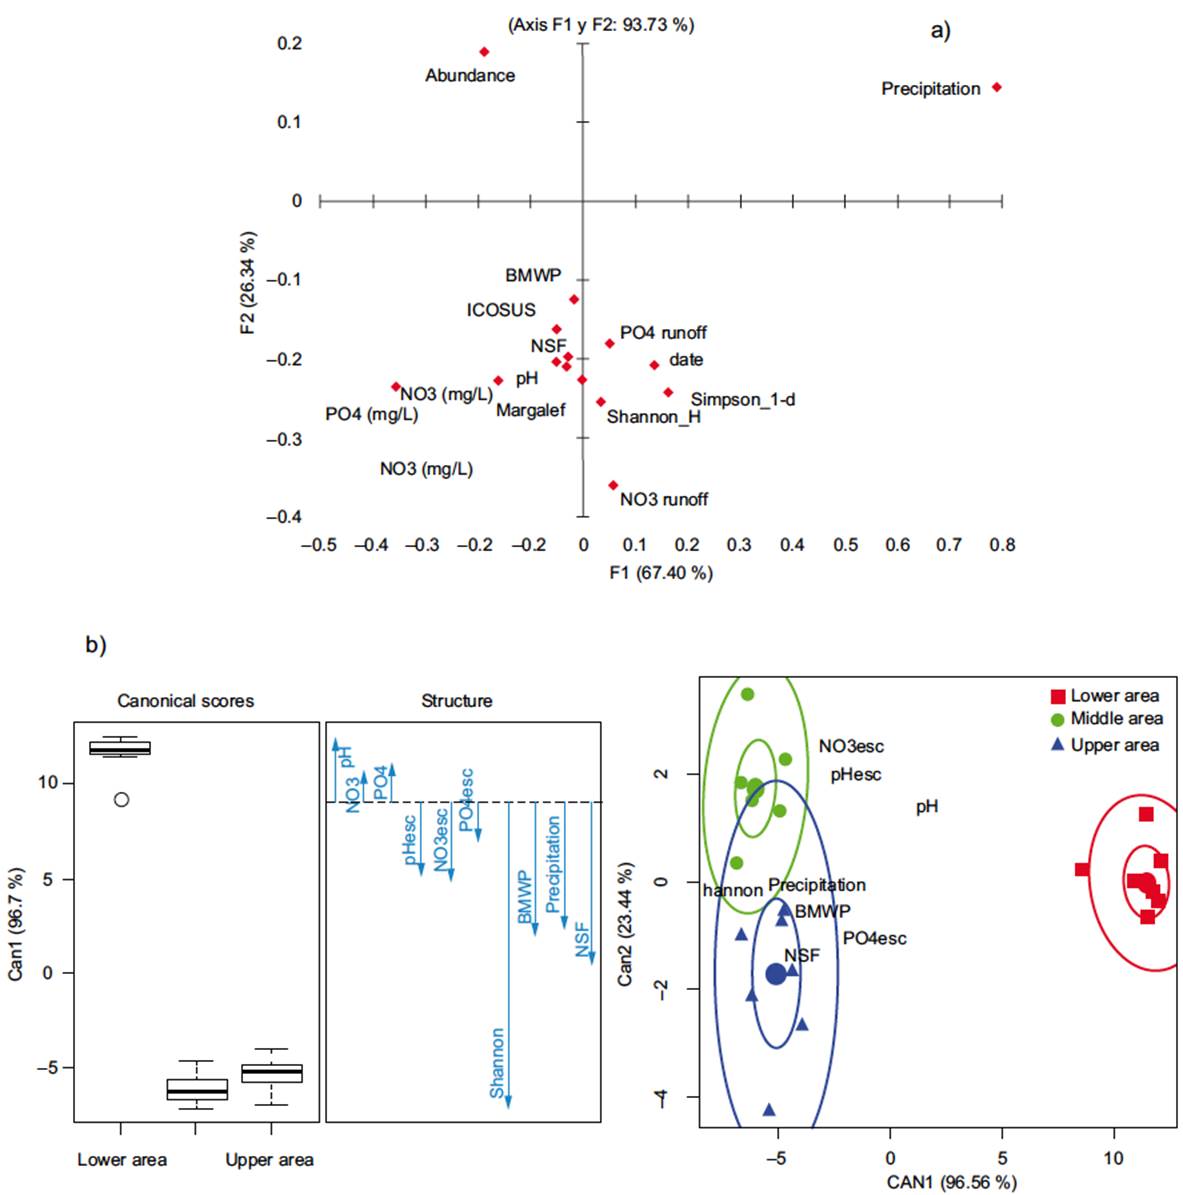
Fig. 11 Statistical multivariate analysis: a) factorial analysis, b) linear discriminant analysis (LDA)
Peasants determine the land use and management depending on the climatic variation, at the same time this management drives the movement of phosphates from soil to water affecting the pH and the water quality as is demonstrated by the biological index. The pH in surface runoff (acid) was directly correlated with the water pH (basic) and negatively related with the biodiversity (factor 2).
DISCUSSION
Water quality analysis
The physicochemical variations were within the optimum limits for the development of EAM communities favored by the high depuration capacity of the river as the oxygen saturation indicates (≤ 80 %). When the temperature is low (12.30 ºC), the oxygen level rises (8.23 mg/L), this occurs in the months of highest precipitation (October and November > 120 mm). During the periods of low rainfall (August and September > 28 mm), the temperature increases (Δ 5 ºC) while oxygen decreases (> 7 mg/L) showing an inverse correlation between them.
The lowest values of pH (6.59 pH units) in the upper area during the periods of high rainfall were caused by the increase of suspended particles and organic matter, which contributes to surface runoff from fields with unprotected bare soil exposed to the direct impact of raindrops. In this condition the soil will be easily transported by surface laminar flow favored by the topography in the basin, which has long (> 30 m) and steep terrain slopes (up to 50 %).
This is a milestone for the basin management because if the rate of surface runoff is high this can go from a transportation detachment factor to a more serious problem by increasing pollution in rivers and aquatic ecosystems. The average pH (7.2) in the stream indicates a neutral condition, but the variations in the upper area evidence a threat in supporting ecological processes such as photosynthesis, respiration, decomposition and biodiversity (Shannon H´ 2.6) which are related to climatic variation and fertilizer uses in crops.
The turbidity concentration varies according to the altitude of the basin, it was the lowest in the upper area 1.30 nephelometric turbidity units (NTU) and then increased slightly toward the lower area 1.90 to 4.70 NTU. This is related to crop localization and the reduction of riparian vegetation favoring the erosion; according to a study in the river this fringe is composed by 55 species, 43 genus, 31 families and the Margalef index denotes medium biodiversity (3.3) (Recaman 2006).
An atypical value for turbidity (5.90 NTU) was found in the lower area during October, the high rainfall month (44.18 mm/h), resulting by the increased dragging of sediments, erosion and solid transportation. Overall, reported values of turbidity were low (1.30 to 5.90 NTU), which do not affect the development of aquatic biota. Physical variables of conductivity and turbidity are within the standard values for human consumption, agricultural and livestock activities.
The nutrient analysis in the basin revealed a relationship with agriculture, as demonstrated by phosphate concentrations exceeding 1 mg/L (Henle et al. 2008, Hahn et al. 2012), considered as pollution indicator (Van Oudenhoven et al. 2012). The input of the nutrients comes mainly from agricultural activities and livestock management as observed in the fields adjacent to the sampling sites. Nitrates and phosphate concentrations were high during months with lower rainfall when the river reduces its dissolution capacity.
The basin had high concentrations of oxygen (6.91 to 8.33 mg/L), low temperatures (12 ºC to 17.70 ºC), and a neutral pH, there nitrogen could be found in its oxidized state. The presence of nitrites (< 0.1 mg/L) is related to water pollution (Liu et al. 2014) caused by the drag of agricultural inputs and livestock (manure), accentuated in periods of low rainfall (Miserendino et al. 2011).
The nitrate variation was higher than nitrite (NO- 2) and ammonium (NH4), denoting high availability of nutrients for primary producers but without eutrophication (Mouri et al. 2011). The temporality influenced the nitrate concentrations during rainy season; the nitrites were highly soluble in acid andean soils (pH ranges from 6.1 to 6.7), which facilitates its transportation by surface runoff to the mainstream.The Andisols porosity retains water during drought periods and the phosphates attaches to iron and aluminum (Otero et al. 2011). Moreover there was a positive correlation between physicochemical parameters (conductivity, nitrates) and sample sites due to the increase concentration toward the lower area.
Although nitrite concentrations were low (< 0.1 mg/L), these were higher in the lower areas of the basin, due to intensification of agriculture that provides the excessive organic matter during rainfall events. Similarly the nutrient input into water streams was the effect of runoff from crops with the liberation of stable organometallic complexes from Andisols, which was left, exposed by the agricultural techniques (Chang 2008, Mouri et al. 2011).
The salinity (> 50 µS/cm) indicated mesotrophic conditions not expected in high mountain basins. However, a degradation process was noted in water quality in the lower areas by the increase of conductivity, according to TDS and ions concentrations (nitrate, nitrite and phosphate). In extension, anthropogenic pressures in the lower area caused fluctuations in the ionic activity, mainly by agricultural activity (Mouri et al. 2011). It was especially evident during the periods of low and medium rainfall.
The physicochemical parameters outlined above were related to the biological conditions in the river (Lock et al. 2011, Molozzi et al. 2012). Diversity of habitats and food supply favor the emergence of stenotypes’ species such as Atopsyche, Tricorythodes, Elmoparnus, Chimarra, Corydalus, Limnocoris. The presence of euritipyc organisms like Thraulodes, Anchytarsus, Hidropsyche, Helicopsyche and Rhagovelia in the sample sites, indicates alteration in the biological quality caused by the availability of organic matter, which increases the presence of Chironomidae, Muscidae and Tipulidae families.
The analysis of β diversity by Jaccard coefficient showed an isolated sample site in the lower basin area with EAM of the orders Diptera (tipulidae), related with pollution conditions (Lock et al. 2011, Molozzi et al. 2012). In contrast, other sampling sites had a relationship up to 50 % with dominant orders such as Coleoptera, Ephemeroptera and Trichoptera.
The results of Alfa diversity for the benthic community showed an alteration process in water quality, with proliferation of some pollution tolerant taxonomic groups (Simulium, Tipula). During the high rainfall months the Trichoptera order was dominant; represented by the Hidropsychidae, Leptophlebiidae and Chironomidae families, and its genders Smicridea Thraulodes, and Chironomus respectively, which are indicators of oligomesotrophic water (Lock et al. 2011, Villamarín et al. 2013).
The lower area of the basin had the lowest diversity and evenness (Shannon 1.1) with high dominance of species (B. Parker 0.7) especially of the Diptera order (> 10 % of all collected organisms) with predominance of detritivores of the Muscidae family and the collectors of the Chironominae family and Simulium gender (Cummins Merrit and Andrade 2005). Based on the response to organic pollution (saprophytic approach), the lower area is characterized by high concentrations of organic matter, which is favored by agriculture activity and pasture fields located in the middle area.
In general, the water quality in the Las Piedras River was good. However, there was an increase in the concentrations of ammonia, nitrite and pH in November, and consequently the alteration of the water quality index NSF (73.98). Another important variable was the bacteriological pollution with presence of fecal coliforms in the whole basin. This was a relevant finding considering that the water is mainly use for human consumption and agriculture by local population.
Human activities and water quality
The results of physicochemical and biological analysis evidenced the influence of agriculture activities on water quality in the stream. Thus pasture management for continues livestock in the basin has generated soil compaction, changes in the physical, chemical and biological processes affecting the runoff and the consequent loss of structural stability which increases vulnerability to erosion and mass removals (Buytaert et al. 2006). For Andean pasture soils erosion has been estimated by 0.04 t/ha/month (Otero et al. 2011). Additionally, free access of cattle to the streams was observed with inputs of bacterial pollution from excreta, which affects the water for human consumption (García and Brown 2009, Rojas et al. 2011).
The agricultural production areas in the basin became more extensive but forest and vulnerable ecosystems are at a loss (Martínez and Figueroa 2009). Consequently the use of agrochemicals intensifies the erosion and pollution by the changes in the pH and the carried by runoff of nitrates and phosphates which increases the concentrations of nutrients in the streams; a study reported lost soils in Andean basins with agricultural uses of 0.39 t/ha/month on average (Jordán and Martínez 2008). In order to keep erosion under reasonable (i.e., soil loss rates below 0.18 t/ha) limits in the basin it is necessary to reduce the terrain slope gradient below 40 %, increase plant cover above 35 - 40 %, and evaluate erosion hotspots through models and multi scale (Baigorria and Romero 2007).
The dragging of nutrients by surface runoff had an increase during the rainy months of November and December. The high precipitation, the bare soils and the crop techniques on steep slopes with the crop arrangement up to 15 m in length favored the erosion in this Andean basin (Otero et al. 2011, Mosquera et al. 2014). Also forest fragmentation generated more vulnerability to erosion and affected the hydrologic cycle regulation as is widely explained in researches, the soil exploitation increased the concentration of pollutants in water sources, limits the water supply and alters the biodiversity in the basin (Boelens 2012, Ouyang et al. 2014).
With respectw to water quality and the Integrated Resources Water management (IWRM) policies, the Colombian regulation states protective forest reserve areas for the conservation and preservation of water (law 79 of 1986, in the Article 1). Similarly, IWRM strategy in the Andean basins extends these areas to all existing forests and natural vegetation in a strip not less than one hundred meters wide each side of the beds of the rivers, creeks and streams. The law’s purpose was to maintain the retention and filtering runoff processes while avoiding the input of sediments to the mainstream. However, the spatial analysis in this research demonstrated the problems with the riparian strip due to the not correspondence with the established legislation.
In the socio political context the local institutions have taken special care in the use and management of these water resources. They have engaged local farmers and indigenous communities in environmental education processes (PNUD 2010, Figueroa et al. 2012). Therefore the influence of some agriculture practices currently performed in the basin should be considered since the evidence of high nutrient concentrations and pathogenic organisms limits resource availability for human consumption, benthic communities and aquatic ecosystem trophic dynamics to long term.
CONCLUSIONS
The transformation of this Andean basin results from productive activities, mainly to attend the needs for food, shelter, and economic income of the social groups that inhabit the territory. But this process of land occupation and appropriation of the natural resources and ES had been addressed to primary production. Therefore, agriculture is the main driver of pollution and degradation of water resources, affecting future water supply availability. Specifically planting techniques, use of chemical inputs, water supply, and crop irrigation are modifying the physicochemical and biological characteristics of the river.
The variations in the concentration of nitrates, phosphates and the fecal coliforms bacteria are related to pollution, limiting human water consumption and biodiversity. In this case, the presence of Ephemeroptera, Plecoptera and Trichoptera orders shows good biological water quality conditions in general; but the nutrient inputs, as a result of inadequate agricultural activities, allow the coexistence in some sites of pollution-tolerant organisms with species of the Simulium, Tipula, Dytiscus and Physa genders, which threatens the water availability for domestic usages.
The discriminant analysis shows that the lower zone is characterized by the high concentration of nitrates, phosphates and pH while rates are low diversity and quality (96.7 % of variance), in this sense the critical areas showed increased nutrient concentrations toward the middle and lower part of the river where the crop aggregation is greater.
The pollution processes are accentuated in the lower basin area especially by agriculture, livestock, and fisheries, limiting the ES of water supply for human consumption. The presence of coliform and nutrient concentrations also limits the supply for domestic use, a situation that is considered by the water supply industry for water management purposes.

