


 text new page (beta)
 English (pdf)
 Article in xml format
 Article references
 Send this article by e-mail
 Cited by SciELO
  Similars in
SciELO
Similars in
SciELO 
 Permalink
INTRODUCTION
The sugarcane crop is easily adaptable to tropical and subtropical climates and is of economic importance in more than 100 countries around the world (Rein et al. 2011). Sugarcane cultivation has caused enormous changes in land use with the removal of tropical forest and other vegetation types (Scherr and Sthapit 2009). Some practices related to sugarcane such as burning bring with them the further decline of air and soil quality and affect the regional climate due to variations of soil temperature (Sandhu et al. 2013) , which can be reflected for example in the heat flux and moisture transport at this scale. The common practice of sugarcane burning methods, before and after the harvest, is an anthropogenic source of emissions of greenhouse gases (GHG) and aerosol to the atmosphere that may also cause respiratory toxicity (Franca et al. 2012, Mazzoli-Rocha et al. 2014) . Moreover, the procedure includes the strip-page of weed from soil, nutrients uptake, and control of pests among others (Hernández-Valencia and López-Hernández 2002). The sugarcane burning can increase its efficiency if the moisture levels in the fuel are poor (Chen et al. 2010, Franca et al. 2012).
Soil quality depends on its capability to accept, store and recycle nutrients and water resources in maintaining production yields without affecting the environment (Haynes 1997), but the sugarcane burning can affect several of these factors. Particularly, the process of combustion during vegetation burning contributes to reduce the organic matter in the soil due to the release of nutrients such as carbon and nitrogen. This can be detrimental to crops if the nutrients do not recuperate through natural mechanisms such as rain, atmospheric fixing, or by using nitrogen fertilizers (Hernández-Valencia and López-Hernández 2002).
Potential evapotranspiration (PET) is an indicator of the maximum evaporation from the soil and plant transpiration and depends on weather conditions of the study region where factors such as temperature, solar radiation, and water availability among others have an important role. There are several methods to calculate PET (Tukimat et al. 2012, De Carvalho et al. 2013), where a variety of parameters are used to analyze the atmospheric forcing (Bautista et al. 2009). Comparing the change in the water vapor concentration that occurs in the air with precipitation levels, the water flux between the atmosphere and the soil surface, it is used (Swenson and Wahr 2005) to know the potential rainfall availability at the surface (SENASICA 2010). In humid regions, such as in the Huasteca region in Mexico, land use change from natural vegetation to cropping and grazing occurs (Reyes et al. 2005). These changes may cause variations in humidity and precipitation levels, affecting negatively the availability of water resources, leading to an increase in drought periods (Algara-Siller and Contreras-Servin 2009).
There are several ways to quantify drought periods, such as the Palmer drought severity index (PDSI), the drought severity index (DSI), and the standardized precipitation index (SPI) among others. To calculate the PDSI it is necessary to know the precipitation, the temperature and the soil moisture (Dai et al. 2004). However, in some regions such as San Luis Potosí State, Mexico, this last parameter is not measured by weather stations. On the other hand, the DSI method is defined as a statistical analysis based on the deficit of precipitation which is commonly calculated with data usually registered by regular meteorological stations. Since it does not depend on the type of climate, it can be applied to any region (Hernández and Valdez 2004, Algara-Siller and Contreras-Servin 2009).
Methane (CH4) and nitrous oxide (N2O) are released to the atmosphere by agricultural activities significantly contributing to total emissions of GHG and to radiative forcing due to their effectiveness to absorb heat compared to carbon dioxide (CO2) (Scheele and Kruger 2006). The IPCC developed a series of methodologies to quantify emissions. Inventories of GHG in Mexico have included agricultural waste burning, dominantly of sugarcane crops (Ordóñez et al. 2012). However, these inventories are still deficient in variables that have an impact on the loss of soil nutrients. It is also necessary to investigate the fraction of carbon in organic waste to obtain national emissions factors (Ordóñez and Hernández 2006) and the annual amount of organic matter and carbon in different types of soil (Sánchez-Hernández et al. 2011), among other issues. The calculation of C and N released during sugarcane burning depends on parameters such as fraction of burned area, aboveground biomass density and aboveground burned biomass, among others. These values can be obtained specifically for the study region (Tier 2) or by using the IPCC proposed standard values (Tier 1) (IPCC 1996).
Mexico is the seventh-largest world producer of raw material for the sugar industry. Sugarcane fields cover up 790 650 ha supplying raw material to 57 sugar mills, located in 15 states and 6 regions f Mexico (Fig. 1 and Fig. 2). Sugarcane represents 3 % of total Mexican crop area (Aguilar-Rivera et al. 2012, Aguilar-Rivera et al. 2013, CONADESUCA 2014). The conventional harvest system in Mexico starts when the sugarcane is burned before manual cutting is carried out in order to eliminate dry foliage and to facilitate the harvest process. After removing the cane, there is a waiting period until the remaining foliage is completely dry. Finally, a second burning is applied. The pollutants that are emitted to the atmosphere are nitrogen monoxide, carbon monoxide, sulfur oxide, hydrocarbons, carbon dioxide and other substances (Vilaboa and Barroso 2013, Sentíes-Herrera et al. 2014).
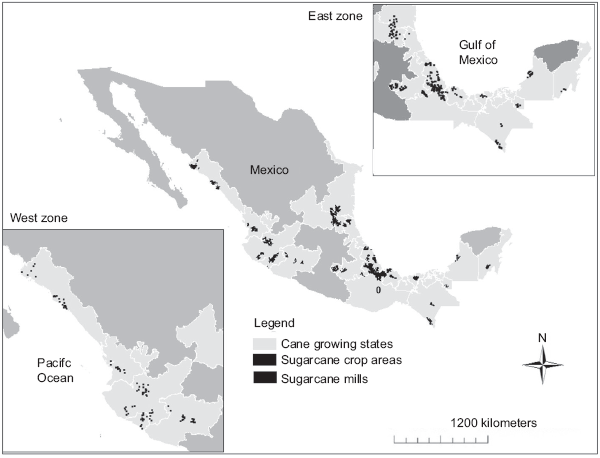
Fig. 1 National distribution of sugarcane production. Sugarcane fields shown in the central picture and sugar mills shown in the East zone and in the West zone pictures (author's own production)
The Mexican government has implemented efforts to decrease the burning of sugarcane through the National Program of the Sugarcane Agroindustry (PRONAC) (SEGOB 2014), in which, for example, for the period 2006-2012 the target was to reduce the cane burning from 90 % to 70 % (SAGARPA 2007, FIRCO 2012). Particularly, in the cane region of San Luis Potosí State, green harvest is practiced in 5 % of the total cane production. Additionally, there are experimental cane fields in which the government implement strategies that contribute to the gradual recovery of ecological balance (CNID-TACHP 2014).
On the other hand the use of edaphological mapping and satellite imagery allow identifying spatial attributes of soil fertility for sugarcane crop. The method is based on physical, chemical and biological soil properties affecting the production levels in a specific sugarcane region (Ortega and Corvalán 2007, Quintero-Durán 2008, Geissen et al. 2009, Aguilar-Rivera et al. 2010, Aguilar-Rivera et al. 2013). The soil characteristics are better classified when taking into account the weather conditions that interact directly with sugarcane crops, showing a robust basis for a classification on edaphological and climatic conditions under which the cane cultivation takes place (Subiros 2002, Sánchez-Hernández et al. 2011), thus the term "aptitude levels" is adopted from now on.
According to previous studies, during the period 1990-2010 while the field performance (production yield) decreased, the harvested surface increased substantially (Aguilar-Rivera et al, 2012, Aguilar-Rivera et al. 2013). The hypothesis is that changes in the land use in Huasteca Potosina and in the water flux between soil and atmosphere have contributed to the increase in the release of C and N to the atmosphere. The objective of this research work is to analyze the relation between the cultivated hectares and production of sugarcane. Likewise, explain its behavior and interpret the contributions of N and C released to the atmosphere for burning sugar cane in association with events and meteorological parameters involved in the flux of water between soil and atmosphere such as drought, evapotranspiration and rainfall.
MATERIAL AND METHODS
Sugarcane production conditions at the Huasteca Potosina region
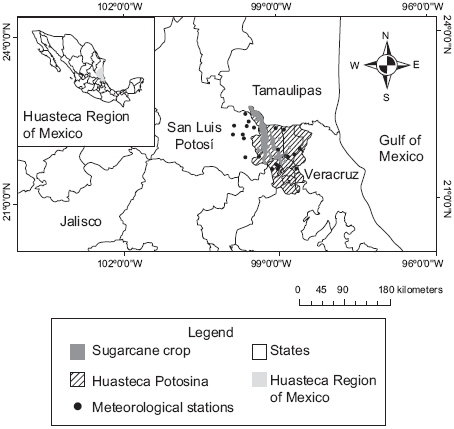
The Huasteca region is located in the Central-East part of Mexico covering around of 65 675.85 km2 (CONABIO 2012). An important area of this region is called Huasteca Potosina, located in the eastern part of San Luis Potosí State (Fig. 2). This region shows year-long rainfall conditions most of the year where its maximum precipitation values are in the months of September and July and range from 200 to 500 mm. Likewise, highest monthly mean temperatures varies between 22 °C and more than 40 °C and the coldest months have temperatures fluctuating from -3° C to 18 °C (Pineda et al. 2006). The predominant type of soil is argillaceous Pelic Vertisol (Aguilar-Rivera et al. 2012). This kind of soil reaches deep in the ground, and develops within dry to sub-humid climates. Although it is not considered as a fertile soil, it has been adapted to sugarcane fields with an agricultural irrigation system (SEMARNAT 2013).
The plant water availability depends largely on soil-atmosphere interaction. In Huasteca Potosina, the study of these elements is carried out by the use of the drought severity index (Hernández and Valdez 2004, Algara-Siller and Contreras-Servin 2009), precipitation (P), potential evapotranspiration (PET) and the relation between the latter two parameters P-PET to investigate the net flux of water between the soil and the atmosphere (Swenson and Wahr 2005, SENASICA 2010).
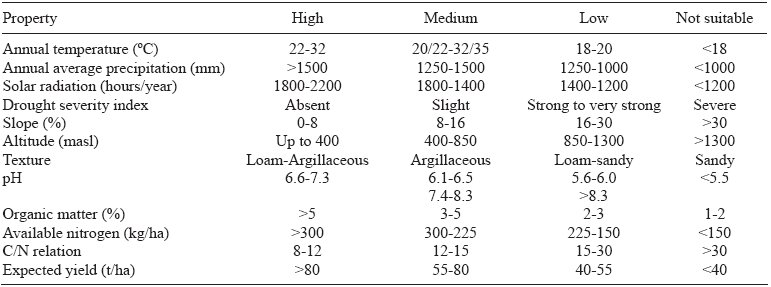
The soil parameters based on physical, chemical and biological properties and their relationship with those weather conditions that contribute with sugarcane production levels are shown in Table I and they are also used as a starting point to analyze the stages under which carbon (C) and nitrogen (N) are released in the sugarcane burning. This approach includes the classification of production per hectare based on aptitude levels (Table I), the relationship analysis between DSI and PET and the release of N and C during the burning process related to the availability of water in the ground (P-PET).
Table I Edaphological and weather conditions for sugarcane production (aptitude levels) (Aguilar-Rivera 2013)
Sugarcane production data and harvested area used to classify aptitude levels for sugarcane crop for the period 1990-2010 were obtained from the Agro-food system reference information software (SIACON 2010) administrated by the Servicio de Información Agroalimentaria y Pesquera (SIAP) (Agro-food and fishery information system) from the Mexican government. Weather data, specifically precipitation and maximum and minimum temperatures were collected from the Base de Datos Climatológica Nacional (CLICOM) (National Climatological Database) (CLICOM 2014) whose data are administrated by the Servicio Meteorológico Nacional (NMS) (The National Meteogological Service).
Thornthwaite potential evapotranspiration and drought severity index
Potential evapotranspiration represents the maximum possible evapotranspiration under existing circumstances. There are few models for its quantification (Tukimat et al. 2012, De Carvalho et al. 2013). In recent years Thornthwaite method has been utilized to calculate potential evapotranspiration, particularly for humidity balance studies (SEMARNAT 2009, Rivas et al. 2011). Moreover, it has shown great reliability during rainy periods, disregarding any adjustment (Bautista et al. 2009, Gutiérrez et al. 2013). Based on this evidence, due to the humid climate of the Huasteca (Pineda et al. 2006) and data availability, the calculation of potential evapotranspiration parameter by this method is the selected choice for the present study.
where Hs is maximum number of sunlight hours, dm is number of days per month and ET is evapotranspiration without corrections, which in turn is rewritten as
where the constant C=16, tmed is monthly mean temperature, and I is the annual heat index expressed as I = Σ i where
Finally, a is an exponent on a logarithmic basis for the annual index, where both are related by a third polynomial order
In the same way, the precipitation (P) minus the potential evapotranspiration (PET) allows the calculation of the net flux of water between soil and atmosphere or the potential rainfall availability, namely P-PET (Swenson and Wahr 2005, SENASICA 2010).
The drought severity index (DSI) shows the percentage of rain scarcity in a year with respect to average rain values and for every meteorological station. It is calculated from the following statistical analysis (Hernández and Valdez 2004, Algara-Siller and Contreras-Servin 2009)
where
Drought severity index comprises seven levels as shown in Table II. These levels show that the DSI is strong when the negative value increases, while the strength of DSI decreases when it is close to zero.

Calculation of carbon and nitrogen release
The parameters based on IPCC guides to calculate the release of C and N values during the sugarcane burning, correspond to the information available for San Luis Potosí state. The amount of waste and the amount of dry residue described in equations (7) and (8), the total burned biomass (equation (9)), and C and N release (equations (10) and (11)) are obtained by the IPCC (2000) methods. Some variable values used in the equations correspond to the geographical region, which contains the study area.
After reviewing previous studies, it was found that the value of 0.2230 corresponding to fraction of C in waste (FCW) (Table III) obtained from Mexican reference (Ordóñez and Hernández 2006) represents 50 % of the IPCC value. This value has not been verified for sugarcane crops in the region of Huasteca Potosina. Likewise, there are other parameters such as fraction burned in fields (FBF) and fraction oxidized (FO) that have not been calculated for Mexico. These are the main reasons why in this study the reference data to calculate the C and N release during the burning of sugarcane were obtained using the values of the IPCC methods.
Table III Reference values from intergovernmental panel on climate change manuals for carbon and nitrogen releases during the sugarcane burning process
| Variable | Values (IPCC) | Values (studies from Mexico) |
| Residue-crop ratio (RCR) | 0.16 | 0.15 (Ordóñez and Hernández 2006) |
| Dry matter fraction (DMF) | 0.83 | 0.78 (Ordóñez and Hernández 2006) |
| Fraction burned in fields (FBF) | 1 | Not calculated (was used the IPCC value) |
| Fraction oxidized (FO) | 0.9 | Not calculated (was used the IPCC value) |
| Fraction of carbon in waste (FCW) | 0.4325 | 0.2230 (Ordóñez and Hernández 2006) |
| Nitrogen-carbon ratio (NCR) | 0.01 | Averages in the range 0.033 to 0.074 (Aguilar-Rivera 2013) |
The Mexican reference values of nitrogen-carbon ratio (NCR) are obtained from the inverse of C/N, shown in Table I as a first approach, while the value used in this research was obtained from IPCC methods (Table III; IPCC 1996). Also, the AP variable in equation (7) corresponds to sugarcane annual production for Huasteca Potosina. Finally, the values of residues-crop ratio (RCR) and dry matter fraction are proposed by Ordóñez and Hernández (2006).
RESULTS
Annual aptitude level classification for sugarcane crop
The relationship between extension of harvested sugarcane, its production per hectare considering both irrigated and rain-fed, and its relationship to aptitude levels (Table I) is shown in Figure 3. The mean level was between 55 and 80 t/ha.
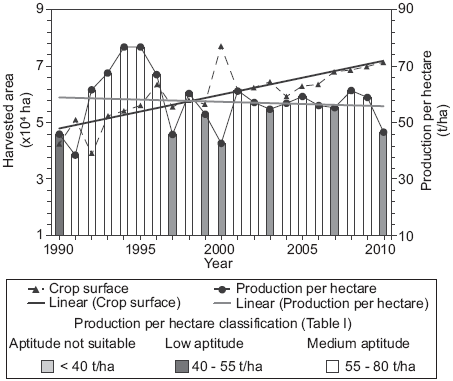
Fig. 3 Aptitude levels for sugarcane for the period 1990-2010 based on production levels given in t/ha. The correlation coefficient between the harvested area and the production per hectare is -0.1 (author's own production)
The slope in the production per hectare is negative and the trend of the crop surface is towards growth, hence the correlation coefficient between both parameters is very small (-0.1) because the aptitude levels of sugarcane keep a relation with specific weather and soil conditions. For example, relating the production per hectare (Fig. 3) to aptitude levels during the study period, the DSI presented a change from slight to severe (Table I). Also, the C/N relation ranged from 12 to 30 affecting the annual production per hectare of this crop (Table I). Thus, an increase in cultivated hectares does not imply growth in sugarcane production (Fig. 3) because of the influence of soil and climate parameters such as PET, DSI, PRA (potential rainfall availability) and the release to the atmosphere of C and N as will be discussed further.
Potential evapotranspiration (PET) and drought severity index (DSI) analysis
While the PET tendency increased in the 19902010 period, the DSI remained practically constant with a very strong severity index ranging between -0.4 and -0.5 (Table II) and consequently their correlation coefficient was 0.6 (Fig. 4). However, for the first eight years it reached a value of 0.8 due to an increase of DSI and a decrease of PET because of deficit precipitation and decrease of water flux to the atmosphere respectively. For the period 1998-2010 this correlation decreased to 0.45 due to the increase of both parameters. This phenomenon is mainly present in 1999 where both parameters had contrast high values.
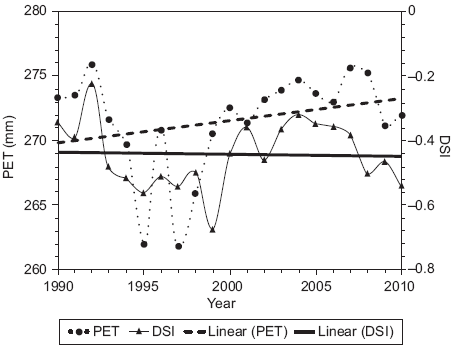
Fig. 4 Comparison between DSI (drought severity index) and PET (potential evapotranspiration) for the 1990-2010 period. The correlation coefficient between both parameters is 0.6 (author's own production)
In contrast, the annual variation levels for the DSI ranged from slight (-0.2 to -0.35) to severe (-0.5 to -0.6) drought conditions as observed for the years 1992 and 1999 respectively (Fig. 4). These calculated values from the DSl method are consistent with the information obtained from yearly production per hectare and aptitude levels of sugarcane (Table I and Fig. 3).
As mentioned above, the rise of evaporation and transpiration from soil and plants respectively increase the potential evapotranspiration. Also, if both phenomena are combined with an increase of precipitation levels as occurred from 1990 to 1992, then the DSI values decrease. However, in 1993 and 1994 the precipitation levels decreased by 60 % compared to 1991 (i.e. from 1529 mm to 912 mm) helping to increase the DSI and reducing the PET (Fig. 4) due to plants and soil not having the same water availability as in previous years.
The DSI indicated a severe drought event (-0.5) in 1995 and 1997 where lowest PET values were registered with 261.9 and 261.8 mm respectively (Fig. 4). Meanwhile, the same years presented low accumulated precipitations of 879 and 905 mm. These values are in contrast with the highest precipitation of 1529 mm in 1991, 1516 mm in 1993, 1411 mm in 2007 and 1464 mm in 2008, where there was a greater availability of water.
Year 1996 reveals that a severe drought condition of -0.5 is accompanied by a high PET of 271 mm. This value was derived from the second maximum temperature (30 °C) in the year of the study period. Likewise, the highest mean temperature of 31.8 °C corresponds to 1998 which is reflected in an increase of the PET value (266 mm) with respect to 1997.
The strongest increment of DSI, up to a severe drought event of -0.68 is found in 1999 and is associated with an increase of PET. The period 2000 to 2008 maintained values for PET above the mean of 271.5 mm while the DSI value oscillated from strong to very strong levels. During the last two years of the study, the DSI varied from very strong to severe drought condition in chronological order.
Carbon and nitrogen release and their relation with potential rainfall availability (PRA)
The water flux between soil and atmosphere can be reflected in the analysis of the precipitation (P) minus the PET (P-PET) and is termed potential rainfall availability (PRA) (SENASICA 2010).
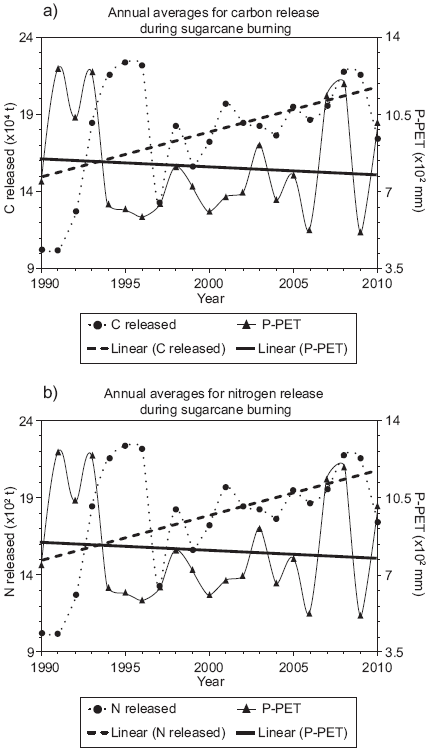
Both C and N release showed levels above its annual average, 17.8 x 10⁴ t and 17.8 x 10² t respectively when the PRA (P-PET) was below annual average value (10.8 x 102 mm) from 1994 (Fig. 5). In general, a PET increase and its derived PRA (P-PET) decrease provoked an increment on the release of both gases for the period 1990-2010 (Fig. 5a and 4b). The linear tendency shown in Figure 5b and 5b revealed a positive slope for C and N release and a negative slope for P-PET. This behavior is due first to the decrease of precipitation levels from 1994 to 2006, mainly below 1000 mm, and secondly to the increase of PET (> 270 mm) during the period.
DISCUSSION
The variability in PET and DSI shown in Figure 4 are related with the increase or decrease occurred in the release of C and N (Fig. 5a and 4b) during the sugarcane burning due to water availability while the combustion process occurs. However, the increase in cultivated areas also favored the rise of soil evaporation and plant transpiration, reflected in PET parameter (Fig. 4) and the growth of burned areas as well (in the period 2000-2008 and in year 2010).
The water flux between soil and atmosphere is studied with the PRA through the P-PET. But, the correlation analysis between these parameters with the C and N released let us know that for both cases (Fig. 5a and 4b) it was close to zero (-0.28), mainly during the 13 years of the study period (1994-2006), where P-PET was below their average because there was PET increase with respect to precipitation levels. Likewise, for the period 1990 to 1993 the water availability levels reduced the C and N emitted during sugarcane burning, but during the period 2007-2010 the increase of burned areas did not allow these nutrients to reduce their emission rate, although the precipitation levels grew compared to the first years.
The differences in the order of magnitude between C and N release in IPCC and Mexico's results are indicated in Table III. The correlation coefficient in the C release for both analyses (with Mexican reference values (*) and IPCC reference values) is practically equal to 1 because the fraction of carbon in waste (FCW) was constant in every yearly calculus (0.2230 for Mexican values and 0.4325 for IPCC; Fig. 6a). Nevertheless, for the N the value is 0.8 due to variations of nitrogen-carbon ratio (NCR) depending on annual production per hectare levels (Tables I and III; Fig. 6b).
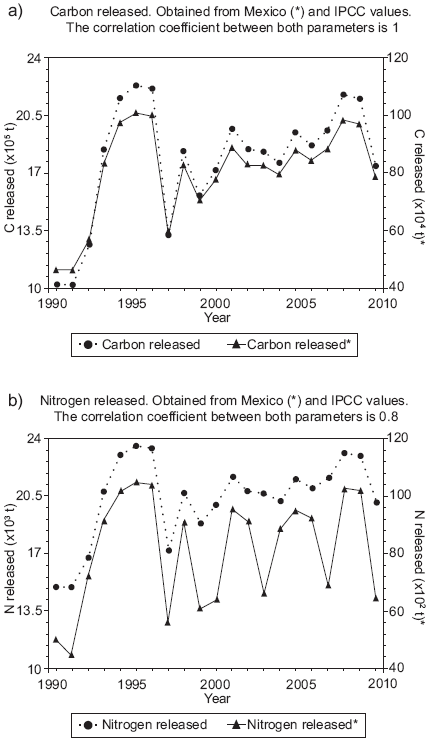
Fig. 6 Carbon (a) and nitrogen (b) releases. Calculated according to Intergovernmental Panel on Climate Change and Mexico's own (*) reference data respectively (author's own production)
According to sugarcane annual production per hectare (Fig. 2), San Luis Potosí keeps a medium aptitude level (Table I) for most of the year. Although, there is insufficient information to analyze the annual levels of C and N during the study period. The only year in which data exist for N levels in the sugarcane zone (Fig. 3) is 2009, where N availability was less than 20 kg/ha (SAGARPA 2009a, 2009b, 2009c) placing the aptitude level of sugarcane as "not suitable" (Table I). However, this condition does not match with the aptitude level obtained based on the annual production because it was superior (medium level). This means that the floor area of sugarcane is being forced to support the cane crop, affecting the soil health.
The increase of potential evapotranspiration and the decrease of rainfall in the period 2000-2008 and in year 2010 were not favorable for production because the net water flux is principally evaporated to the atmosphere (P-PET) and the sugarcane must extract water at a rate fast enough not to lose it during this process. Also, the decrease in soil water favors greater loss of C and N because of the increase in efficiency in the combustion process (Chen et al. 2010, Franca et al. 2012).
Aguilar-Rivera et al. (2010) mention that in a complete cycle the sugarcane crop requires 1500 mm of water for its development. However, it is found that there were just two years in which the rainfall reached these levels (1991 and 1993). Therefore favoring the increase of DSI, mainly in the last 11 years of the study period in which there was an important increase in the cultivated hectares and in the PET levels (Fig. 4).
The C and N release in the Huasteca Potosina during sugarcane burning represented practically 0.05 % and 1 % of the total losses of these nutrients in Mexico (Ordonez et al. 2012). In addition, when comparing these values with those of the other countries such as Brazil and Australia it is observed that the carbon and nitrogen release increased substantially (more than 100 % of the Mexican losses; UNFCCC 2014). The direct affectation is reflected in the land use change due to a growing sugarcane surface displacing natural vegetation as was demonstrated by Peralta-Rivero et al. (2014) for the Mexican Huasteca Region and as it is shown in this research, particularly for the Huasteca Potosina (Fig. 3).
Actually, various strategies exist to manage the C and N in soils. In these particular cases it is imperative to increase the amount of these nutrients in the surface with a minimum soil disturbance. As noted by Lal (2006), it should be in a proportional way to the increase of cultivated hectares. Also, there is an important rise in the quantity of N during the agricultural practices as recommended by SAGARPA (2009a, 2009b, 2009c) from 20 kg/ha to 190 kg/ha. Finally, it is necessary to use sustainable methods to take advantage of the sugarcane's waste potential in the availability of C, N and water in the soils.
CONCLUSIONS
When the cane production level has not a consistent growth related with the increase of the harvested area, then is relevant to analyze the climate and soil conditions under which the cane crop take place. The aptitude levels of sugarcane fluctuated from "not suitable" to "medium" during the period 1990-2010 in the Huasteca Potosina region. Consequently, the production per hectare never reached the optimal levels (>80 t/ha). Furthermore, the weather settings played an important role in each of the studied periods of sugarcane burning where the water flux to atmosphere is related with the potential evapotranspiration. In this study, the potential evapotranspiration (PET) had three types of behavior: it grows when the DSI decrease is helping to keep a water balance (ranged from 1990 to 1994), it decreases when the DSI increases, which affects the water soil availability (years 1995, 1996, 1997 and 2009), and it increases when DSI increases too (1998, 1999 and in the period 2000-2008 and 2010) due probably to an increase in cultivated hectares and the rise of precipitation levels. In the latter two cases the combustion process during sugarcane burning was favored due to soil water loss and the increase of the crop surface, respectively. The analysis that represents the soil-atmosphere water flux was the potential rainfall availability (P-PET). Since 1994 and practically until 2006 the water flux was mostly evaporated to the atmosphere, because P-PET was less than their average value of the study period (10.8 x 102 mm). The conditions in which there was an increase in the C and N release were favored due to a decrease in the amount of water in the soil and consecuently favouring the combustion process of sugarcane during the harvest period. In the years 2007, 2008 and 2010 the annual values of P-PET were greater than the average value due to an increase of precipitation levels. These values did not affect in an important way the release of C and N in the cane burning due to the increase of crop hectares and the number of acres burned. The correlation of analyzed parameters allowed identification of important phenomena, such as the -0.1 value obtained between the production per hectare (with a negative trend) and the crop surface (with a positive slope). Due to the relation between cane production and aptitude levels, as mentioned above, it was possible to identify C and N losses, which was justified with the analysis of DSI, PET and PRA in the study period. Likewise, during the period 1990-1997 the DSI and PET had a correlation value close to one (0.8) due to PET increase. This parameter depends strongly on water availability. In contrast, for the same period, the correlation coefficient between the C and N release and P-PET was close to zero (0.28) due to the decrease in precipitation levels (from 1512 mm to 913 mm) during 1993 and 1994, which helped to increase increase nutrient emissions. Finally, it is relevant to mention agricultural methods and land use strategies to increase the harvested sugarcane without affectation to soil health and climatic conditions. One of these methods is the green harvesting in which there is no release of nutrients to the atmosphere, a method that only involves leaf cutting another method is the use of cane species with a minor percentage of waste to be burned. Although, it is important to analyze the economic cost for farmers in order to know if there really will be a real benefit to them. In contrast, to San Luis Potosí, other Mexican states like Jalisco have fewer hectares to grow sugarcane but still produce more cane per hectare than Huasteca Potosina region. Thus, a land use strategy could be the increase of soil nutrients (mainly N and C) instead of the cultivated surface to support the sugarcane grow.

