


Serviços Personalizados
Journal
Artigo
 Inglês (pdf)
 Artigo em XML
 Referências do artigo
 Enviar este artigo por email
Indicadores
-
 Citado por SciELO
 -
 Acessos
Links relacionados
-
 Similares em
SciELO
Similares em
SciELO
Compartilhar

 Permalink
Revista internacional de contaminación ambiental
versão impressa ISSN 0188-4999
Rev. Int. Contam. Ambient vol.31 no.1 Ciudad de México Fev. 2015
Derivation of volatile organic compounds surrogate for the maximum incremental ozone reactivity in Mexico City metropolitan area
Obtención de compuestos orgánicos volátiles sustitutos para el incremento de reactividad máxima del ozono en el área metropolitana de la Ciudad de México
José Luis Jaimes-López*, Eugenio González-Ávalos and Marco Antonio Ramírez-Garnica
Dirección Ejecutiva de Investigación y Posgrado, Instituto Mexicano del Petróleo, Eje Central Lázaro Cárdenas Norte 152, Colonia San Bartolo Atepehuacan, México, D. F., C.P. 07730 *Autor de correspondencia: jjaimes@imp.mx
(Received March 2014;
accepted August 2014)
ABSTRACT
Using a method developed by Lurmann et al. (1991), for lumped molecule or lumped-surrogate, we were able to define the respective base mixture for determining the reactivity of volatile organic compounds (VOCs) in ozone formation in the Mexico City metropolitan area (MCMA). A sampling campaign for collecting VOCs was carried out to determine the individual compounds in the MCMA atmosphere. Samples were collected simultaneously in stainless steel canisters at six sites: Xalostoc, Pedregal, Tlalnepantla, Cerro de la Estrella, Instituto Mexicano del Petróleo, and la Merced. Seven samples were taken at each site during the sampling period. Ten VOC groups were established applying the Lurmann methodology, and each group was represented by one compound as follows: i) n-butane for the first alkane group, ii) n-octane for the second alkane group, iii) ethylene in a group by itself, iv) propene for the first olefin group, v) t-2-butene for the second olefin group, vi) toluene for mono alkyl benzenes, vii) m-xylene for the higher aromatics, viii) formaldehyde in a group by itself, ix) acetaldehyde for the aldehydes, and x) acetone for the ketones. The surrogate VOC group (base mixture) was determined, which can be used to experimentally obtain the ozone formation index of VOCs in the MCMA.
Key words: ozone formation, ambient air, lumped molecule, base mixture.
RESUMEN
La metodología de molécula agrupada o mezcla agrupada sustituta desarrollada por Lurmann et al. (1991) fue aplicada para definir la mezcla base representativa en el área metropolitana de la Ciudad de México (AMCM) con el propósito de determinar la reactividad de los compuestos orgánicos volátiles (COV) en la formación de ozono. Para determinar la concentración de los componentes individuales de los COV, una campaña de muestreo fue llevada a cabo, utilizando contenedores limpios de acero inoxidable. Las muestras se recolectaron simultáneamente en seis sitios: Xalostoc, Pedregal, Tlalnepantla, Cerro de la Estrella, Instituto Mexicano del Petróleo y la Merced. En cada sitio se colectaron siete muestras durante el periodo de muestreo. Al aplicar la metodología de mezcla agrupada sustituta se establecieron 10 grupos y un componente que representó a cada uno de ellos. Dichos grupos fueron: i) n-butano para el primer grupo alcano, ii) n-octano para el segundo grupo alcano, iii) etileno para su propio grupo, iv) propeno para el primer grupo olefinas, v) t-2-buteno para el segundo grupo olefinas, vi) tolueno para mono alquil bencenos, vii) m-xileno para aromáticos grandes, viii) formaldehído para su propio grupo, ix) acetaldehído para los acetaldehídos, y x) acetona para las quetonas. Se determinó una mezcla de grupos de COV (mezcla base), la cual se propone que sea utilizada para obtener experimentalmente los índices de reactividad de los COV en la formación de ozono del AMCM.
Palabras clave: formación de ozono, aire ambiente, mezcla agrupada sustituta, mezcla base.
INTRODUCTION
Air quality in urban areas is affected by the quantity of ozone (O3) formed at ground level. It is a well-known fact that O3 is formed from reactions between volatile organic compounds (VOCs) and nitrogen oxides (NOx) in the gaseous phase under ultraviolet solar radiation. The main process for forming O3 at the lowest level of the Earth's atmosphere is NO2 photolysis, which is rapidly reverted when O3 reacts with NOx. The respective reactions are as follows:

where hg is the energy of incident radiation. These reactions lead to the formation of O3 in a photo stationary condition, which is regulated by the photolysis rate of NO2 and by the NO2/NOX ratio. If VOCs were not present in the air, O3 formation would not be significant. Therefore, VOCs react to form radicals which either consume NOX or convert NOX into NO2. In addition, O3 increases when reactions are linked to the photo stationary condition.
Nevertheless, a number of reactions are involved, summarized as follows:
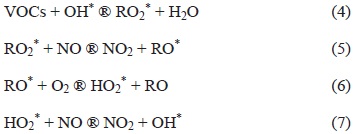
In these processes, the rate at which 03 increases depends on the V0C concentrations, the reaction constant rates of each V0C, and the radical OH reactivity, as well as those of any other species that could react with VOCs. Ozone production is maintained when there is enough NOx, and when simultaneous reactions between peroxide radicals (RO2) and NO do not compete effectively with other peroxide radicals.
Strategies for VOCs control have been developed, taking into account the different effects on O3 formation from all compounds, as well as their reactivities in the atmosphere. When reaction rates among them are low because of a highly diluted air mass, or if NOx are consumed long before the reaction is finished, their contribution to O3 formation can be minimal.
The reactivity level of OH radicals can be the main parameter due to its influence on O3 formation rates that are linked to all VOC reactions. In fact, if one VOC significantly affected radical inhibition levels, then the O3 production rate could be smaller than for any other VOC not explicitly expressed, even though the reaction leads to O3 formation. Therefore, a VOC usually does not react because of a high and positive effect of radicals. If VOCs reactions show an upward trend on the NOx removal rates in the system, then they will show little effect on O3 formation. The latter will happen once O3 formation is limited because of low NOx levels (Carter et al. 1995).
The NOx availability in the environment is the most important factor in O3 formation, because if NOx molecules were absent, O3 could not be formed, even when VOCs are present. Therefore, all VOCs would have reactivity for O3 formation, even at zero level. If the NOx levels are relatively high, they are sensitive to VOCs concentration. This means that total VOCs have the biggest impact on O3 formation. Both the radical levels and the period of the O3 pollution episode are important because they affect O3 formation, as well as those chemical species with low reaction rates. This behavior is explained because, at the highest radical levels in a long pollution episode, reactions with a low rate contribute to O3 formation.
As for O3 control, strategies consider VOCs reactivity, and point out that the reactivity among different VOCs is more important than the absolute impact from only one of them. Some environmental conditions, such as temperature and concentration levels, also affect the reactivity of VOCs due to their importance on different reaction mechanisms under specific conditions. For instance, some parameters, such as light intensity, temperature, or dilution in reaction mechanisms affect the NOx removal rates, but do not affect the impact on O3 that comes from VOCs in environments abundant in NOx. However, they begin showing a certain effect when NOx are limited.
There are scales assigned to the reactivity of VOCs, which consist of schemes for assigning numbers to VOCs to quantify their impact on O3 formation. A useful scale has been used for analyzing the roles of different VOCs in the environment. One such scale is the constant rate of the OH radical, also called the OH constant scale (Chameides et al. 1988), which can quantify the VOC reaction rate. In that case, some VOCs, such as alkenes and aldehydes, show high constant rates of OH radicals. The use of constant rates enables the easy estimation of almost all VOCs, regardless of environmental conditions. This also works for predicting the relative O3 impact from VOCs with very slow reaction rates. However, because of the mechanistic factors mentioned above, it is not a satisfactory method for predicting the relative O3 impact from VOCs reacting rapidly or for comparing O3 impacts from VOCs with similar constant rates.
As for the regulatory framework, the O3 impact (or reactivity) mainly affects the current change in O3 formation because of VOCs emissions. This change can be measured using the mean of the "incremental reactivity," which is defined as the change in O3 formation caused by the addition of a small quantity of a specific VOC to the VOCs emissions in an O3 pollution episode (Carter 1994). According to this approach, the mixture base for the determination of the maximum incremental reactivity (MIR) should be representative of compounds in a certain atmospheric region. In order to obtain this determination, factors mentioned previously should be applied. The mixture base used in experiments with smog chambers to simulate VOCs in the atmosphere should be representative of their effect on reactivity results.
To achieve this goal, there are different points of view. One of them uses complex mixtures which have been designed to simulate, as close as possible, those mixtures present in the atmosphere. Another consists of very simple mixtures, which are tracers that are easier to follow experimentally and also provide a better evaluation of the mechanism taking into account the effect of different VOCs in the atmosphere (Lurmann et al. 1992). Some studies were performed in Mexico for monitoring VOCs concentrations in the ambient air of mega cities, and many of them focused on the Mexico City metropolitan area (MCMA). Mugica et al. (2001) and Vega et al. (2000) identified the VOCs emissions from different sources and fuels. Also Arriaga-Colina et al. (1997, 2004) carried out monitoring campaigns to determine VOC concentrations as well as to prove their great influence on O3 formation.
In this work, the lumped molecule or lumped-surrogate method developed by Lurmann et al. (1991) was applied for the determination of the base mixture. A simplified mixture is generated from the average data of all VOCs. In this new mixture, a single compound that represents the reactivity of the grouped molecules is used, and was applied in all of the studies of smog chambers by Carter (1994) to determine VOCs reactivity in the United States of America. The advantage of this method is the representation of each compound's group by a single compound, but showing the reactivity of the total group. As a result the base mixture designed for carrying out experiments on VOC reactivity to O3 formation is easier to prepare.
MATERIALS AND METHODS
The method used for the determination ofthe base mixture of the VOCs came from such a mixture or from grouped molecules. This requires a representative compound to be chosen for each molecular species. Each group is described as follows:
Group #1 (ALK 1) is one group of alkanes. This group includes alkanes, alcohols, ethers, and other saturated compounds that react with OH radicals at constant rates less than 104 ppm/min at 300 K. n-butane was chosen to represent this case.
Group #2 (ALK 2) is a second group of alkanes. It consists of similar compounds, but with constant rates higher than 104 ppm/min. This group is represented by n-octane.
Group #3 (ETHE) is for ethylene only.
Group #4 (OLE 1) is the terminal alkenes. This includes all alkenes reacting with OH radicals with constant rates lower than 7.5 x 10⁴ ppm/min at 300 K, including isobutene but not 2-methyl-1-butene. This group is represented by propene because mechanisms for other terminal alkenes are derived from this one.
Group #5 (OLE 2) is the internals and dialkenes. It represents all alkenes that react with OH radicals with constant rates higher than 104 ppm/min at 300 K. This group includes almost all alkenes with more than one substituent around the bond (other than isobutene) and conjugated olefins, such as isoprene. It also includes the styrenes, because these are grouped like alkenes in the reaction mechanism. trans-2-butene is used to represent this group.
Group #6 (ARO 1) is the mono alkyl benzenes. It consists of aromatic hydrocarbons that react with OH radicals with constant rates lower than 2 × 10⁴ ppm/min at 300 K, including benzene and mono alkyl benzenes. This is represented by toluene, because it shows dominance in both species.
Group #7 (ARO 2) is the higher aromatics. It consists of aromatic hydrocarbons that react with OH radicals at constant rates higher than 2 × 10⁴ ppm/min at 300 K. This group includes xylenes, polyalkyl benzenes and naphtalenes, and is represented by m-xylene because its constant rate is closer to the average of this group than any other isomer of xylene.
Group #8 (HCHO) is for formaldehyde only.
Group #9 (CCHO) is composed of acetaldehyde and higher aldehydes. RCHO molecules are handled on a separated condensed mechanism, SAPRC (Lurmann et al. 1991), but almost all of the other condensed mechanisms are grouped together. It is represented by acetaldehyde.
Group #10 (ACETONE) is for acetone and higher ketones. It is represented by acetone.
In the studies of reactivity in smog chambers made by Carter et al. (1995), it was shown that if the acetaldehyde concentration was replaced by formaldehyde, the effect on reactivity was small compared to the significant experimental advantages. This demonstrates that experimental simplification is appropriate.
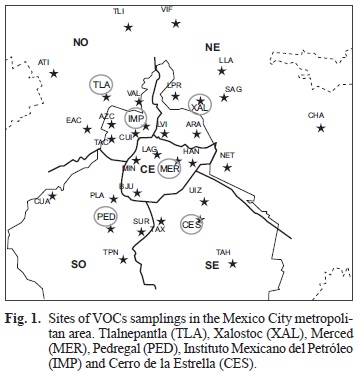
We carried out a sampling campaign of VOCs to determine the compounds in the atmosphere of the MCMA between April 30, 2002 and May 16, 2002 using clean stainless steel canisters. Because of a stable atmospheric condition prevailing during early mornings, VOCs concentrations primarily represented emissions within each site (Wohrnschimmel et al. 2006). Environmental air samples were collected simultaneously at six sites: Xalostoc (XAL), Pedregal (PED), Tlalnepantla (TLA), Cerro de la Estrella (CES), Instituto Mexicano del Petróleo (IMP) and la Merced (MER; Fig. 1). At each site, seven samples were taken during the sampling period.
Samples were taken in canisters for three hours in the morning from 6 to 9 h, and then were analyzed using the gas chromatography method T-014 (EPA 1995). More than 180 VOCs were detected. Samples for carbonyl compounds were taken from XAL, PED and MER. Carbonyls were trapped using cartridges containing dinitrophenyl hydrazine and were then quantified using high-performance liquid chromatography (HPLC, Model 6890, Agilent Technologies) according to TO-11A (EPA 1999).
RESULTS AND DISCUSSION
The concentrations of VOCs are shown in Tables I-IV (I,II,III,IV). Table I shows the analytical results expressed as parts per billion carbon (ppbC) of the environmental VOCs mixture as well as the overall average of each VOC species. Total average concentrations for some compounds were zero, and therefore omitted.
Total VOCs levels were significantly higher at TLA (2628.0 ppbC) and XAL (2514.7 ppbC). These two sites are heavily industrialized and densely populated in the north part of the MCMA. The lowest were found at the residential PED site (1054.2 ppbC), in the southwest part of the city. Total VOCs at MER, IMP, and CES had levels of 2491, 2000.9, and 2267.9 ppbC, respectively. These values were 2.14 times those of PED. Such a difference among pollutants in the MCMA is consistent with the findings of Arriaga-Colina et al. (2004), taken between 1992 and 2001 in March and November. They also reported that MER values were 2.1 times higher than those in PED. Our data collected from early May 2002 showed concentration levels 35-41 % lower than those reported by Arriaga-Colina et al. (2004) in their March campaigns. This could be explained either by the higher ambient temperature during May, which promotes the dilution of air pollutants early in the morning, or by actual decreases of vehicle emissions in 2002. Arriaga-Colina et al. (2004) always observed a significant declining trend of 21 % for total VOCs at XAL from 1992 to 2001. This behavior was attributed to the renewal of the local vehicle fleet as well as the use of better emission control systems and improvements in gasoline quality (SMA 2006).
Aromatic VOCs concentrations, which impact O3 formation, showed higher values (572.3 ppbC) at XAL, which is situated in an industrial zone characterized by high VOCs emissions, while lower levels (157.2 ppbC) were found at PED. On average for all six sites the highest concentrations were reported for p-xylene, o-xylene, benzene, and ethyl benzene, in that order. The highest ethylene concentration values were found at TLA (61.3 ppbC) and CES (60.5 ppbC) and the lowest at PED (21.4 ppbC). The highest levels of halogenated VOCs were detected at MER (98 ppbC), a zone with heavy vehicular traffic because it is a popular commercial zone close to downtown. Paraffinic VOCs were somewhat more concentrated. Specifically, propane was reported at 411.6 ppbC (MER) and butane at 272.4 ppbC (TLA). Total concentrations were high at MER (1346.3 ppbC) and TLA (1334.8 ppbC), and low at PED (621.3 ppbC). Nevertheless, these compounds have an insignificant influence on O3 formation (Carter 1994).
Acetylene (which along with olefins has an appreciable influence on O3 formation) was detected at the highest level at CES (99.3 ppbC) and at the lowest level at PED (35.4 ppbC). The highest total of olefins was reported at TLA (344.4 ppbC) and the lowest at PED (118.9 ppbC). The difference is about 300 %. Among the olefins, the highest propene concentration was at TLA (32.8 ppbC) and the lowest at PED (15.2 ppbC). t-Butylcyclohexane was also found in the highest concentration at TLA (29.1 ppbC) and at similar levels at MER, XAL, and IMP. The lowest concentration was found at PED (10.4 ppbC). Interestingly, HVOC levels in the morning were the lowest at PED, a site characterized by the highest frequency of severe O3 events in the afternoon in Mexico City. This situation has been explained by several authors who pointed out that O3 precursors are transported from the north to the south in the city. The highest concentration of compounds with an oxygenated group was reported at TLA (166.9 ppbC) and the lowest at PED (41.3 ppbC), a difference of about 400 %. These compounds have the highest influence on O3 formation and represent 6.35 % of total VOCs. Of them, methyl Z-butyl ether was present at the highest concentration (44.4 ppbC) at CES, and MER, XAL, and TLA had similar values. The lowest concentration was detected at PED (3.1 ppbC). Taking into account the total concentration from all six sites, TLA, MER, and XAL presented the highest values, at 2500 ppbC, and PED presented the lowest value (1054.3 ppbC).
Table II shows the total average concentration of compounds linked to O3 formation. Contribution from the aromatics, halogens, alkanes, olefins, OXI group, and unknown compounds were 19.3, 3.1, 53.5, 12.2, 5.1, and 6.8 %, respectively, showing that alkanes were the most important compounds.
Table III contains the specified grouped molecules (SGM) for each compound, based on Table II. This data was derived according to our ten defined groups. The table also shows that in SGM #1, from aromatics, alkanes, olefins, and OXI are 1.3, 5.7, 1.4, and 3.2 times higher, respectively, than those in SGM #2.
Therefore, SGM #1 values were 2.9 times higher than those in SGM #2.
ALK 1. Though represented by n-butane, which was detected at 194 ppbC n-propane was the compound in the highest concentration (360 ppbC). n-butane has a higher reactivity than n-propane on the reactivity scale for O3 formation (Carter et al. 1994).
ALK 2. n-octane the representative compound, was present at 7.0 ppbC. The compound with the highest concentration was methyl pentane (42.3 ppbC), and the total concentration of this group was 184.7 ppbC.
ETHE. Ethylene was present in a concentration of 47.5 ppbC.
OLE 1. This group is represented by propylene, which was present in a concentration of 24.5 ppbC. In this group, acetylene was the most concentrated molecule at 75.3 ppbC. The total concentration of OLE-1 was 150.4 ppbC.
OLE 2. t-2-butene represents this group and was present at 12.5 ppbC. Two compounds were of higher concentrations: isobutylene and 1-butene at 20.3 ppbC and t-butylcyclohexane at 20.0 ppbC. Total concentration for OLE-2 was 106.2 ppbC.
ARO 1. Toluene represents this group and was present at 154.9 ppbC. At higher concentrations were benzene and ethyl benzene at 26.6 ppbC and 23.8 ppbC, respectively. The total concentration for this group was 178.9 ppbC.
ARO 2. The total concentration for this group was 223 ppbC. Compounds with the highest concentration were m/p-xylene and o-xylene at 77.8 ppbC and 29.4 ppbC, respectively.
HCHO. Formaldehyde was present at a concentration of 25.1 ppbC.
CCHO. The total concentration for this group was 29.2 ppbC, acetaldehyde was at 14.4 ppbC.
ACETONE. Only acetone and 2-butanone were detected. The concentration of acetone was 35.5 ppbC while the total concentration was at 39.2 ppbC.
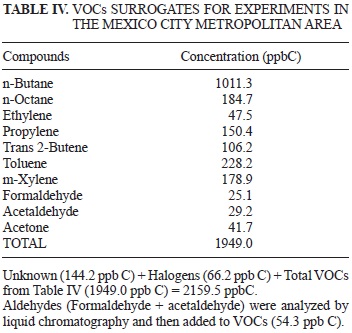
Table IV shows the VOCs surrogates for carrying out experiments for O3 formation in the MCMA and for determining the MIR for different NOx concentrations.
CONCLUSIONS
We provide a base mixture for performing experiments for determining O3 formation indices of VOCs in the MCMA. Reactivity of lumped-surrogates (base mixtures) in this study should be very similar to that found in the MCMA atmosphere. The NOx concentrations are also representative of the data collected during VOC sampling. The surrogate base mixture (Table 4) can be used in experiments for determining O3 formation from each VOC to generate better and more reliable results. As a consequence, decisions will be more effective for air quality improvement in macro cities. Finally, the base mixtures obtained in this study allow experimental work to be carried out for determining the VOCs reactivity indices for O3 formation. Therefore, indices currently applied in the MCMA, obtained by Carter et al. (1994) in the United States of America, can be replaced by indices determined from the application of this study.
REFERENCES
Arriaga-Colina J.L., Escalona S., Cervantes A., Orduñez R. and Limón T. (1997). Seguimiento de COV en el aire urbano de la ZMCM. 1992-1996. In: Contaminación Atmosférica. Vol. 2 (L.G. Colín, J. Varela, Eds.), 1ª ed. El Colegio Nacional, México D.F., pp. 69-76. [ Links ]
Arriaga-Colina J.L., West J.J., Sosa G., Escalona S.S., Orduñez R.M. and Cervantes A.D.M. (2004). Measurements of VOCs in Mexico City (1992-2001) and evaluation of VOCs and CO in the emissions inventory. Atmos. Environ. 38, 2523-2533. [ Links ]
Carter W.P.L. (1990). A detailed mechanism for the gas-phase atmospheric reactions of organic compounds. Atmos. Environ. Part A, General Topics. 24, 481-518. [ Links ]
Carter W.P.L. (1994). Development of ozone reactivity scales for volatile organic compounds. J. Air Waste Manag. Assoc. 44, 881-889. [ Links ]
Carter W.P.L., Lou D., Markina I.L. and Pierce J.A. (1995). Environmental chamber studies of atmospheric reactivities of volatile organic compounds. Effects of varying ROG surrogate and NOx. Final Report. Statewide Air Pollution Research Center and College of Engineering. Center for Environmental Research and Technology. University of California, Riverside, CA, USA, 137 pp. [online] citeseerx.psu.edu. [ Links ]
Chameides W.L., Lindsay R.W., Richardson J. and Kiang C.S. (1988). The role of biogenic hydrocarbons in urban photochemical smog: Atlanta as a case of study. Science 241, 1473-1475. [ Links ]
EPA (1995). Analysis of volatile organic compounds from polished stainless steel pasivated canisters by EPA method TO-14/TO-15. Environmental Protection Agency. Research Triangle Park Laboratories, Inc. [online] http://www.epa.gov/ttnamti1/airtox.html. [ Links ]
EPA (1999). Compendium of methods for the determination of toxic organic compounds in ambient air. Compendium method TO-11A-determination of formaldehyde in ambient air using adsorbent cartridge followed by high liquid chromatography (HPLC). 2nd ed. Environmental Protection Agency. [online] http://www.epa.gov/ttnamti1/airtox.html. [ Links ]
Vega E., Múgica V, Reyes E., Sánchez G., Chow J. and Watson J. (2000a). Differences of 1996 and 1997 source contributions of volatile organic compounds in Mexico City. In: Air Pollution VIII. (J.W.S. Lon-ghurst, C.A. Brebbia and H. Power, Eds.) Wit Press, Southampton, U.K., V. 8, pp. 109 -119. [ Links ]
Lurmann F.W., Gery M. and Carter W.P.L. (1991). Implementation of the 1990 SAPRC chemical mechanism in the urban airshed model. Final Report. California South Coast Air Quality Management District, Sonoma Technology, Inc. Report STI-99290-1164-FR, Santa Rosa, CA, USA. [online] http://www.engr.ucr.edu/~carter/pubs/s99doc.pdf. [ Links ]
Lurmann F.W, Main H.H., Knapp K.T., Stockburrger L., Ramussen R.A. and Fung K. (1992). Analysis of ambient VOC data collected in the Southern California Air Quality Study. Final Report. California Air Resources Board, Contract No. A 382-130; Research Division, Sacramento, CA, USA. [online] http://www.osti.gov/scitech/biblio/5985200#. [ Links ]
Múgica V., Vega E., Sánchez G., Reyes E., Chow J., Watson J., Egami R. and Arriaga J.L. (2001). Volatile organic compounds emissions from gasoline and diesel powered vehicle. Atmósfera 14, 29-38. [ Links ]
SMA, Sistema de Monitoreo Atmosférico (2006). Gestión ambiental del aire en el Distrito Federal: Avances y propuestas 2000-2006. Secretaría del Medio Ambiente, Gobierno del Distrito Federal, Ciudad de México. 255 pp. [ Links ]
Wóhrnschimmel H., Márquez C., Mugica V., Stahel W.A., Stahelin J., Cárdenas B. and Blanco S. (2006). Vertical profiles and receptor modeling of volatile organic compounds over Southeastern Mexico City. Atmos. Environ. 40, 5125-5136. [ Links ]

