


Services on Demand
Journal
Article
 English (pdf)
 Article in xml format
 Article references
 Send this article by e-mail
Indicators
-
 Cited by SciELO
 -
 Access statistics
Related links
-
 Similars in
SciELO
Similars in
SciELO
Share

 Permalink
Revista internacional de contaminación ambiental
Print version ISSN 0188-4999
Rev. Int. Contam. Ambient vol.31 n.1 Ciudad de México Feb. 2015
Concentration of toxic elements in topsoils of the metropolitan area of Mexico City: A spatial analysis using ordinary kriging and indicator kriging
Concentración de elementos tóxicos en suelos del área metropolitana de la Ciudad de México: análisis espacial utilizando kriging ordinario y kriging indicador
Thomas Ihl1, Francisco Bautista1*, Fredy Rubén Cejudo Ruíz1, María del Carmen Delgado1, Patricia Quintana Owen2, Daniel Aguilar2 and Avto Goguitchaichvili2,3
1 Laboratorio Universitario de Geofísica Ambiental, Centro de Investigaciones en Geografía Ambiental, Universidad Nacional Autónoma de México, Campus Morelia, Antigua Carretera a Pátzcuaro 8701, Col. Ex-Hacienda de San José de la Huerta, C.P. 58190, Morelia, Michoacán, México*Autor de correspondencia: leptosol@ciga.unam.mx
2 Departamento de Física Aplicada, Centro de Investigación y Estudios Avanzados-Mérida, A.P. 73, Cordemex, 14 97310, Mérida, Yucatán, México
3 Laboratorio Interinstitucional de Magnetismo Natural, Instituto de Geofísica - Sede Michoacán, Universidad Nacional Autónoma de México, Campus Morelia, Antigua Carretera a Pátzcuaro 8701, Col. Ex-Hacienda de San José de la Huerta, C.P. 58190, Morelia, Michoacán, México
(Recibido mayo 2013;
aceptado octubre 2014)
ABSTRACT
In order to generate relevant information for decision-makers to protect the inhabitants of the Metropolitan Area of Mexico City, 89 samples of topsoil were collected in urban zones to assess the concentration of toxic elements. For this purpose, the concentration of Cr, Cu, Ni, Pb, V and Zn were quantified with X-ray fluorescence. To evaluate the pollution, we considered the maximum permissible limits, the contamination factor and the pollution load index. The spatial distribution was analyzed by geostatistical methods. Ordinary and indicator Kriging were applied to estimate the values at unmeasured sites and the proportion of the values exceeding the critical concentration for each element within a region. The study revealed that the Metropolitan Area of Mexico City has excessive environmental problems related to pollution. The concentrations of Cr and V are apparently not anthropic, while the high amounts of Cu, Zn and Pb are largely due to human activities. The pollution of Ni exhibits two single spots, while Cu and Zn contents are distributed from the city center towards the northern suburbs. The presence of Pb is spread evenly through the entire urbanized area. The probability maps clearly identify the most contaminated areas, which requires immediate action by local decision-makers.
Key words: Pb, V, Ni, Cu, contamination factor, pollution load index.
RESUMEN
Con la finalidad de generar información para la toma de decisiones y proteger a los habitantes del área metropolitana de la ciudad de México, se tomaron 89 muestras de suelo superficial urbano, con las que se evaluó la concentración de elementos tóxicos. Se midió la concentración de Cr, Cu, Ni, Pb, V y Zn utilizando un equipo de fluorescencia de rayos X. Para valorar la contaminación del suelo se utilizaron los límites máximos permisibles, el factor de contaminación y el índice de carga contaminante. Se realizó un análisis de la distribución espacial de los elementos medidos por los métodos geoestadísticos como Kriging ordinario y el indicador Kriging. El análisis reveló que la zona metropolitana de la Ciudad de México tiene problemas ambientales excesivos. Las concentraciones de Cr y V al parecer no tienen causas antrópicas, mientras que las altas cargas de Cu, Zn y Pb son en gran medida de origen humano. La contaminación por Ni presenta dos puntos esenciales, el Cu y Zn se distribuyen desde el centro hacia los suburbios del norte. El Pb está distribuido uniformemente sobre el área urbanizada. Los mapas probabilísticos permiten identificar claramente las zonas más contaminadas en las cuales los tomadores de decisiones locales deben tomar acciones inmediatas de remediación.
Palabras clave: Pb, V, Ni, Cu, factor de contaminación, índice de carga contaminante.
INTRODUCTION
The metropolitan area of Mexico City (MAMC) has more than 20 million inhabitants and a still-growing population. The MAMC has more than 40 000 small and medium-sized industries, and vehicles use daily more than 40 million L of petroleum fuels producing thousands of t of pollutants (Molina et al. 2010, UN 2012). However, diagnoses of urban topsoil contamination with toxic elements (TE) are still scarce (Morton-Bermea et al. 2009, Rodriguez-Salazar et al. 2011, Aguilar et al. 2012).
This MAMC is the third-largest urban region in the world (UN 2012). It lies on an intermountain basin, with an altitude of approximately 2200 m above the sea level and is surrounded on three sides by recent volcanoes. This physical location, together with local phenomenon such as intense emissions from private and public transport and high concentrations of industries in the affluent suburbs, frequently causes smog along the city. The winds blow over the mountains, but there is little circulation to transport the heavier particles of smog and dust out of the basin. Therefore, emissions accumulate throughout the morning and afternoon. During the evening, wind rises and disperses a lot of the smog, but settles it again over the basin during the cooler nights. This pattern is repeated on subsequent days. Furthermore the air quality is generally worse in winter, when there is practically no rain and thermal inversions are more frequent (Molina et al. 2010).
Over the last decades the term "heavy metals" is widely used in environmental studies for their toxicity, although there are still considerable uncertainties about their definition. In specific literature, the density criteria varies from above 3.5 g/cm to above 7 g/cm (Duffus 2002). In addition, we have also transition and post-transition metals as toxic elements or trace elements with considerable toxicity. Consequently we use for this study the term "toxic elements" (TE) instead of "heavy metals" as commonly used by the United States Environmental Protection Agency (US-EPA 2012).
There are different anthropic sources of TE in urban soils (Sutherland 2000, Aguilar et al. 2011, 2012, Alloway 2012, Aguilar et al. 2013a,b), their loads in and around human settlements are a global problem. They enter the soils by different pathways: 1) aerial deposition (industries, vehicles and volcanoes), 2) paints, 3) pesticide and fertilizer application, 4) waste utilization, 5) disposal of dredged sediments and 6) river and irrigation waters (Kabata-Pendias 1993, McClintock 2012, Aguilar et al. 2013b). They pass through the air and food into the human organism, where they are usually not degraded, and hence they accumulate and may cause cancer, neuropathy and other serious diseases (Fubini and Otero 1999, Muhle and Mangelsdorf 2003).
Geostatistic tools are now incorporated in most geographic information systems. Among them, ordinary kriging (OK) interpolates the values of a random field at unobserved locations by using values measured nearby sites. This approach is based on the "first law of geography" that "everything is related to everything else, but adjacent things are more related to each other" (Tobler 1970). However, soil pollution shows a highly skewed nature, and Juang et al. (2004) note that it is inappropriate to use certain geostatistical methods, such as OK to characterize their spatial distributions by a Gaussian assumption.
In contrast, indicator kriging (IK) is a non-parametric geostatistical method, which includes no assumption of normality and uses a binary transformation (0-1 indicators) of data to make the predictor less sensitive to outliers. IK builds the cumulative distribution function at each point on the basis of the pattern and correlation structure of indicator-transformed data points in the neighborhood. IK can be used to estimate the proportion of values that exceed critical concentrations of TE by incorporating the uncertainty of the value of variables at unobserved locations. After the cumulative distribution function is built, it must be post-processed to produce a probability map (Goovaerts 1997, 1999, Antunes and Albuquerque 2013, Aguilar et al. 2013b).
The aim of this study was to analyze the spatial distribution of toxic elements (Pb, Zn, Ni, Cu, Cr and V) in urban topsoil's from MAMC, using the IK and OK geostatistical techniques.
Diagnostic studies of soil pollution by TE should refer to threshold values established in terms of effects on human health. For this purpose, we used: (1) the maximum permissible limits for the Official Mexican Standards (Norma Oficial Mexicana "NOM"), (2) the contamination factor (CF), and (3) the pollution load index (PLI).
MATERIALS AND METHODS
Study area, sampling and chemical analysis
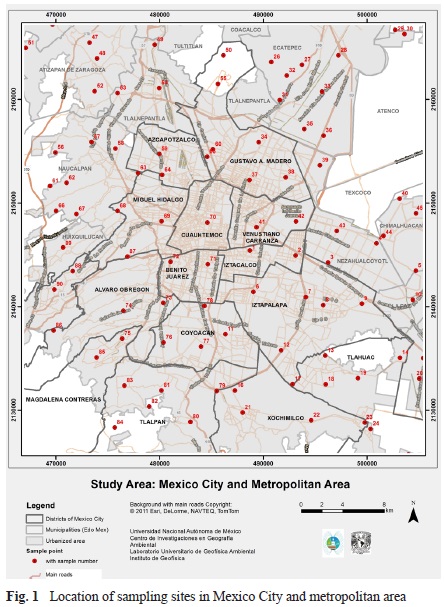
The study area covers almost the entire urbanized area of the MAMC (Fig. 1). Soils were collected using a systematic method. For this purpose, the study area of 1600 km2 was divided into a grid of 10 rows and 10 columns, so that each cell had an edge length of 4 km and an area of 16 km2. The high degree to which the soil was covered made necessary to change some sampling sites within the grid, depending on local conditions. For some sparsely populated peripheral areas by the surroundings of Texcoco and Cuernavaca cities, sampling was omitted for financial reasons. For analysis, samples from 89 sites were collected at a depth of 2 inches using a polyvinyl chloride (PVC) cylinder of 2.5 inches in diameter. The amount of sample sites depends much less on a fixed minimum number than other facts, including the kriging prediction variance and the accuracy which the variogram can estimate. As a rule of thumb is often mentioned a number between 30 and 100 samples (Webster and Oliver 1990). In practice there are only few studies that use more than 100 sampling data.
Each sample was dried for two weeks under the shade and then pulverized in a 2-mm mesh sieve. The total concentrations of Pb, Zn, Ni, Cu, Cr and V were analyzed by energy dispersive X-ray fluorescence (ED-XRF) in the laboratory at the Advanced Research and Studies Center, called Centro de Investigación y de Estudios Avanzados (CINVESTAV), in Mérida, Yucatán. This technique is precise quantitative, fast and non-destructive and can measure a wide range of elements concentrations (C (6)-Fm (100); Khodeir et al 2012, Ramírez et al 2012), with a detection limit of 1 mg/kg even in complex matrices as soils. Only in the case of Ni, the minimum value was below the detection limit.
The powdered soils were pressed into pellets of 1 cm diameter without any chemical treatment or binding agents and inserted into a plastic sample holder covered with a polyester film. ED-XRF analyses were performed with a Jordan Valley EX-6600 spectrometer, equipped with a Si (Li) detector with a 20 mm2 active area and 140 eV resolutions at 5.9 keV, performed at a maximum of 54 kV and 4800 mA. TE were acquired in an air atmosphere using a changeable secondary target. The typical measurement time was 300 s. Each measurement was replicated five times in order to obtain the average concentration. Quantitative data was calculated with a calibration curve of intensity versus concentration of several geological standard reference materials (Lozano and Bernal 2005, Khodeir et al 2012).
Data analyses
The data obtained was analyzed in four stages: a) descriptive statistics were generated, including arithmetic means, standard deviations, minimum and maximum values for TE, b) data was compared with the maximum permissible values, c) pollution indices were applied and d) the geostatistic analysis was conducted.
Permissible limits
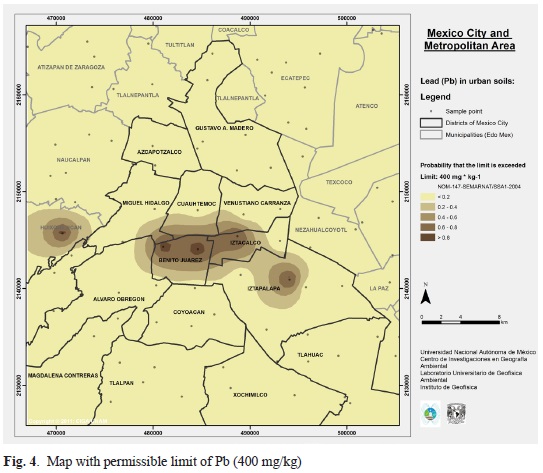
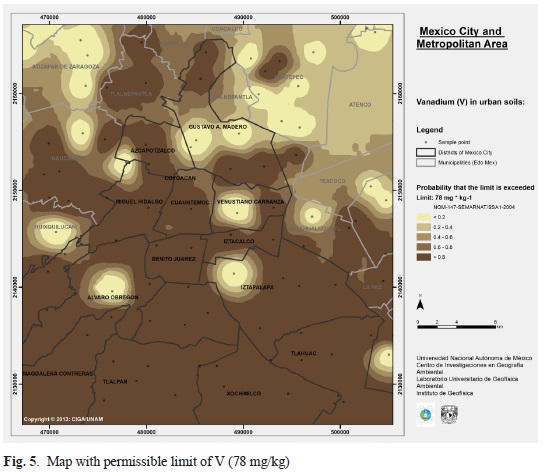
The Official Mexican Standards "NOM-147-SEMARNAT" of Soil Contamination was published by the Ministry of Environment and Natural Resources (Secretaría de Medio Ambiente y Recursos Naturales; SEMARNAT) and include only the permissible limits of Pb (400 mg/kg), V (78 mg/kg), Ni (1600 mg/kg) and Cr (280 mg/kg), but exclude Cu and Zn (SEMARNAT 2007). The Official Mexican Standards are largely based on those of the US Environment Protection Agency (US-EPA 2012).
Pollution indices
Pollution indices are used to quantify TE in soils and sediments and exist as a single index for one metal, as well as an integrated index as a combination of the six elements. In the past, a large number of indices were derived, which include CF, the ecological risk factor, the enrichment factor, the index of geo-accumulation, and the PLI. Unfortunately, there is not always congruence between the different indices and publications (Sutherland 2000, Buccolieri et al. 2006). Therefore, the indices used in this study were defined as follows:
Contamination factor (CF)
The level of soil contamination by TE is a ratio calculated as follows:
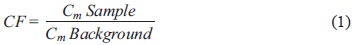
Where, CF is the TE contamination factor, Cm Sample is the metal concentration of the sample and Cm Background is the natural metal content.
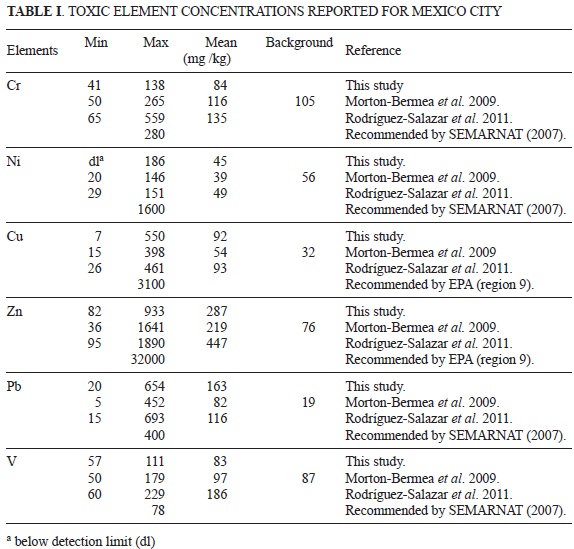
The sample was normalized with a background that reflects the natural metal content of the parent material. The background can be determined by various methods. However, it is often problematic. Certainly, the classical method takes a sample outside of anthropic influence, or at least where it is as low as possible. Estimated minimum distances are given from the study area or the sample is collected in a natural protected area; in this context, literature gives some reference on the concentrations. Hakanson (1980) provides concentrations before the industrialization of Cu 50 mg/kg, Pb 70 mg/kg, Cr 90 mg/kg and Zn 175 mg/kg. It remains questionable any transmission to different conditions (soils, substrate, source rocks). Fortunately, Morton-Bermea et al. (2009) have measured the backgrounds for the MAMC (Table I). These natural concentrations of TE are used for the CF.
CF indicates pollution according to the following intervals: a value below 1 indicates insignificant pollution of the site, a value of 1-3 moderate, 4-6 considerable and >6 very high pollution.
Pollution load index (PLI)
All sites were also analyzed by a synopsis of six elements, which indicates the degree of contamination of the site. The "pollution load index" (PLI) is derived from the unique CF for each site and is calculated as:

Where, CF is the TE contamination factor, n represents the number of metals analyzed.
The PLI is simple to interpret: a value of zero indicates excellent quality, a value of 1 the presence of only baseline levels of pollutants and values above 1 is a progressive deterioration of site quality (Tomlinson et al. 1980).
Geostatistic analysis
A georeferenced data matrix based on TE concentration and indices was constructed. Subsequently a geostatistical analysis was performed with the Gamma Design Software (Robertson 2008), following the sequence: 1) Exploratory data analysis and 2) Spatial autocorrelation. We calculated the experimental semivariograms with the equation:
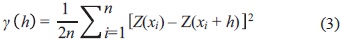
Where, γ (h) is the experimental semivariance value for all pairs at a lag distance h, Z(xi) is the TE concentration and the indices values at the point i, Z(xi+h) is the TE concentration and the indices values of other points separated from xi by a discrete distance h, xi is the georeferenced position where the Z (xi) values were measured, n is the number of pairs of observations separated by a distance h (Isaaks and Srivastava 1989, Hernández-Stefanoni and Ponce-Hernandez 2006, Delgado et al. 2010).
The experimental semivariance was adjusted to the theoretical model of spatial distribution of TE, concentration and TE indices.
OK was used as the interpolation method to obtain point data to plot Cr and PLI maps. IK was used as the interpolation method to obtain point data to plot TE probability maps. The variable measured on a continuous scale is converted to several indicator variables. Each variable takes a value of 1 or 0 at each sampling site and the value of each variable is estimated elsewhere in the study area, with < 1 indicating a value below the threshold level (Cetin and Kirda 2003, Longley et al. 2005).
The TE are continuous variables Z(xi), the indicator variable I(xi, zk) where zk is the desired threshold limit is defined as follows (Goovaerts 1997, 1999):
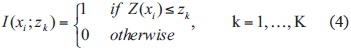
Where K is the number of cutoff. The experimental indicator semivariogram, gl * (h), is then defined for every set of indicators at each cutoff zk as:
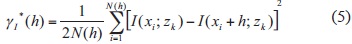
Where N (h) is the number of indicator pairs that transform I(xi; zk) and I(xi+h; zk) separated by vector h. The conditional cumulative distribution function at location x0 is:
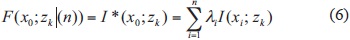
Where I * (x0; zk) is the estimated indicator level at "unsampled location" (all other locations within a raster, where no samples were collected) x0 and l, is the weight assigned to the known indicator value I (xi; zk).
In this case, permissible limits for Pb (400 mg/kg) and V (78 mg/kg) were used as threshold level, for Cu and Zn there are no defined limits (SEMARNAT 2007). A threshold value of CF = 3 was applied to Ni, Cu, Zn, Pb and PLI = 2.
The ArcGIS 9.0 (ESRI 2004) software was used for mapping. For a study of this scale level we used the UTM projection, zone 14, horizontal datum ellipsoid and the World Geodetic System 84 (WGS84).
RESULTS AND DISCUSSION
Permissible limits and indices
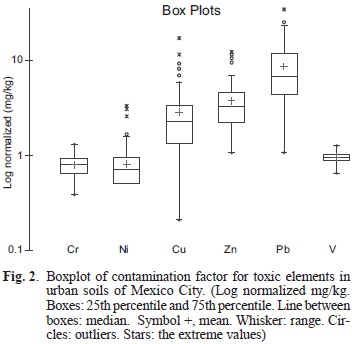
Mean and ranges of concentrations are comparable to others previously recorded for Mexico City (Table I). In all these studies, Cu, Zn and Pb show a wide range of values, whereas the concentrations of V, Cr and Ni are closer to their means (Fig. 2).
Alloway (2012) specified general background values according to their different parent material. The background concentrations outside parenthesis indicate values for igneous rocks (basic). While those in round brackets represents sedimentary rocks (silt and clay): Cr 200 (90) mg/kg, Ni 150 (68) mg/kg, Cu 90 (39) mg/kg, Zn 100 (120) mg/kg, Pb 3 (23) mg/kg and V 250 (130) mg/kg.
The bedrock of MAMC is divided in two major units: basic igneous rocks, such as basalt, andesite and tuff in the south and west and lacustrine sediments in the east, from the former lake of Texcoco. The backgrounds mentioned (Table I) for the Valley of Mexico City by Morton-Bermea et al. (2009) are close to those of lacustrine sediments in Alloway (2012), with the exception of Zn. The mean concentration of V, Ni and Cr in the present study is similar to their background values published in Morton-Bermea et al. (2009). Accordingly, we conclude that concentrations of V, Ni and Cr are determined apparently by the parent material (soils and pollution), whereas elevated concentrations of Pb, Cu and Zn are from anthropic origin.
Skewness values indicate that only Cr (0.36) and V (0.17) are approximately normally distributed. All other metals show a positive skew towards the lower concentrations. This reinforces the assumption that the concentrations of Cr and V had a natural origin as principal component. Localized anthropic sources would act against a normal distribution.
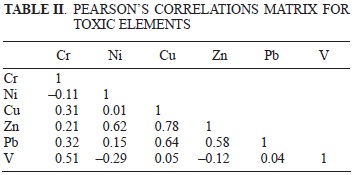
There are some positive correlations between Cu and Zn (0.78), Cu and Pb (0.64), Zn and Ni (0.62) and Pb and Zn (0.58; Table II).
The permissible limits established by the Ministry of Environment and Natural Resources (SEMAR-NAT 2007) are legal references to be applied in studies and reports, yet the limit for Pb was exceeded at four sites (4.5 %) and for V at 63 sites (70.8 %).
The limit for Cr or Ni was not exceeded at any analyzed site. Since no limits for Cu or Zn are specified in the Official Mexican Standards, the values recommended by the US EPA were considered, however the reading for Cu or Zn did not exceed the limit at any site.
These concentrations of TE are slightly lower than those reported in previous studies (Table I). Only 4.5 % of the samples were beyond the permissible limit of Pb, although in 70.8 % of samples, V exceeded the Official Mexican Standards for TE concentration in soils (SEMARNAT 2007). The Official Mexican Standard (SEMARNAT 2007) is largely based on those of the US Environment Protection Agency (US-EPA 2012). The limits set is very high. Although a high load is expected, only a few samples were above the permissible limit. If we take the background into consideration, it becomes clear that the high loads of V are due to the parent material and not to anthropic pollution. Either way, the V is dangerous. However, more research is needed to elucidate the sources of potentially toxic elements.
The background values and the skewness differentiated two groups of metals: a) Cr, Ni and V with a concentration very close to the background and a normal Gaussian distribution and b) Cu, Zn and Pb with a load significantly above the background and a clear skewness. Therefore, the parent rocks cause the concentrations of Cr, Ni and V, while the concentrations of Cu, Zn and Pb are largely of human origin.
Results based on Official Mexican Standards are difficult to interpret in relation to the real load of pollution in urban soils because countries differ in their standards. One of the strictest is the Netherlands where, the standard for Ni is 615 times the Mexican Norm.
Accumulated CF means that although Cr, Ni and V are under the baseline of 1, which is the critical value between insignificant and moderate pollution, Cu (2.87), Zn (3.78) and Pb (8.59) are above it. Pb, Zn and Cu are found in high concentrations in several parts of the city (Table III).
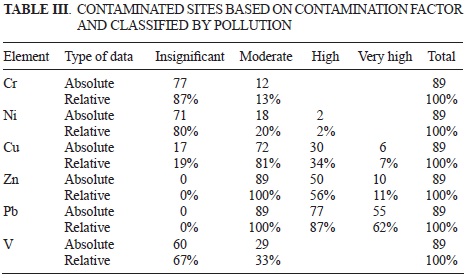
With the obtained results, sites are classified considering the pollutant load, those with a CF below 1 are insignificantly polluted. Polluted sites are divided into three categories: moderate (CF 1-3), high (4-6) and very highly polluted (> 6). Moreover they are (inversely) cumulated, which means samples that were classified as very high are also included in the considerable and moderate categories, in order that only the two "insignificant" and "moderate" records together add up to 100 %.
Most of the samples with Cr (87 %), Ni (80 %) and V (67 %) are unpolluted, while not a single sample with Zn and Pb was classified as insignificant. This means that 100 % of the samples were contaminated with Zn and Pb. In this study, Cu shows a similar pattern as Zn and Pb, although not as immoderate.
There is no general agreement on permissible limits and therefore different thresholds have been suggested (Dosskey and Adriano 1991, Tyler 1992, De Vries and Bakker 1996). For this reason, we also used the contamination factor (CF) and the pollution load index (PLI), which are indicators that have been applied elsewhere worldwide (Caeiro et al. 2005, Mmolawa et al. 2011, Ozkan 2012). The application of these two indices to this study area show a considerable TE loads but no consistent pattern.
Spatial analysis
The normal probability plot for Cr and V is sufficiently closed to linear, thus indicating that their concentrations in Mexico City are approximately normally distributed.
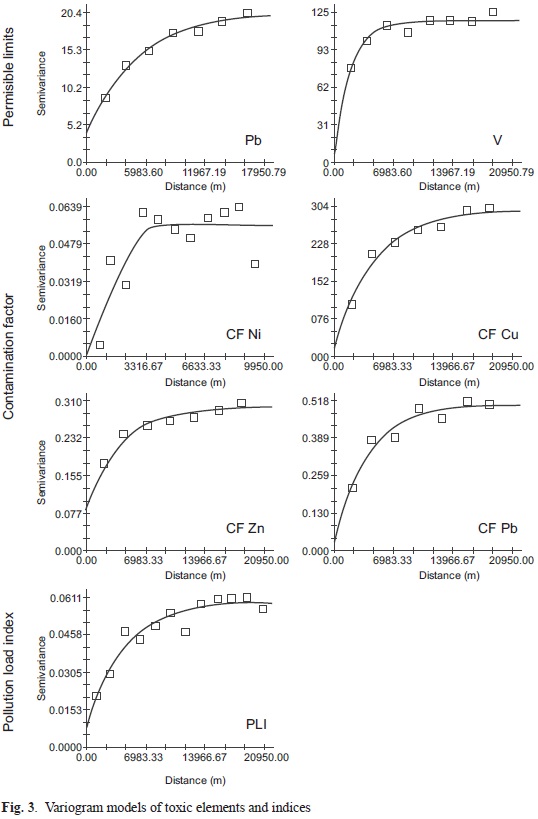
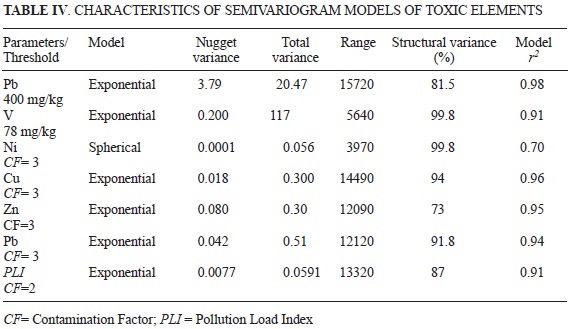
The nugget variance, structural variance and the coefficient of determination (r2; fitness) between experimental and theoretical semivariograms were used to evaluate the model simulations. The TE concentrations and CF were represented by exponential and spherical semivariograms (Table IV) with r2 oscillating from 0.70 to 0.98. The structural variance calculated by [C/(Co + C)]x100 had values oscillating from 73 to 99.8 %. In general, the nugget variance values were low in relation to the structural variance, indicating that the spatial distribution pattern for TE and indices were well identified. Only CF of Zn had nugget values higher than 20 % (Fig. 3).
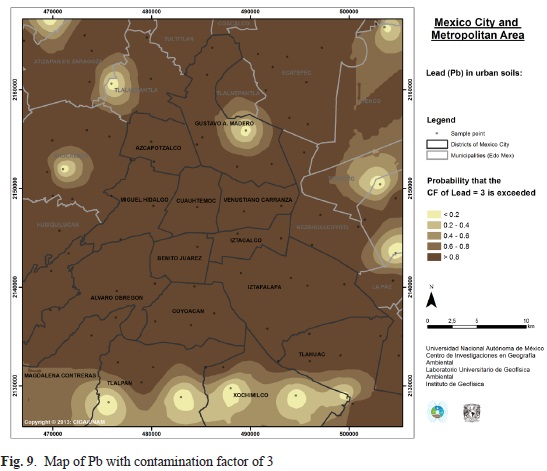
Figures 4 and 5 show the probability based on IK, that the permissible limit of 400 mg/kg for Pb and 78 mg/kg for V will be exceeded. Pb concentrations highlight a few hotspots in the city center and the west area. For V > 70 % of the sampling sites are above the permissible limit, with a gradient increasing from north to south.
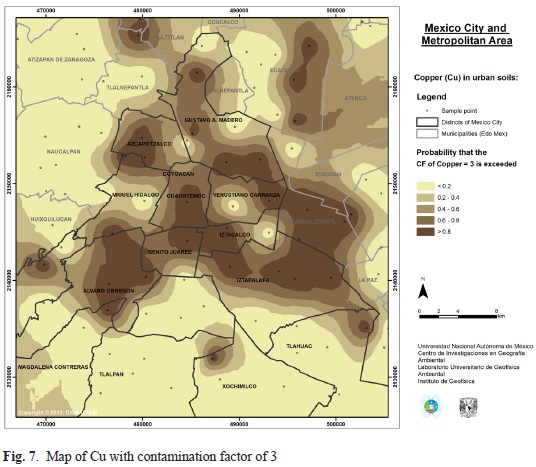
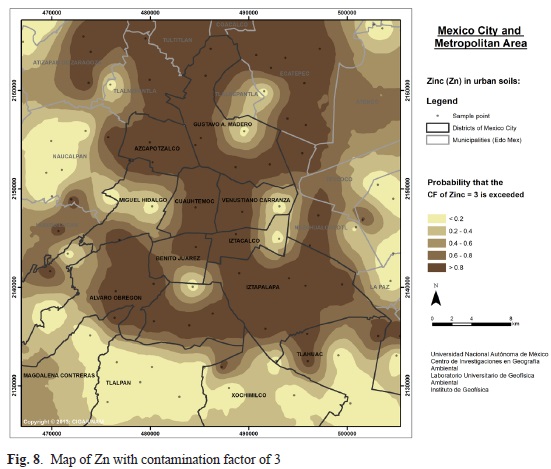
Until now different CF values were considered. Insofar as the maps, however, a fixed uniform limit must be chosen. For the maps started from figures 6 to 9 (6, 7, 8 y 9) a CF of 3 is set. For this reason, in this section we can only present maps for Ni, Cu, Zn and Pb (compare Table IV). Cr and V have no single value in excess of 3.
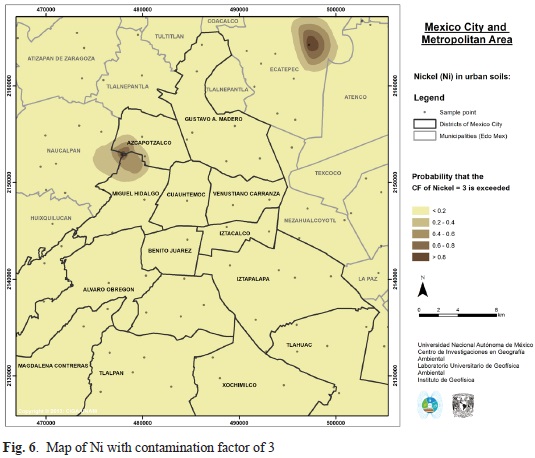
The map for Ni shows bright less polluted areas, with the exception of two distinct hotspots in the northern suburbs. Thus it becomes clear why there is a difference between Ni from both Cr and V. Cr and Ni have only a slight impact on the study area and are significantly different from the group of elements with very high anthropic loads (Cu, Zn, Pb). The maps for Cu (Fig. 7), Zn (Fig. 8) and Pb (Fig. 9) show dark, highly contaminated areas, in this increasing order.
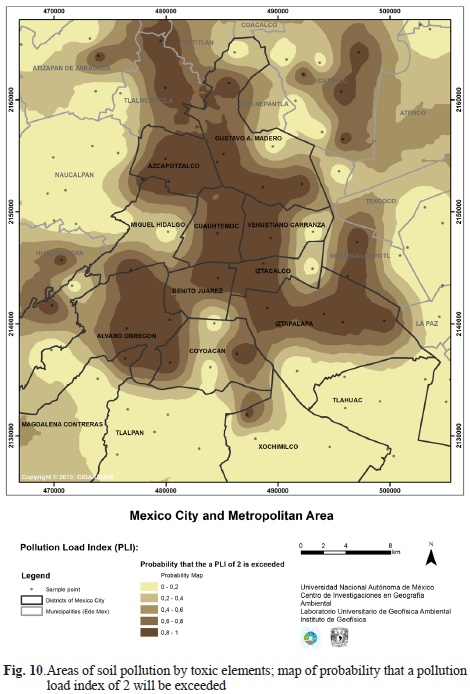
A synthesis of all six of the TE shows high probability of moderate pollution in the districts (Benito Juárez, Iztapalapa, Iztacalco, Venustiano Carranza, Cuauhtémoc, Alvaro Obregón and Gustavo A. Madero precincts) and the northern municipalities (Ecatepec and Tlalnepantla), while the spatially marginal areas of the metropolitan zone have lower probabilities. The map with a PLI = 2 was chosen to identify areas of urgent remediation action (Fig. 10).
Cartographic figures have a practical utility for illustration; however, selecting specific thresholds (CF, PLI) can cause visual impressions to serve a political agenda.
After ascertaining the most polluted areas, it is necessary to identify the chemical compounds of TE in the soil by chemical fractionation (Bautista 1999, Fitamo et al. 2007). This will allow the construction of a mitigation strategy in order to address the problem of soil contamination.
One of the main contributions of this study is the generation of reliable maps of an area of 1600 km2 with 89 sampling points, using geostatistical tools and indicators of pollution.
CONCLUSIONS
After applying interpolation and geostatistical models according to various data management options, the most significant findings of the study are:
The mexican maximum permissible limits are not completely reported for all TE which is concerning, as evidenced by examples of V and Pb.
High loads of Cr and V can be put into another perspective by using the CF with "backgrounds": The high values are originated primarily from the parent rock. However, the danger of Cr and V does not depend on its origin.
The observed high loads of Cu, Zn and Pb are caused mainly by anthropic sources and human activities.
Probability maps as a result of the indicator kriging demonstrate very clearly the spatial distribution of toxic elements all over the urbanized area and identify easily hotspots.
Ni depicts two extreme spots of pollution close to the city limits of Mexico City and Naucalpan. The second one in the municipality of Ecatepec. Based on the map, potential pollutant sources can be fixed spatially.
The TE of Cu and Zn are widespread over the central and northern parts of the urbanized area, especially in the districts of Mexico City: Benito Juárez, Iztapalapa, Iztacalco, Venustiano Carranza, Cuauhtémoc, Alvaro Obregón and Gustavo A. Madero, and the municipalities of Ecatepec and Tlalnepantla.
The high load of Pb is uniformly distributed in high concentration over the entire urbanized area. It represents an important environmental problem.
Results suggest an urgent mitigation strategy for the MAMC. The pollution load index map is an easy and clear way to illustrate the spatial relationships and demonstrate this urgency to the decision-making authorities and local stakeholders as well as to the general community.
ACKNOWLEDGMENTS
We thank to the National Science and Technology Council (Consejo Nacional de Ciencia y Tecnología; CONACyT) for the financial support to the projects CB-2011-01-169915. Rubén Cejudo and Carmen Delgado acknowledge the postdoctoral fellowship awarded by the National Autonomous University of Mexico (Universidad Nacional Autónoma de México; UNAM) and CONACyT, respectively.
REFERENCES
Aguilar R.B., Bautista F., Goguitchaichvili A., Quintana P., Carvallo C. and Battu J. (2013a). Rock-Magnetic properties of topsoils and urban dust from Morelia, México: implications for anthropegenic pollution monitoring in medium-size cities. Geofís. Int. 52-2, 121-133. [ Links ]
Aguilar R.B, Mejía V., Goguitchaichvili A., Escobar J., Bayona G., Bautista F., Morales C.J. and Ihl T. (2013b). Reconnaissance environmental magnetic study of urban soils, dust and leaves from Bogotá, Colombia. Studia Geoph. et Geod. 57,741-754. doi: 10.1007/ s11200-012-0682. [ Links ]
Aguilar R.B., Cejudo R.R., Cruz M.J., Bautista F.,Carvallo C., Goguitchaichvili A. and Morales J. (2012). Ficus benjamina leaves as indicator of athmospheric pollution: A reconnaissance study. Studia Geoph. et Geod. 56, 879-887. [online]: http://www.springerlink.com/openurl.asp?genre=article&id=doi:10.1007/s11200-011-0265-1. [ Links ]
Aguilar B., Bautista F., Gogichaishvili A. and Morton O. (2011). Magnetic monitoring of top soils of Mérida (southern Mexico). Studia Geoph. et Geod. 55, 377388. [online]: http://www.springerlink.com/content/k02152u472808577/. [ Links ]
Alloway B. J. (2012). Heavy metals in soils. Trace metals and metalloids in soils and their bioavailability. 3rd. Ed. Springer Series: Environ. Pollut. 22. London, UK, 631 pp. [ Links ]
Antunes M. H. R. and Albuquerque M. T. D. (2013). Using indicator kriging for the evaluation of arsenic potential contamination in an abandoned mining area (Portugal). Sci. Total Environ. 442, 545-552. [online]: http://dx.doi.org/10.1016/j.scitotenv.2012.10.010. [ Links ]
Bautista F. (1999). Introducción al estudio de la contaminación del suelo por metales pesados. Universidad Autónoma de Yucatán, Yucatán, México. 114 pp. [ Links ]
Buccolieri A., Buccolieri G., Cardellicchio N., Dell'Atti A., Di Leo A. and Maci A. (2006). Heavy metals in marine sediments of Taranto Gulf (Ionian sea, southern Italy). Mar. Chem. 99, 227-235. doi: 10.1016/j.marchem.2005.09.009. [ Links ]
Caeiro S., Costa M. H., Ramos T. B., Fernandes F., Silveira N., Coimbra A., Medeiros G. and Painho M. (2005). Assessing heavy metal contamination in Sado Estuary sediment: An index analysis approach. Ecol. Indicators. 5, 151-169. doi: 10.1016/j.ecolind.2005.02.001. [ Links ]
Cetin M. and Kirda C. (2003). Spatial and temporal changes of soil salinity in a cotton field irrigated with low-quality water. J. Hydrology. 272, 238-249. doi:10.1016/S0022-1694(02)00268-8 [ Links ]
De Vries W. and Bakker D. J. (1996). Manual for calculating Critical Loads of heavy metals for soils and surface waters. Preliminary guidelines for environmental quality criterial calculation methods and input data. DLO Winard Staring Centre. SC Report, Wageningen, The Netherlands. 114 pp. [ Links ]
Delgado C., Pacheco J., Cabrera A., Batllori E., Orellana R. and Bautista F. (2010). Quality of groundwater for irrigation in tropical karst environment: The case of Yucatan, Mexico. Agr. Water Manage. 97, 1423-1433. doi: 10.1016/j.agwat.2010.04.006. [ Links ]
Dosskey M. G. and Adriano D. C. (1991). Trace metal impact on plants: mediation by soil and mycor-rhizae. In: The deposition and fate of trace metals in our environment. (E. S. Verry and S.J. Vermette, Eds.).United States Dept. of Agriculture, Forest Service. General Technical Rept. NC-150. Philadelphia, USA, pp. 105-115. [ Links ]
Duffus J.H. (2002). Heavy metals—a meaningless term?. Pure Appl. Chem. 74, 793-807 [online]: http://www.iupac.org/publications/pac/2002/7405/7405x0793.html. [ Links ] Fitamo D., Itana F. and Olsson M. (2007). Total contents and sequential extraction of heavy metals in soils irrigated with wastewater, Akaki, Ethiopia. Environ. Manage. 39, 178-193. doi:. 10.1007/s00267-006-0074-4. [ Links ]
ESRI. Environmental Systems Research Institute Inc. (2004) . ArcGIS 9. Getting Started with ArcGIS. ESRI, Redlands. [ Links ]
Fubini B. and Otero A.C. (1999) Chemical aspects of the toxicity of inhaled mineral dust. Chem. Soc. Rev. 28, 373- 381. doi: 10.1039/A805639K. [ Links ]
Goovaerts P. (1997). Geostatistics for natural resources evaluation. Oxford University Press. New York, USA. 489 pp. [ Links ]
Goovaerts P. (1999). Geostatistics in soil science: state-of-the-art and perspectives. Geoderma 89, 1-45. doi : 10.1016/S0016-7061(98)00078-0. [ Links ]
Hakanson L. (1980). An ecological risk index for aquatic pollution control, a sedimentological approach. Water Res. 14, 975-1001. doi: 10.1016/0043-1354(80)90143-8. [ Links ]
Hernandez-Stefanoni J.L. and Ponce-Hernandez R. (2006). Mapping the spatial variability of plant diversity in a tropical forest: comparison of spatial interpolation methods. Environ. Monit. Assess. 117, 307-334. doi: 10.1007/s10661-006-0885-z. [ Links ]
Isaaks E.H. and Srivastava R.M. (1989). An introduction to applied geostatistics. Oxford University Press. New York, USA. 561 pp. [ Links ]
Juang K.W., Chen Y.S. and Lee D.Y. (2004). Using sequential indicator simulation to assess the uncertainty of delineating heavy-metal contaminated soils. Environ. Pollut. 127, 229-238. doi: 10.1016/j.envpol.2003.07.001. [ Links ]
Kabata-Pendias A. (1993). Behavioural properties of trace metals in soils. Appl. Geochem. 8, 3-9. doi: 10.1016/S0883-2927(09)80002-4. [ Links ]
Khodeir M., Shamy M., Alghamdi M., Zhong M., Sun H., Costa M., Chen L. and Maciejcczyk P. (2012). Source apportionment and elemental composition of PM2.5 and PM10 in Jeddah City, Saudi Arabia. Atmos. Pollut. Res. 3, 331-40. doi: 10.5094/APR.2012.037. [ Links ]
Longley P.A., Goodchild M.F., Maguire D.J. and Rhind D. (2005) . Geographic Information Systems and Science. John Wiley and Sons. Chichester, UK. 519 pp. [ Links ]
Lozano R. and Bernal J.P. (2005). Characterization of a new set of eight geochemical reference materials for XRF major and trace element analysis. Rev. Mex. Cienc. Geol. 22, 329-344. [online]: http://satori.geociencias.unam.mx/22-3/(4)Lozano.pdf. [ Links ]
McClintock N. (2012). Assessing soil lead contamination at multiple scales in Oakland, California: Implications for urban agriculture and environmental justice. Appl. Geogr. 35, 460-473. doi: 10.1016/j.apgeog.2012.10.001. [ Links ]
Mmolawa K.B., Likuku A.S. and Gaboutloeloe G.K. (2011). Assessment of heavy metal pollution in soils along major roadside areas in Botswana. African J. Environ. Sci. Tech. 5, 186-196. [online]: http://www.ajol.info/index.php/ajest/article/view/71926. [ Links ]
Molina L.T., Madronich S., Gaffney J.S., Apel E., de Foy B., Fast J., Ferrare R., Herndon S., Jiménez J.L., Lamb B., Osornio-Vargas A.R., Russell P., Schauer J.J., Stevens P.S., Volkamer R. and Zavala M. (2010). An Overview of the MILAGRO 2006 Campaign: Mexico City emissions and their transport and transformation. Atmos. Chem. Phys. 10, 8697-8760. doi:10.5194/acp-10-8697-2010. [ Links ]
Morton-Bermea O., Hernández E., Martínez-Pichardo E., Soler-Arechalde A., Lozano-Santa-Cruz R., González-Hernández G., Beramendi-Orosco L. and Urrutia-Fucugauchi J. (2009). Mexico City topsoils: heavy metals vs. magnetic susceptibility. Geoderma 151, 121-125. doi: 10.1016/j.Geoderma.2009.03.019. [ Links ]
Muhle H. and Mangelsdorf I. (2003) Inhalation toxicity of mineral particles: critical appraisal of endpoints and study design. Toxicol. Lett. 140-141, 223-228. doi: 10.1016/S0378-4274(02)00514-3. [ Links ]
Özkan E.Y. (2012). A new assessment of heavy metal contaminations in an eutrophicated bay (Inner Izmir Bay, Turkey). Turk. J. Fish. Aquat Sci. 1, 135-147. doi: 10.4194/1303-2712-v12_1_16. [ Links ]
Ramírez-Herrera T., Lagos M., Hutchinson I., Kostog-lodov V., Machain M.L., Caballero M., Gogichaisvili A., Aguilar B., Chagué-Goff C., Goff J., Ruíz-Fernández A.C., Ortiz M., Nava H., Bautista F., López G.I. and Quintana P. (2012). Extreme wave deposits on the Pacific coast of Mexico: tsunamis or storms? -A multi-proxy approach. Geomorphology, 139: 360-371. [online]: http://www.sciencedirect.com/science/article/pii/S0169555X11005861. [ Links ]
Robertson G.P. (2008). GS+: geoestatistics for the environmental sciences. Gamma Design Software. Plainwell Michigan, USA. 161 pp. [ Links ]
Rodríguez-Salazar M., Morton-Bermea O., Hernández-Álvarez E., Lozano R. and Tapia-Cruz V. (2011). The study of metal contamination in urban topsoils of Mexico City using GIS. Environ. Earth Sci. 62, 899-905. doi: 10.1007/s12665-010-0584-5. [ Links ]
SEMARNAT (2007): Norma Oficial Mexicana NOM-147-SEMARNAT/SSA1-2004, Que establece criterios para determinar las concentraciones de remediación de suelos contaminados por arsénico, bario, berilio, cadmio, cromo hexavalente, mercurio, níquel, plata, plomo, selenio, talio y/o vanadio. Secretaría de Medio Ambiente y Recursos Naturales. Diario Oficial de la Federación. 2 de Marzo 2007. [online]: http://www.profepa.gob.mx/innovaportal/file/1392/1/nom-147-semarnat_ssa1-2004.pdf. [accessed 5 Jul 2014] [ Links ].
Sutherland R.A. (2000). Bed sediment-associated trace metals in an urban stream, Oahu, Hawaii. Environ. Geol. 39, 611-627. doi: 10.1007/s002540050473. [ Links ]
Tobler W. (1970). A computer movie simulating urban growth in the Detroit region. Econ. Geogr. 46, 234-240. doi: 10.2307/143141. [ Links ]
Tomlinson D.C., Wilson D.J., Harries C.R. and Jeffrey D.W. (1980). Problems in the assessment of heavy metals in estuaries and the formation of pollution index. Helgolander Meeresuntersuchunlungen 33. 566-575. doi: 10.1007/BF02414780. [ Links ]
Tyler G. (1992). Critical concentrations of heavy metals in the Moor Horizon of Swedish forests. Swedish Environmental Protection Agency. Solna. Report 4078. [ Links ]
UN (2012). World urbanization prospects: the 2011 revision, United Nations Report. New York, USA. 33 pp. [online]: http://esa.un.org/unup/pdf/WUP2011_High-lights.pdf. [ Links ]
US-EPA (2012). IRIS. United States, Environmental Protection Agency, Integrated Risk Information System. [online]: http://www.epa.gov/iris/. [ Links ]
Webster R. and Oliver M.A. (1990). Statistical methods in soil and land resource surrey. Oxford University Press. New York, USA. 328 pp. [ Links ]

