


Servicios Personalizados
Revista

Articulo
 Inglés (pdf)
 Artículo en XML
 Referencias del artículo
 Enviar artículo por email
Indicadores
 Citado por SciELO
 Links relacionados
-
 Similares en
SciELO
Similares en
SciELO
Compartir

 Permalink
Revista internacional de contaminación ambiental
versión impresa ISSN 0188-4999
Rev. Int. Contam. Ambient vol.27 no.2 Ciudad de México abr. 2011
A unified surface stuctural model for ferrihydrite: proton charge, electrolyte binding, and arsenate adsorption
Un modelo unificado estructural de superficie para la ferrihidrita: carga protónica, enlace electrolítico, adsorción de arsenato
Mario VILLALOBOS1,2 and Juan ANTELO3
1 Grupo de Biogeoquímica Ambiental, Facultad de Química,
2 Instituto de Geología, Universidad Nacional Autónoma de México (UNAM), Coyoacán, Ciudad Universitaria, México 04510 D.F., México. mar.villa@stanfordalumni.org
3 Departamento de Edafología y Química Agrícola, Universidad de Santiago de Compostela, Rúa Lope Gómez de Marzoa s/n, 15782 Santiago de Compostela, España
Recibido marzo 2011
Aceptado abril 2011
ABSTRACT
Ferrihydrite (FH) is a common hydrous ferric oxide nanomineral in aqueous geo–chemical environments. Its small particle sizes (1.5–5 nm) expose a very high specific surface area at the mineral/water interface, and this may have considerable influence on the transport and fate of a variety of trace and major elements through diverse sorption processes. In particular, arsenate anions show a very high affinity for Fe(III) oxide surfaces, including FH, and their fate in contaminated environments is almost invariably associated to these. The extremely small FH nanoparticles, which show high particle aggregation when dried, preclude experimental determination of important surface parameters for the thermodynamic description of its adsorption behavior, such as available specific surface area in aqueous suspension. In the present work we have compiled eight sets of published acid–base surface titration data for synthetic preparations of FH across a wide range of particle sizes, and unified their description through a face–distribution site–density model developed previously for goethite. We show that the surface proton charge behavior of FH in conjunction with its As(V) adsorption behavior may be adequately described using the affinity constants derived for goethite, by assuming the FH surface to be composed predominantly of singly–coordinated >OH groups, with a site density equal to that of the (010) goethite face (Pnma space group). Also, through the applied model the available specific surface area of each FH preparation in aqueous suspension may be successfully derived, showing values between 330 and 1120 m2/g. The implications of the results reported here are highly relevant for predictive purposes of FH surface reactivity in general.
Key words: ferrihydrite, surface structure, point of zero charge, specific surface area.
RESUMEN
La ferrihidrita (FH) es un nanomineral de óxido férrico hidratado común en ambientes geoquímicos acuosos. Sus pequeños tamaños de partícula (1.5–5 nm) exponen una gran área superficial específica en la interfaz mineral/agua, y esto puede tener una influencia considerable en el transporte y destino de una variedad de elementos vestigiales y mayores, a través de diversos procesos de sorción. En particular, los aniones de arseniato muestran una gran afinidad por las superficies de óxidos de Fe(III), incluyendo a la FH, y su destino en ambientes contaminados está casi invariablemente asociado a éstos. Las nanopartículas extremadamente pequeñas de FH, que muestran un alto grado de agregación cuando se secan, impiden la determinación experimental de parámetros superficiales importantes para la descripción termodinámica de su comportamiento de adsorción, tales como el área superficial específica disponible en suspensión. En el presente trabajo hemos recopilado ocho series de datos de titulación superficial ácido–base publicadas de preparaciones sintéticas de FH en un amplio intervalo de tamaños de partícula y hemos unificado su descripción a través de un modelo de distribución de caras cristalinas – densidad de sitios desarrollado previamente para la goetita. Mostramos que el comportamiento de carga superficial protónica de la FH junto con su comportamiento de adsorción de As(V) se puede describir adecuadamente utilizando las constantes de afinidad derivadas para la goetita, asumiendo la superficie de la FH como compuesta predominantemente de grupos superficiales monocoordinados >OH, con una densidad de sitios igual al de la cara (010) de la goetita (grupo espacial Pnma). Además, a través del modelo aplicado se puede derivar exitosamente el área superficial específica disponible de cada preparación de FH en suspensión acuosa, mostrando valores entre 330 y 1120 m2/g. La implicación de los resultados que se reportan aquí es altamente relevante para la predicción general de la reactividad superficial de la FH.
Palabras clave: ferrihidrita, estructura superficial, punto de carga cero, área superficial específica.
Introducción
Ferrihydrite (FH) is a very common Fe oxide nanomineral and the first solid product of fast hydrolysis of aqueous Fe(III) solutions, or rapid oxidation of aqueous Fe(II), under normal ambient conditions (Schwertmann and Cornell 2000). Therefore, it is considered a "young" Fe oxide in natural environments, occurring typically in lakes, streams, and hydromor–phic soils. Its particle sizes range from 1.5 to 5 nm (Murphy et al. 1976, Janney et al. 2000, Theng and Yuang 2008) and cannot surpass 6 nm (Waychunas and Zhang 2008) before transitioning to a more crystalline, usually goethite phase, under humid ambient conditions (Schwertmann and Cornell 2000). These small sizes ensure a large exposed specific surface area (SSA) and thus, a high reactivity towards adsorption of ions in bio–geochemical environments. Therefore, FH when present has a considerable influence in the transport of trace and major ionic species, competing favorably through adsorptive mechanisms against other colloidal minerals present. A thermodynamic description of its surface reactivity is therefore crucial if predictive modeling is desired on the mobility and fate of geochemically and environmentally relevant species in settings where FH forms.
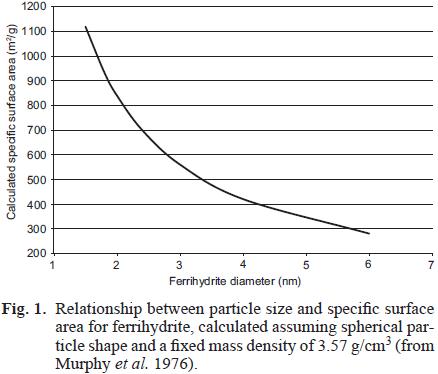
One may calculate the specific surface areas (SSAs) theoretically exposed of individual FH spherical nanoparticles (Fig. 1) as a function of their diameter (d). The inverse relationship between d and SSA [SSA=(6/ρ)/d, where ρ = 3.57 g/cm3 is the mass density for two–line FH; Murphy et al. 1976] results in large increments of SSA when particle size declines in this narrow size range (SSA increases ca. from 300 m2/g to 840 m2/g for a difference of only 3.6 nm diameter; Fig. 1). The nanosize regime of FH brings about experimental difficulties in its structural characterization and determination of its surface reactivity. Considerably larger particle aggregation ensues upon drying FH suspensions, especially of freshly–precipitated samples, causing reduction of exposed surface area (to 200–300 m2/g; Dzombak and Morel 1990), and thus precluding the use of N2–adsorption BET to determine reliable values for actual surface area exposed under aqueous conditions. Therefore, this parameter is arbitrarily chosen for surface area normalization of adsorption data on FH and for their thermodynamic modeling. Typical values recommended for modeling are in an intermediate range from the theoretical interval of figure 1, of 600–650 m2/g (Dzombak and Morel 1990, Hiemstra and Van Riemsdijk 2009).
Recently, Hiemstra and Van Riemsdijk (2009) have shown that the standard structural model for FH (Drits et al. 1993) may be used to propose a surface structure based on that of goethite as a proxy. They were successful in modeling proton and electrolyte binding (Hiemstra and Van Riemsdijk 2009), and U(VI) and carbonate adsorption to FH (Hiemstra et al. 2009) using the charge distribution (CD) and multi–site surface complexation (MUSIC) model, by assuming the crystallographic site densities of goethite faces (101), (010), and (210) (Pnma space group) in equal proportions, as representing the FH surface.
Antelo et al. (2010) investigated the proton charge and phosphate adsorption behavior of a FH sample that was aged and dialyzed for several days, and were also able to model the data by using the same proportions of "goethite" faces, but required assuming a specific surface area of ca. half the value of the former authors. However, in order to be consistent with the above proportions of faces they also required assuming different values of the surface proton and electrolyte affinity parameters from those proposed by Hiemstra and Van Riemsdijk (2009), as well as the optimal internal capacitance considered, C1 (0.74 F/m2 vs. 1.15 F/m2 in the latter work), despite applying the same MUSIC model.
The goal of the present work was to continue on the steps of Hiemstra and Van Riemsdijk (2009) Hiemstra et al. (2009) and Antelo et al. (2010) of using goethite as a proxy for the FH surface, with the aim of unifying the thermodynamic description of the FH surface across all samples. To achieve this, we analyzed the surface proton charge behavior of a larger number of datasets published representing samples across the whole range of particle sizes. The data were modeled in a self–consistent manner, and the optimized affinity parameters generated offered a unified picture with those obtained for goethite from a previous work (Salazar–Camacho and Villalobos 2010). An important outcome of the modeling exercises were the values of actual SSA exposed in aqueous FH suspensions.
In addition, the unified surface acid and electrolyte–binding parameters obtained were applied to the successful description of arsenate adsorption behavior to FH for two reliable data sets from the literature (Raven et al. 1998, Dixit and Hering 2003). We should note that the data analysis and modeling presented in this work apply to two–line FH, and due to lack of adsorption data available for six–line FH no inference can be drawn for this latter phase.
Ferrihydryte surface proton charge analysis
Point of zero net proton charge (PZNPC)
A large amount of work has been devoted to determine surface proton charge behavior of FH, of which the resulting PZNPC values lie in the range of 7.9 to 8.2 (Dzombak and Morel 1990), with average and median values near 8.0, and sometimes even lower values (Kosmulski 2009). All of these were obtained on freshly–precipitated and thus low–particle–sized FH samples. However, recently, higher PZNPC values have been obtained for FH samples that have been both cleaned extensively and from which carbonate has been rigorously excluded (Table I). Accompanying this is the unavoidable process of "aging" effects of the initially–obtained FH samples, most notably manifested in particle growth (to ca. 5 nm; Gilbert et al. 2009).
In table I we have compiled eleven reports of FH PZNPC, of which eight acid–base titration datasets have been used in the analysis presented in this study (note that no sample was dried in order to avoid aggregation problems). We note that all fresh and thus not rigorously de–carbonated FH samples show consistently low values (7.9–8.1), whereas all dialyzed and N2–purged samples after synthesis tend towards higher values (8.6–8.7). These differences from the values of freshly–precipitated FH samples could be interpreted as real surface–driven changes due to different proportions of crystal face distributions exposed in both groups of samples. However, in the case of the freshly–prepared Hsi FH sample (Table I; Hsi and Langmuir 1985), for which a value of 8.15 was reported, we note further that in the same work the PZNPC obtained for a 49 m2/g goethite was 8.3, a value which is considerably lower than expected. Normal PZNPC values for well–decarbonated goethite preparations are found in the range 8.9 to 9.4 (Van Geen et al. 1994, Lumsdon and Evans 1994, Boily et al. 2001, Villalobos et al. 2003).
PZNPC values for goethite below 8.9 are attributed to poor carbonate exclusion previous to acid–base titration experiments (Zeltner and Anderson 1988, Lumsdon and Evans 1994, Villalobos and Leckie 2000), because the source of this carbonate is atmospheric CO2, which acidifies the medium, and even small amounts of CO2 dissolved cause considerable underestimations in the measured PZNPC (Villalobos and Leckie 2000). We know now that a more reliable PZNPC for a 50 m2/g goethite is 8.9 (Van Geen et al. 1994). Therefore the goethite titration data of Hsi and Langmuir (1985) must be corrected by a value near 0.6 pH units. If the same correction is applied to their FH sample a PZNPC of 8.75 is obtained, and we believe this may be a value closer to the real one if carbonate could be excluded from the extremely high SSA of the small nanoparticles obtained when freshly precipitated. We believe that the exposed SSA of freshly–prepared FH is so its synthesis, it is impossible to obtain carbonate–free FH after synthesis, without additional efforts to expel it (which in turn cause aging, particle growth, and ensuing decrease in SSA).
In this manner, we propose here a unified value of 8.8 for the PZNPC of all FH samples across the whole size range of occurrences.
Ferrihydrite surface proton charge behavior
If the surface proton charge of the different FH samples analyzed is plotted normalized by FH mass for equal ionic strengths, and after correcting (i.e., shifting) all to show a PZNPC of 8.8 (Fig. 2a) we may identify three main sample behaviors. Samples processed as freshly–prepared show the highest proton charging values for any given pH; then follows the Hofmann FH sample (Hofmann et al. 2005), and least in charging is the Antelo FH sample. The main difference between the latter two samples and the freshly–prepared FH samples is the reported de–car–bonation process carried out after synthesis (table I).
Since the actual exposed SSA is largely unknown for all samples analyzed we may treat this as an adjustable parameter and we may find the SSA relationship between them that yields a congruent proton charging behavior when data are normalized by surface area. The actual SSA values depend obviously on what particular value is assumed for the chosen starting FH sample. Figure 2b shows the congruent behavior for the optimal SSA values obtained from the modeling exercise in the following section. Only the Raven FH sample continues to show higher charging because the electrolyte anion used was Cl– instead of NO3– as in all the rest. It is well–known that Cl–shows a stronger affinity for the goethite surface than NO3– (Villalobos and Leckie 2000, Rahnemaie et al. 2006), therefore the same may be expected for FH, which causes higher proton charging at pH values below the PZNPC (Fig. 2b).
Freshly–prepared FH samples show optimal SSA values between 840 and 1120 m2/g, corresponding to theoretical particle diameters between 2 and 1.5 nm. The Hofmann FH sample yielded an optimal SSA of 650 m2/g (corresponding to 2.6 nm), which is a value in the range typically used for general FH modeling (Dzombak and Morel 1990, Hiemstra and Van Riemsdijk 2009). Finally, the Antelo FH yielded an optimal value of 337 m2/g (=5 nm), which is very close to the one used by Antelo et al. (2010) to model phosphate adsorption to this FH (350 m2/g), and the corresponding particle size is close to that observed by them using TEM. Also, the experimental BET–SSA values obtained by Glbert et al. (2009) for 5 nm FH particles at pH 5–8 are in the range 305–379 m2/g.
The optimal SSA results obtained strongly suggest that, despite the fact that nanoparticle aggregation has been demonstrated to occur in suspensions of 5–nm FH samples at pH values above 5 (Gilbert et al. 2009), most or all surface area appears to be available for proton, electrolyte, and as will be seen below, for As(V) adsorption in the range of pH values reported (ca. 4–11), indicating that perhaps the FH particle aggregation that occurs in suspension is not sufficiently tight to block its surface binding sites. In other words, the aggregation framework of FH in suspension is sufficiently open and dynamic to not render any surface site as unavailable.
Modeling ferrihydrite surface reactivity
Goethite surface as a proxy
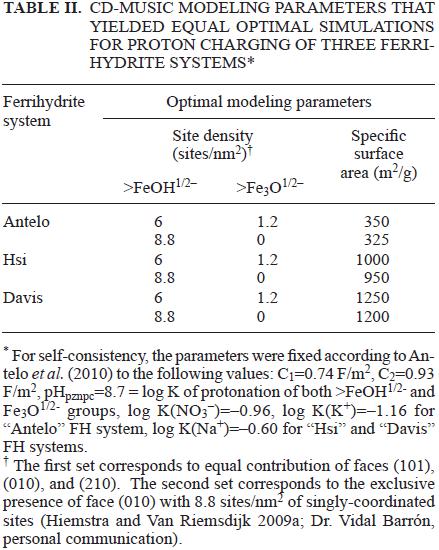
Hiemstra and Van Riemsdijk (2009) proposed a FH surface model based on equal proportions of the goethite faces (101), (010), and (210). We found that FH surface proton charge data may be modeled with the same affinity constants if the proportions of goethite faces are varied, provided the SSA assumed is also varied appropriately, because SSA is highly correlated with the site density parameter. This effectively means that equal simulations are obtained if site densities are changed, by simultaneously changing SSAs in the opposite direction in an appropriate magnitude. Since SSA is an unknown parameter, this yields infinite possibilities for choosing adequate goethite faces proportions to describe FH surface proton charge behavior. For example, in table II we show two optimal modeling combinations SSA–site densities for three FH systems while fixing the other parameters as previously obtained by Antelo et al. (2010) in the framework of the simplified (1–pK) MUSIC model. For this we assumed two different face distributions: equal contributions of the above three faces (with total proton–active site density = 7.2 sites/nm2), and the exclusive contribution of face (010) (with total proton–active site density = 8.8 sites/ nm2). Obviously, in the latter case the SSA required for a correct description of the surface charge is lower for all FH systems, and in principle no particular face distribution seems more appropriate than the other. The small FH particle size range (2–6 nm) and their strong aggregation have proven to be an impediment to get a reliable vision of the FH crystal structure. Recent structural studies by Michel et al. (2007, 2010) allow us to have a better picture of the mineral structure for the FH nanoparticles, but still more information is needed able to recognize which are the crystal faces that have more important contributions.
Nevertheless, if As(V) adsorption data are included in this analysis, the adequate face distribution for the modeling exercise was largely reduced to a large contribution of goethite face (010), as will be shown below.
General surface complexation modeling procedure
Surface proton charge and arsenate adsorption data were modeled using the Triple Layer surface complexation model in combination with aspects of the CD–MUSIC model, in which separate and explicit site densities and affinities of >FeOH, >Fe2OH, and >Fe3OH surface sites were considered. FITEQL 3.2 (Herbelin and Westall 1996) was used to optimize values of afinity parameters for the proton charging and the As(V) adsorption data. Protons were assumed to bind to >FeOH and >Fe3OH sites, while As(V) was assumed to bind to >FeOH sites and adjacent >Fe2OH groups (Salazar–Camacho and Villalobos 2010). From previous work on unifying the modeling description of goethite, the PZNPC of >FeOH and >Fe3OH sites were fixed to 8.8 and 9.66, respectively, and a ΔpKa of 4 was established around each (Salazar–Camacho and Villalobos 2010). Thus, only electrolyte–binding constants were optimized to describe the surface charging behavior of FH nanoparticles. For As(V) adsorption modeling all optimal parameters obtained from simulations of titration data were ixed, including the inner–layer capacitance (Table III), and the affinity constants for the arsenate ions were the only optimized parameters.
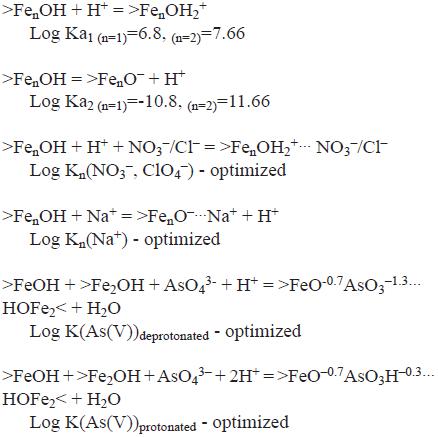
The complete list of formation reactions for surface species considered on >FenOH sites, where n=1 is for singly–coordinated sites, and n=3 is for triply–coordinated sites are:
Proton surface charge modeling on ferrihydrite
In previous work with the more crystalline mineral goethite (α–FeOOH – SSA from 12 to 98 m2/g) we have found a value of 8.8 for the PZNPC of singly (>FeOH) –coordinated surface groups, using a model that combines the main tenets of the Triple Layer Model with some of those from the CD–MUSIC model (Salazar–Camacho and Villalobos 2010). This value coincides with the PZNPC of FH established above, and strongly suggests that >FeOH groups are the major contributors of the FH proton surface charge. This in turn suggests that an adequate face distribution for modeling purposes is one where face (010) predominates over face (101), because the latter contributes with triply (>Fe3OH) –coordinated surface groups, which were found previously to have a PZNPC of 9.66 (Salazar–Camacho and Villalobos 2010). Therefore, the optimal face distribution for FH, from the modeling perspective and tied to the other modeling parameters used, is one where face (010) is the only face considered. If another face distribution is considered, with the inclusion of crystal face (101), and as a result with the inclusion of triply coordinated groups, the optimized values obtained for the electrolyte binding constants compensate to maintain the PZNPC of 8.8, but the simulations progressively worsen (i.e., yield higher errors) as the contribution of face (101) is increased.
Additionally, the model for FH of exclusive presence of face (010) yielded optimal electrolyte–binding constants with values very close to those obtained for goethite on singly–coordinated groups (Table III). The logarithmic values for these constants were 8.07 versus 8.02 for NO3–/ClO4– binding on FH and goethite, respectively; –9.50 versus –9.41 for Na+ binding on FH and goethite, respectively; and 8.35 versus 8.4 for Cl– binding on FH and goethite, respectively (Table III). If face (101) was included in the modeling, the optimal values for the electrolyte–binding constants for FH diverged progressively from those obtained for goethite, and this provides additional support for the chosen FH surface model of exclusive (010) face. Figure 3 shows the optimal simulations for the eight FH systems investigated.
These indings are remarkable because they allow uniication of the proton charging behavior of both goethite and FH using the same values of acidity and electrolyte–binding constants. The only parameters adjusted further for FH were the SSA and the inner–layer capacitance (C1). The optimal FH values for C1 were 0.64 ± 0.06 F/m2, which are smaller than those previously obtained for goethite by Salazar–Camacho and Villalobos (2010). For SSA, the optimal values are given in table I and were discussed above. These values yielded congruency of surface charge behavior when plotted normalized by surface area (Fig. 2b). We should note that the results obtained from the modeling exercise, suggesting that the optimal representation of the FH surface is one where the goethite (010) is the exclusive face present, is a macroscopic result that bears no speciic microscopic evidence.
As(V) adsorption modeling on ferrihydrite
Two FH systems were found in the literature with reliable enough As(V) adsorption data to model: Dixit (Dixit and Hering 2003) and Raven (Raven et al. 1998). Other systems published contained important errors or did not report consistent data between isotherms and pH adsorption edges. Yet another system published with extensive As(V) adsorption data reported exorbitant amounts of As(V) uptake by FH (Pierce and Moore 1982), in which isotherms showed ever increasing adsorption, with values above 35 mmol/g at aqueous As(V) concentrations of ca. 500 µM and pH values ranging from 4 to 10. These dramatic uptake values were impossible to model as simple adsorption, and suggest that under the experimental conditions imposed in this system, coprecipitation processes occurred in the form of Fe(III) arsenate solids (e.g., scorodite).
Figure 4 shows the optimal As(V) adsorption simulations for the Dixit system, according to the parameters shown in table III. The optimal SSA for this system was 989 m2/g, and this is consistent with the fact that freshly–prepared FH samples were used (Dixit and Hering, 2003). The pH adsorption edges (Fig. 4a) and isotherm at pH 4 (Fig. 4c) were adequately simulated, although the its achieved for some edges are not as close to those simulated previously for goethite (Salazar–Camacho and Villalobos 2010). At the higher As(V) loadings and lower pH values model simulations slightly underestimated the adsorption onto FH. The arsenate complex is monodentate on singly–coordinated sites (Fig. 5), but occupies a second adjacent doubly–coordinated site present on the (010) face through H–bonds (Salazar–Camacho and Villalobos 2010). This complex is dominant throughout the pH range (Fig. 4b), but its protonated version becomes relatively important at pH values below 5, and thus predominates in the isotherm at pH 4 (Fig. 4c) above 10 µM aqueous As(V) (not explicitly shown).
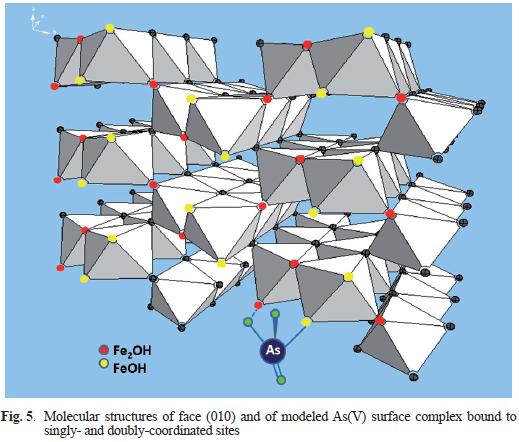
Previous studies suggest that arsenate adsorption on iron oxides occurs via formation of bidentate surface complexes, which may be protonated at low pH values and deprotonated at intermediate to high pH (Sherman and Randall 2003, Stachowicz et al. 2006). In these, the presence of monodentate surface complexes was considered to be a minor contribution. However, a recent spectroscopic study by Loring et al. (2009) confirms that monodentate coordination is the predominant form of arsenate adsorbed on iron oxides. These authors also suggest that arsenate can act as a H–bond acceptor or donor, depending on the pH of the system, with adjacent surface groups (>Fe2OH or >FeOH groups). At low pH values the arsenate surface complex will be protonated and acts as H–bond donor. From intermediate to high pH values the arsenate complex will be deprotonated, becoming a H–bond acceptor to the closest surface sites (Fig. 5). H–bond formation on the arsenate complexes increases their stability and favors arsenate adsorption across the whole pH range.
Figure 6 shows the optimal simulations for the Raven system. Again, the its are quite acceptable but a bit off in comparison to those for goethite. In this system, the deprotonated complex predominates in the isotherm at pH 9.2 (Fig. 6, not explicitly shown). The model underestimates arsenate adsorption at the lower pH values and higher loadings for both systems. The explanation is not clear but may be related to a larger uncertainty in the experimental data reported under these conditions.
Figure 6c shows a comparison of pH adsorption edges between both systems for a very similar total As(V) loading normalized by surface area (0.320.34 mmol/m2), and in both cases the lowest loading analyzed. It is interesting to note that the edge for the Dixit system where arsenate desorbs appears several pH units earlier than that for the Raven system, despite the fact that their SSAs are very similar (989 vs. 840 m2/g), and all modeling parameters are also very similar. The model, although slightly underestimating arsenate adsorption at the higher pH values, predicts quite well this difference in behavior. The explanation for the large difference in both systems is that, despite very similar total As(V)/>FeOH sites ratios (=0.021–0.022) between both FH systems, the SSA of FH is so high that at any particular pH, because the solids concentrations used in each system are very different, the aqueous OH–/>FeOH sites ratio also varies dramatically. The aqueous OH–/>FeOH sites ratio at any given pH is much lower for the Raven system (2 g/L vs. 0.03 g/L for Dixit) and OH– ions exert less competition against As(V) for the surface, and thus As(V) desorbs at a later pH than in the Dixit system. This important solids concentration effect on adsorption observed in FH is unnoticeable in other mineral surfaces with much lower SSA, such as goethite.
Arsenate adsorption on both FH systems was described with the parameter set of table III. The afinity constants for the protonated surface complex are slightly higher than those found for the deprotonated complex, as expected; however, the values for the protonated complex showed the largest uncertainty between FH samples (one log unit difference, table III). The reason for this is that the isotherm data at low pH reported for both systems showed high variability (Figs. 4c and 6b). Also, the Raven adsorption data in general showed large uncertainties in the low–pH area (see arrows in Figs. 6a and b). The larger experimental uncertainties under low pH conditions and high As(V) loadings makes it dificult for the model to provide better its, as was mentioned above.
The values for the afinity constants obtained in the As(V) adsorption simulations for both Dixit and Raven FH systems are very close to, or within those found for goethite (Table III). The agreement between the afinity constants for FH and for goethite is better than that found by Antelo et al. (2010) in their analysis of phosphate adsorption on FH nanoparticles using the CD–MUSIC model. In their study they found affinity constants for FH between two and three orders of magnitude lower than those of goethite, although we should note that they considered formation of bidentate phosphate surface complexes. The close agreement found in the present study supports the use of the goethite surface structure as a proxy for FH nanoparticle surfaces, as an acceptable approach for modeling ion adsorption on this nanomineral.
Conclusions
Proton charging data for a set of eight ferrihydrite (FH) preparations reported in the literature showed widely variable mass–normalized values. Simulation of the data through surface complexation modeling allowed determination of the optimal specific surface area values (SSA) exposed in suspension. Normalizing proton adsorption data by these surface area values provided surface charge congruency behavior among FH samples, and in this manner, the surface proton charge behavior per mass of any FH may be used as a good diagnostics of the actual SSA exposed in suspension. Despite the fact that nanoparticle aggregation has been demonstrated to occur in suspensions of 5–nm FH samples at pH values above 5 (Gilbert et al. 2009), most or all surface area appears to be available for proton, electrolyte, and As(V) adsorption in the range of pH values reported (ca. 4–11). Feshly–prepared FH samples showed the highest SSA values (between 840 and 1120 m2/g), corresponding to particle diameters of 1.5 to 2 nm, whereas aged samples showed lower SSA values (650 and 337 m2/g), corresponding to particle diameters of 2.6 to 5 nm. We suggest the actual point of zero net proton charge (PZNPC) for ferrihydrite is 8.8, regardless of particle size. The lower values reported for fresh FH samples are probably related to inefficient exclusion of surface–bound carbonate from CO2 entrained, at the extremely high surface area exposed on this nanomineral. Small amounts of CO2 entrained may cause underestimation of surface proton charge and thus of the PZNPC.
The FH surface may be successfully macroscopi–cally modeled as composed exclusively of goethite face (010), with a high density of singly–coordinated >FeOH groups (8.8–9.1 sites/nm2), and no triply–coordinated groups present. The optimized values of all surface affinity constants obtained for FH were very similar to those previously obtained for goethite on singly–coordinated >FeOH sites, supporting the above crystal–face model proposed, and indicating that the goethite surface structure is a good proxy to explain the adsorption behavior of FH nanoparticles.
These results are highly relevant for environmental geochemical work, especially for aquatic systems and hydromorphic soils, where FH is present, because they allow in a simplified manner an accurate prediction of the FH surface reactivity based on that of goethite, and thus of the adsorption behavior of relevant species in these environments.
Acnowledgements
J.A. would like to thank Vidal Barrón for the fruitful discussions on the calculations of site densities for the different goethite faces. The authors are grateful to Carlos Salazar–Camacho for preparing figure 5. M.V. appreciates the financial support from PAPIIT Project IN112007 and IFS Project W/3912. J.A thanks the Ministerio de Educación y Ciencia for the financial support under the research project CTM2008–03455.
References
Antelo J., Fiol S., Perez C., Marino S., Arce F., Gondar D. and Lopez R. (2010). Analysis of phosphate adsorption onto ferrihydrite using the CD–MUSIC model: J. Colloid Interface Sci. 347, 112–119. [ Links ]
Boily J.–F., Lutzenkirchen J., Balmes O., Beattie J. and Sjoberg S. (2001). Modeling proton binding at the goethite (alpha–FeOOH)–water interface: Colloids and Surfaces A 179, 11–27. [ Links ]
Davis J.A. (1977). Adsorption of trace metals and complexing ligands at the oxide/water interface. Ph.D. Thesis. Stanford University, Stanford, California, 286 pp. [ Links ]
Dixit S. and Hering J.G. (2003). Comparison of arsenic(V) and arsenic (III) sorption onto iron oxide minerals: Implications for arsenic mobility: Environ. Sci. Technol. 37, 4182–4189. [ Links ]
Drits V.A., Sakharov B.A., Salyn A.L. and Manceau A. (1993). Structural model for ferrihydrite: Clay Min. 28, 185–207. [ Links ]
Dzombak D.A. and Morel F.M.M. (1990). Surface complexation modeling. Hydrous ferric oxide. John Wiley. New York, 393 pp. [ Links ]
Gilbert B., Lu G. and Kim C.S. (2007). Stable cluster formation in aqueous suspensions of iron oxyhydroxide nanoparticles. J. Colloid Interface Sci. 313, 152–159. [ Links ]
Gilbert B., Ono R.K., Ching K.A. and Kim C.S. (2009). The effects of nanoparticle aggregation processes on aggregate structure and metal uptake. J. Colloid Interface Sci. 339, 285–295. [ Links ]
Herbelin A.L. and Westall J.C. (1996), FITEQL. A computer program for determination of chemical equilibrium constants from experimental data. Report 94–01. Version 3.2. Department of Chemistry, Oregon State University. Corvallis, Oregon, USA. [ Links ]
Hiemstra T. and Van Riemsdijk W.H. (2009). A surface structural model for ferrihydrite: I. Sites related to primary charge, molar mass, and mass density. Geochim. Cosmochim. Acta 73, 4423–4436. [ Links ]
Hiemstra T., Van Riemsdijk W.H., Rossberg A. and Ulrich K.–U. (2009). A surface structural model for ferrihydrite: II. Adsorption of uranyl and carbonate. Geochim. Cosmochim. Acta 73, 4437–4451. [ Links ]
Hofmann A., van Beinum W., Meeussen J.C.L. and Kretzschmar R. (2005). Sorption kinetics of strontium in porous hydrous ferric oxide aggregates II. Comparison of experimental results and model predictions. J. Colloid Interface Sci. 283, 29–40. [ Links ]
Hsi C.–K. D. and Langmuir D. (1985). Adsorption of uranyl onto ferric oxyhydroxides: Application of the surface complexation site–binding model. Geochim. Cosmochim. Acta 49, 1931–1941. [ Links ]
Jain A., Raven K.P. and Loeppert R.H. (1999). Arsenite and arsenate adsorption on ferrihydrite: Surface charge reduction and net OH– release stoichiometry. Environ. Sci. Technol. 33, 1179–1184. [ Links ]
Janney D.E., Cowley J.M. and Buseck P.R. (2000). Transmission electron microscopy of synthetic 2– and 6–line ferrihydrite. Clay Clay Min. 48, 111–119. [ Links ]
Kosmulski M. (2002). The pH–dependent surface charging and the points of zero charge. J. Colloid Interface Sci. 253, 77–87. [ Links ]
Kosmulski M. (2009). Compilation of PZC and IEP of sparingly soluble metal oxides and hydroxides from literature. Adv. Colloid Interface Sci. 152, 14–25. [ Links ]
Loring J.S., Sandstrom M.H., Noren K. and Persson P. (2009). Rethinking arsenate coordination at the surface of goethite. Chem.–Eur. J. 15, 5063–5072. [ Links ]
Lumsdon D.G. and Evans L.J. (1994). Surface complex–ation model parameters for goethite (a–FeOOH). J. Colloid Interface Sci. 164, 119–125. [ Links ]
Michel F.M., Ehm L., Antao S. M., Lee P. L., Chupas P. J., Liu G., Strongin D. R., Schoonen M. A. A., Phillips B. L. and Parise J. B. (2007). The structure of ferrihydrite, a nanocrystalline material: Science 316(5832), 1726–1729. [ Links ]
Michel F.M., Barron V., Torrent J., Morales M.P., Serna C. J., Boily J.F., Liu Q.S., Ambrosini A., Cismasu A.C. and Brown G.E. (2010). Ordered ferrimagnetic form of ferrihydrite reveals links among structure, composition, and magnetism. Proc. Natl. Acad. Sci. U. S. A. 107, 2787–2792. [ Links ]
Murphy P.J., Posner A.M. and Quirk J.P. (1976). Characterization of partially neutralized ferric nitrate solutions. J. Colloid Interface Sci. 56, 270–283. [ Links ]
Nagata T., Fukushi K. and Takahashi Y. (2009). Prediction of iodide adsorption on oxides by surface complexation modeling with spectroscopic confirmation. J. Colloid Interface Sci. 332, 309–316. [ Links ]
Pierce M.L. and Moore C.B. (1982). Adsorption of arsenite and arsenate on amorphous iron hydroxide. Water Res. 16, 1247–1253. [ Links ]
Rahnemaie R., Hiemstra T. and Van Riemsdijk W.H. (2006). A new surface structural approach to ion adsorption: Tracing the location of electrolyte ions. J. Colloid Interface Sci. 293, 312–321. [ Links ]
Raven K.P., Jain A. and Loeppert R.H. (1998). Arsenite and arsenate adsorption on ferrihydrite: Kinetics, equilibrium, and adsorption envelopes: Environmental Science and Technology, 32, 344–349. [ Links ]
Salazar–Camacho C. and Villalobos M. (2010). Goethite surface reactivity: III. Unifying arsenate adsorption behavior through a variable crystal face – site density model. Geochim. Cosmochim. Acta 74, 2257–2280. [ Links ]
Schwertmann U. and Cornell R.M. (2000). Iron oxides in the laboratory. Preparation and characterization. John Wiley. Weinheim, Germany, 188 pp. [ Links ]
Sherman D.M. and Randall S.R. (2003). Surface complexation of arsenic(V) to iron(III) (hydr)oxides: Structural mechanism from ab initio molecular and RXAFS spectroscopy. Geochim. Cosmochim. Acta 67, 4223–4230. [ Links ]
Spadini L., Schindler P.W., Charlet L., Manceau A. and Ragnarsdottir K.V. (2003). Hydrous ferric oxide: Evaluation of Cd–HFO surface complexation models combining Cdk EXAFS data, potentiometric titration results, and surface site structures identified from mineralogical knowledge. J. Colloid Interface Sci. 266, 1–18. [ Links ]
Stachowicz M., Hiemstra T. and van Riemsdijk W.H. (2006). Surface speciation of As(III) and As(V) in relation to charge distribution. J. Colloid Interface Sci. 302, 62–75. [ Links ]
Theng B.K.G. and Yuan G. (2008). Nanoparticles in the soil environment. Elements 4, 395–399. [ Links ]
Van Geen A., Robertson A.P. and Leckie J.O. (1994). Complexation of carbonate species at the goethite surface: Implications for adsorption of metal ions in natural waters. Geochim. Cosmochim. Acta 58(9), 2073–2086. [ Links ]
Villalobos M. and Leckie J.O. (2000). Carbonate adsorption onto goethite under closed and open CO2 conditions. Geochim. Cosmochim. Acta 64, 3787–3802. [ Links ]
Villalobos M., Toner B., Bargar J. and Sposito G. (2003). Characterization of the Mn oxide produced by Pseudomonas putida strain MnB1. Geochim. Cosmochim. Acta 67, 2649–2662. [ Links ]
Waychunas G.A. and Zhang H. (2008). Structure, chemistry, and properties of mineral nanoparticles. Elements 4, 381–387. [ Links ]
Yates D.E. (1975) The structure of the oxide/aqueous electrolyte interface. Ph.D. Thesis. University of Melbourne. Melbourne, Australia, 272 pp. [ Links ]
Zeltner W.A. and Anderson M.A. (1988). Surface charge development at the goethite/aqueous solution interface : effects of CO2 adsorption. Langmuir 4, 468–474. [ Links ]

