


Serviços Personalizados
Journal
Artigo
 texto em
  Inglês (pdf)
 Artigo em XML
 Referências do artigo
 Enviar este artigo por email
Indicadores
-
 Citado por SciELO
 -
 Acessos
Links relacionados
-
 Similares em
SciELO
Similares em
SciELO
Compartilhar

 Permalink
Investigaciones geográficas
versão On-line ISSN 2448-7279versão impressa ISSN 0188-4611
Invest. Geog no.112 Ciudad de México Dez. 2023 Epub 22-Abr-2024
https://doi.org/10.14350/rig.60741
Articles
Statistical, Synoptic, and Thermodynamic Analysis of Hailstorms in the Mexican Plateau
*
+
 http://orcid.org/0009-0003-1314-9672
**
http://orcid.org/0000-0001-6896-5798
* Facultad de Ingeniería Ambiental, Decanato de Ciencias Biológicas, Universidad Popular Autónoma del Estado de Puebla, 17 sur #901, Barrio de Santiago C.P. 72410, Puebla, Pue., México.
** Facultad de Ingeniería Ambiental, Decanato de Ciencias Biológicas, Universidad Popular Autónoma del Estado de Puebla, 17 sur #901, Barrio de Santiago C.P. 72410, Puebla, Pue., México. Email: franciscojavier.sanchez@upaep.mx
*** Instituto de Geografía, Universidad Nacional Autónoma de México, Circuito Exterior, Ciudad Universitaria, Coyoacán, C.P. 04510, Ciudad de México, México. Email: jleon@geografia.unam.mx
¶ Facultad de Ingeniería Ambiental, Decanato de Ciencias Biológicas, Universidad Popular Autónoma del Estado de Puebla, 17 sur #901, Barrio de Santiago C.P. 72410, Puebla, Pue., México. Email: estefania.martinez@upaep.mx
This study shows a statistical, synoptic and thermodynamic analysis of hailstorms in the Mexican Altiplano (AL-ME), a region that concentrates a large number of events each year. For this purpose, the annual cycle of hailstorms was calculated and related to storm and rain events, and databases from the National Meteorological Service (SMN) of the meteorological observatories of Puebla, Tlaxcala, State of Mexico, Hidalgo and Mexico City, during the period 1981-2017, were used. In addition, three severe hail events were selected and analyzed through satellite images of the infrared (IR) channel, synoptic charts, proximity soundings and composite maps of meteorological variables made with ERA5 reanalysis data. The results show that hail events increase in April and decrease in November. The vertical profiles generated allowed identifying the thermodynamic characteristics of these phenomena, where values of Available Convective Potential Energy between 642 J/kg and 2166 J/kg, Convective Inhibition from 0 J/kg to -28 J/kg and a good performance of the Elevation Index, between -3 and -7, were observed for hail detection. Finally, synoptic patterns that favored the analyzed hailstorms were identified, such as high pressure over the Gulf of Mexico and a trough over the study region, which predominated during the three events.
Keywords: hail; extreme weather events; climatology; proximity survey; synoptic analysis
Este estudio muestra un análisis estadístico, sinóptico y termodinámico de las granizadas en el Altiplano Mexicano (AL-ME), región que concentra una gran cantidad de eventos cada año. Para ello se calculó el ciclo anual de las granizadas y se relacionó con eventos de tormenta y lluvia, y se emplearon bases de datos del Servicio Meteorológico Nacional (SMN) de los observatorios meteorológicos de Puebla, Tlaxcala, Estado de México, Hidalgo y Ciudad de México, durante el periodo de 1981-2017. Además, seleccionando tres eventos de granizo severo y se analizaron a través de imágenes de satélite del canal infrarrojo (IR), cartas sinópticas, sondeos de proximidad y mapas compuestos de variables meteorológicas realizadas con datos de reanálisis ERA5. Los resultados muestran que los eventos de granizo se incrementan en abril y disminuyen en noviembre. Los perfiles verticales generados permitieron identificar las características termodinámicas de estos fenómenos, donde se observaron valores de Energía Potencial Convectiva Disponible entre 642 J/kg y 2166 J/kg, Inhibición Convectiva de 0 J/kg a -28 J/kg y un buen rendimiento del Índice de Elevación, entre -3 y -7, para la detección de las granizadas. Finalmente, se identificaron patrones sinópticos que favorecieron las granizadas analizadas, como son una alta presión sobre el Golfo de México y una vaguada sobre la región de estudio, mismas que predominaron durante los tres eventos.
Palabras clave: granizo; eventos meteorológicos extremos; climatología; sondeo de proximidad; análisis sinóptico
INTRODUCTION
Hailstorms have been studied worldwide for being extreme and punctual meteorological phenomena that usually cause considerable adverse effects in the areas of occurrence. It can be defined as precipitation of irregular ice conglomerates formed in clouds with strong convective activity. It begins with water drops that are carried by upward currents within a cumulonimbus cloud, causing increasing cooling to freezing temperatures, and hail is formed (Banchero, 2017). When hailstone particles are too heavy to be sustained by the ascending currents, they fall to the ground.
The size of hail varies from 5 millimeters in diameter to stones the size of a golf ball or larger. The latter represents a greater danger to society (Prieto et al., 2021); such storms have resulted in the loss of human lives (Dube y Rao, 2005) and countless economic damages. However, most impacts are commonly observed in rural regions (particularly in the agricultural sector), while urban areas usually show impacts on hydraulic infrastructure, sewage, housing, road network, and the automotive industry (Allen et al., 2017; Allen y Tippett, 2021; Peña-Beltrán y Pabón-Caicedo, 2020; Punge y Kunz, 2016; Schemm et al., 2016). For instance, the sum of economic losses due to hailstorms in the agricultural, urban, and automotive sectors in Germany, Belgium, and France amounted to EUR 5.1 billion in 2013 and 2014 alone (Punge y Kunz, 2016), while the United States of America (U.S.) estimates average losses in property and crop damage of around 850 million dollars each year (Gagne et al., 2017).
In Mexico, estimated losses due to hailstorms amount to millions of pesos per year, mainly in the automotive industry. It is estimated that the city of Puebla, Mexico, suffered losses of 20 million dollars due to the impact of hail to newly produced vehicles during 2017 (Campetella, 2018). In this same state, the agricultural sector reported losses of 266.5 million pesos between 2011 and 2017 (Ruiz, 2018). Nationwide, losses of around 7 billion pesos were estimated in 2008 alone (Martínez et al., 2013).
Hailstorms are recorded virtually all over the world, related to strong convective activity (Baldi et al., 2014; Kunz et al., 2009; Novo y Raga, 2013). Previous studies have indicated that convection gives rise to hailstorms and frontal systems (Schemm et al., 2016). In addition, the relationship of temporal and spatial characteristics of hailstorm frequency with thermodynamic factors has been explored; for example, high relative humidity (RH), low convective inhibition (CIN) and elevation index (LI) values, high available convective potential energy (CAPE) values, and strong wind shear (Beal et al., 2020; Lkhamjav et al., 2017). Another relationship previously studied in the Mexican context is the interaction of tropical cyclones, east waves, and cold fronts that boost convective development and favor hail storms (León-Cruz et al., 2021).
In Mexico, little is currently known about the characteristics of convective and hail storms. Some studies on the characteristics of this type of phenomenon in central Mexico using radar and satellite data have shown its spatio-temporal distribution and some of its characteristics (Jiménez et al., 2012; León-Cruz et al., 2021; Novo y Raga, 2013). Recently, the environmental conditions associated with hail and thunderstorms in Mexico have also been characterized using a proximity survey approach with reanalysis data (León-Cruz et al., 2023).
Previous studies have identified that the Mexican states most affected by hailstorms are Puebla, Hidalgo, Tlaxcala, Estado de México, and Mexico City (Jiménez et al., 2012). Since it is currently impossible to avoid considerable damage from hail (Baldi et al., 2014), it represents a potential hazard that may lead to significant economic losses in various sectors - and, indeed, generates them, according to the available statistics. In this sense, contributing to the knowledge of these phenomena through the analysis of the annual cycle, seasonal variation, and spatial distribution (Mezher et al., 2012; Santos y Belo-Pereira, 2018; Zhang et al., 2008) is vitally importance for risk and emergency managers.
In this context, this study aims to present an updated climatology of hailstorms in the Mexican Plateau and examines, through case studies, the main characteristics of these storms using various meteorological data sources.
Study Area
Central Mexico is characterized by a long strip of high ground that crosses it in an east-west direction and covers a large part of the so-called Mexican Plateau (ME-PL) (Novo and Raga, 2013). The study area included the State of Mexico, Puebla, Tlaxcala, Hidalgo, and Mexico City (CDMX) (Figure 1). The highest zones in the study area are located in Puebla, with the volcanoes Citlaltepetl or Pico de Orizaba (5610 m a.s.l.), Popocatepetl (5465 m a.s.l., and La Malinche (4461 m a.s.l.).
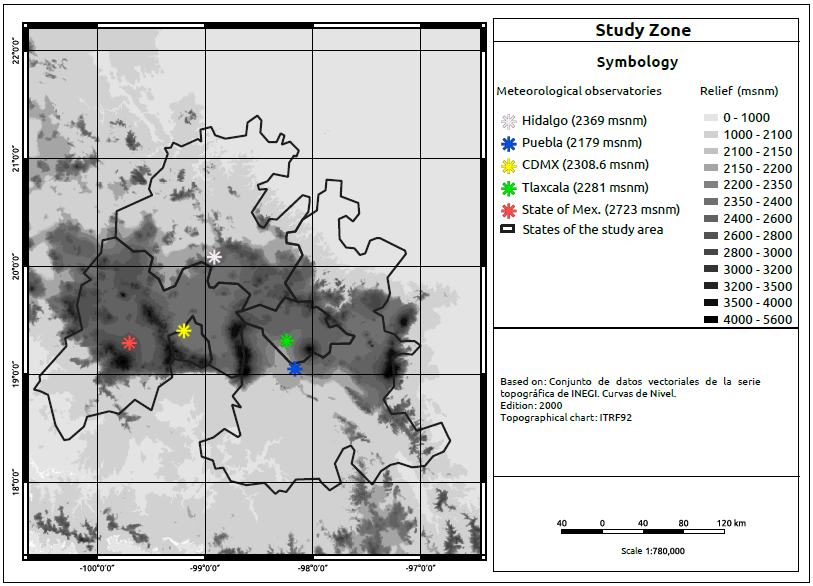
Source: Own elaboration.
Figure 1 Map showing the location of the study area. The relief and location of the meteorological stations included in the study are shown.
The climate of the study area by State is represented as follows: 99 % of the territory of Tlaxcala, 87 % of CDMX, 73 % of the State of Mexico, and 35 % of Puebla have a temperate-subhumid climate, while 39% of the territory of Hidalgo has a dry/semi-dry climate and 33 %, a subhumid temperate climate (INEGI, 2021). The study area also harbors a large population exposed to severe weather events such as hailstorms. According to the latest national population census (INEGI, 2021), this region concentrates 37 million inhabitants, representing 29.5 % of the Mexican population.
DATA AND METHODS
Hail Database
Ground meteorological stations have been used for several analyses of hailstorms, especially to determine the climatology associated with this phenomenon (p. ej., Beal et al., 2020; Jelić et al., 2020; Peña-Beltrán y Pabón-Caicedo, 2020). This study used information from five ground meteorological stations of Mexico’s National Meteorological Service (SMN) (Figure 1). These meteorological stations record hailstorms following the guidelines provided by the SMN through the National Water Commission (CONAGUA, in Spanish) in the Theoretical-Practical Manual of Ground Meteorological Stations (CONAGUA, 2010), a document that has adopted the technical bases suggested by the World Meteorological Organization (WMO). The database used includes daily hailstorm records from 1 January 1981 to 31 December 2017. Using these data, a statistical analysis of precipitation, temperature, and storm events was carried out to confirm hailstorm events (Beal et al., 2020; Santos y Belo-Pereira, 2018).
Since hail is a meteorological phenomenon with a high spatio-temporal variability usually associated with local damage, sometimes it is not recorded by meteorological stations (Beal et al., 2020). For this reason, to detect hailstorms that caused significant effects in the cities surrounding the stations, this study used information from digital media, similar to other investigations (Kahraman et al., 2016). This information supplemented the data recorded by meteorological stations and provided additional information on the severity of hailstorm events.
Selection of Case Studies
In addition to the data mentioned above and information gathered from meteorological stations, we used reports published in the Official Journal of the Federation (DOF, in Spanish) of the Mexican government, particularly the declarations of disaster and emergency associated with hailstorms in the study area. The second search aimed to identify cases with high social impact that would later serve for in-depth investigation. From the information collected, three case studies were selected: 11 August 2006 (Case 1), 17 August 2014 (Case 2), and 16 June 2016 (Case 3). The selection of case studies based on reports on their impact helped us identify the severity of hailstorms, an aspect not contemplated by meteorological stations and not reflected in the SMN databases.
Reanalysis Data
For the analysis of the case studies, we used ERA5 reanalysis data from the European Centre for Medium-Range Weather Forecasts (ECMWF) (Hersbach et al., 2020). The objective of using these data was to analyze the conditions in the upper atmosphere and identify, through synoptic composites and proximity surveys, the atmospheric conditions that gave rise to hailstones in the study region. ERA5 data have been widely used in the literature to analyze hailstorm events (e.g., Beal et al., 2020; Jelić et al., 2020; Lkhamjav et al., 2017; Punge et al., 2017; Santos y Belo- Pereira, 2018). These data cover the period from January 1959 to date and are provided by the Copernicus Climate Change Service (C3S). ERA5 provides hourly estimates of a large number of atmospheric terrestrial and oceanic climate variables in a 0.25°×0.25° grid. It resolves the atmosphere using 37 pressure levels (1000 hPa-1 hPa) from the ground to an approximate height of 80 km (Hersbach et al., 2020).
For this study, we selected the variables geopotential height, relative humidity, zonal (U) and southern (V) wind components, divergence, and vertical velocity were selected for the 37 available pressure levels. The data for the above levels were used to generate a synoptic analysis at three mandatory levels (250 hPa, 500 hPa, and 850 hPa) for the selected case studies. In addition, with the same ERA5 reanalysis data, proximity surveys were generated for each study case using the Rapid Computing and Visualization of Convective Parameters from Rawinsonde and NWP Data (Taszarek et al., 2023). This free-access R package contains a collection of functions for the rapid calculation and visualization of convective parameters commonly used in the operational prediction of severe convective storms. It is worth mentioning that proximity surveys refer to the selection of the grid point and time closest to the place and time of the hailstorm.
Statistical Treatment
The databases of the five meteorological stations were integrated into a single database to facilitate their handling and treatment through the Python programming language. Each station has a total of 13 515 days of information for each variable; considering the three variables used (day with hail, day with storm, and cumulative daily precipitation), this translates into a total of 40 545 data per meteorological station. With these data, we calculated the percentage of days with no observations, yielding an average of 91.5 % of days with records. Since the percentage of days with no records is less than 15 % in all stations and the previous literature has set a threshold of up to 20 % (e.g., Mezher et al., 2012) of missing data, we decided to use all the data.
During the study period, 584 hailstorm events were recorded in the five meteorological stations. The State of Mexico and Tlaxcala meteorological stations recorded the highest percentage of events with 1.4 %, followed by CDMX with 0.8 %, Puebla with 0.6 %, and Hidalgo with 0.4 % (Table 2). The results were used to calculate the annual and seasonal hailstorm cycles in the study area. In addition to hailstorm events, we calculated the annual cycle of storm and rain events to analyze the spatio-temporal variability and the relationship between variables.
Table 1 Percentage of missing data by meteorological station.
| Station | No. of days with data | No. of days with no data | % missing data |
| CDMX | 40 545 | 2348 | 5.8 |
| Puebla | 40 545 | 5227 | 12.9 |
| State of Mex. | 40 545 | 317 | 0.8 |
| Tlaxcala | 40 545 | 4064 | 10.0 |
| Hidalgo | 40 545 | 5369 | 13.2 |
| Total | 202 725 | 17 325 | 8.5 |
RESULTS AND DISCUSSION
Annual Hailstorm Cycle
The warm season is a characteristic of the highest frequency of hailstorms, which occurs between May and August in the northern hemisphere and between October and March in the southern hemisphere (Zhou et al., 2021). For the study area,
the results show that the most active period of hailstorms ranges from April to August (Figure 2), related to the warm and humid season that occurs during spring and summer in Mexico, similar to other countries such as China, Argentina, Australia and Mongolia (Lkhamjav et al., 2017; Mezher et al., 2012; Schuster et al., 2005; Zhang et al., 2008).
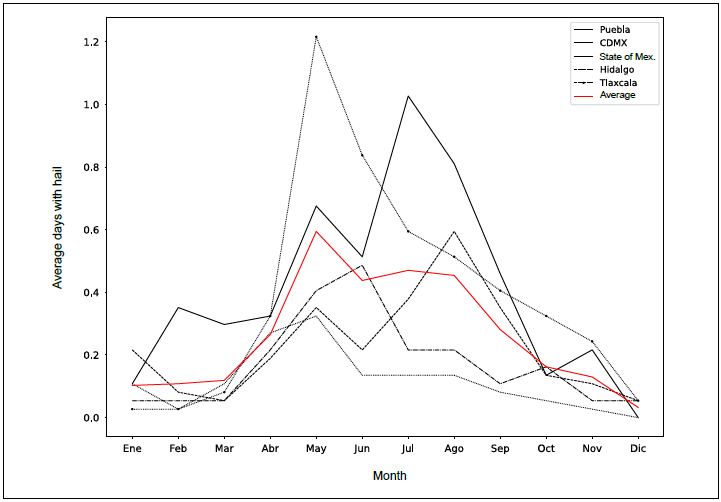
Source: Own elaboration.
Figure 2 Monthly average number of days with hailstorm events for the five stations analyzed (1981-2017).
The warm and wet season in the country indicates surface heating that can generate convection and convergence. These processes transport moisture and can cause thunderstorms, possibly producing hail (Novo and Raga, 2013; Prieto et al., 2021). Besides, mesoscale and synoptic-scale phenomena such as tropical cyclones, eastern waves, and cold fronts have also been related as triggers of thunderstorms that produce hail, with the frontal systems being those that most commonly generate this type of phenomenon (León-Cruz et al., 2021).
The states of Tlaxcala and Hidalgo show the peak of hailstorm events in May, Puebla in June, the State of Mexico in July, and CDMX in August (Figure 2). These differences can be explained by the geographic location of the meteorological stations. First, humidity flows from the Gulf of Mexico prevail at the beginning of the season in the study area; later, moisture flows from the Pacific Ocean join in in late summer, which, along with the relief, regulate the deep convection activity in the study area (Figure 3). The above can also explain the increase in hailstorm events in Puebla, Hidalgo, and Tlaxcala in the spring, as these stations are located closer to the Gulf of Mexico slope, and moisture flows arrive in greater proportion before reaching Mexico City and the State of Mexico (León-Cruz et al., 2021; Novo y Raga, 2013).
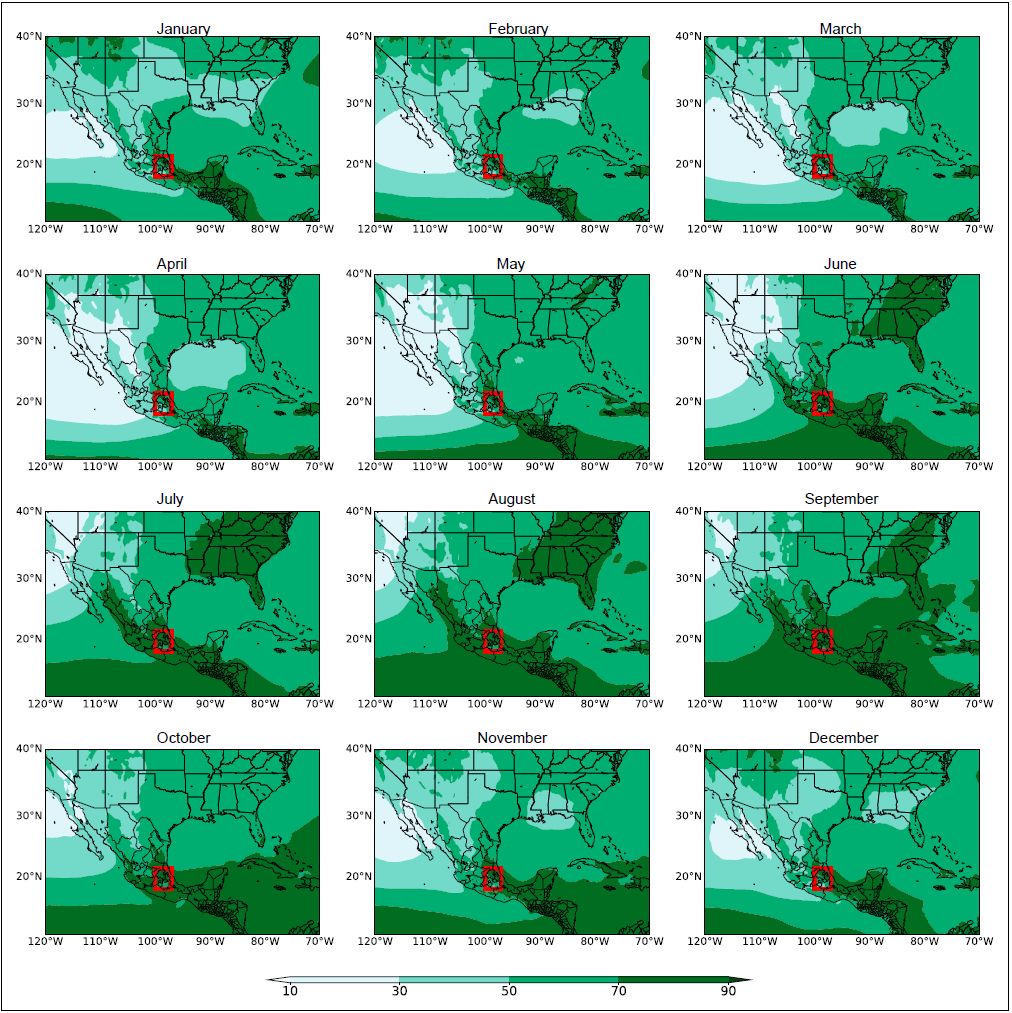
Source: Own elaboration.
Figure 3 Monthly average (1981-2017) of relative humidity (%). The red square indicates the study area.
The stations at CDMX and the State of Mexico record the highest frequency of hailstorm events; the latter, which is the station at the highest altitude, recorded the highest number of hail events (Table 2). The altitude of stations can be related to the location of the 0 °C isotherm, which influences the freezing point and the probability of hailstone formation and is consistent with previous studies (Beal et al., 2020; Lkhamjav et al., 2017; Mezher et al., 2012; Zhang et al., 2008; Zhou et al., 2021).
Annual Cycle of Storm and Rain Events
Thunderstorms are atmospheric phenomena that regularly cause heavy rains and hailstorms (Jiménez et al., 2012; Prieto et al., 2021; Santos y Belo-Pereira, 2018). Figure 4 shows the annual cycle of hail, rain, and thunderstorm events. The results show the relationship of these phenomena with the hot and humid season in the study region.
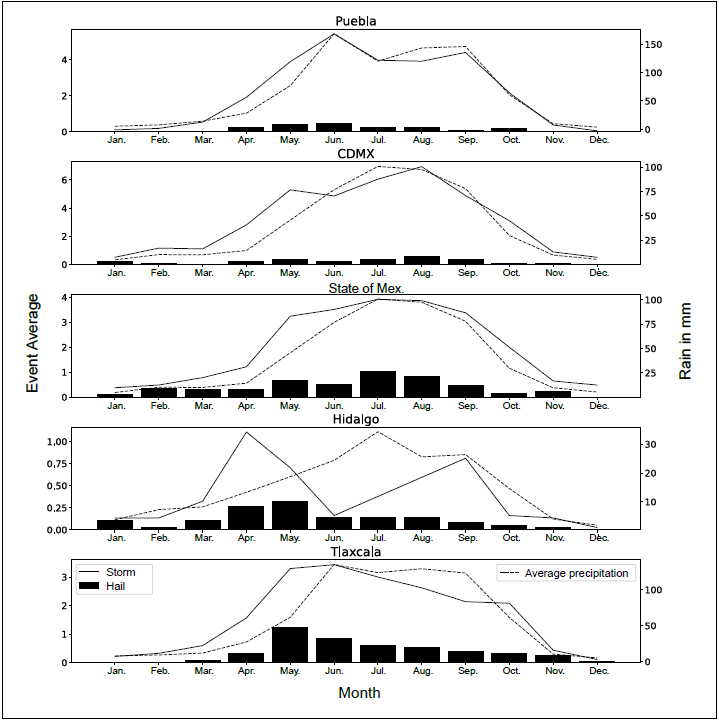
Source: Own elaboration.
Figure 4 Annual cycle of precipitation (dashed line), storm (solid line), and hail (black bars) events.
Stations record peak storms in April in Hidalgo, June in Puebla and Tlaxcala, July in the State of Mexico, and August in CDMX. The five meteorological stations record December as the month with the lowest frequency of storm events (Figure 4). Generally, there is a higher frequency of storms in May, consistent with Prieto et al. (2021).
The annual cycle of precipitation (Figure 4) for Puebla and Tlaxcala shows the main peak in June and another in August, with a relative trough in July. Hidalgo showed peaks in July and September and a relative trough in August, while CDMX and the State of Mexico do not show this pattern. Similarly, precipitation increases between April and May and decreases in October and November, as reported by Méndez et al. (2008); this same pattern is observed for both hail and storms.
ANALYSIS OF CASE STUDIES
Case 1 (hailstorm of 11 August 2006)
On 2 September 2006, the DOF1 published a declaration of climatological contingency for damages caused by hail that affected the municipality of Terrenate, Tlaxcala, on 11 August 2006, coinciding with the hail storm recorded in the Tlaxcala meteorological station. On 7 September 2006, the DOF2 published another declaration of climatological contingency for damages caused by hail that affected the municipality of Tepetitlán, Hidalgo, on the same date of occurrence, although the Hidalgo state meteorological station did not record this hailstorm.
The interpreted image of SMN weather systems (Figure 5) shows a trough that spanned from the central-eastern USA to central Mexico and interacted with tropical wave No. 24. This configuration favored convective storms in the study region, similar to previous reports in the literature (León-Cruz et al., 2021).
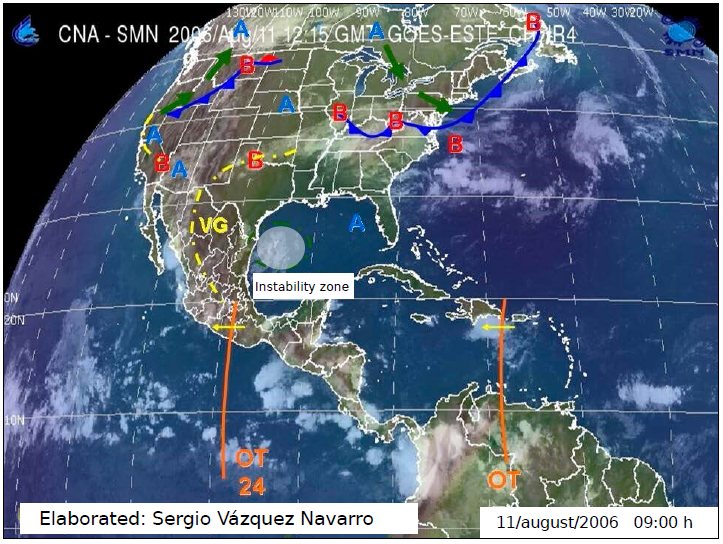
Source: Image provided by the SMN.
Figure 5 Interpreted image of meteorological systems that affected the country on 11 August 2006 at 09:00 hours.
The GOES IR4 satellite image (Figure 6) shows the cloud tops that coincide with the location of the hailstorms recorded in Hidalgo and Tlaxcala. In this sense, and according to the data provided, deep clouds are estimated with tops around 12 km.
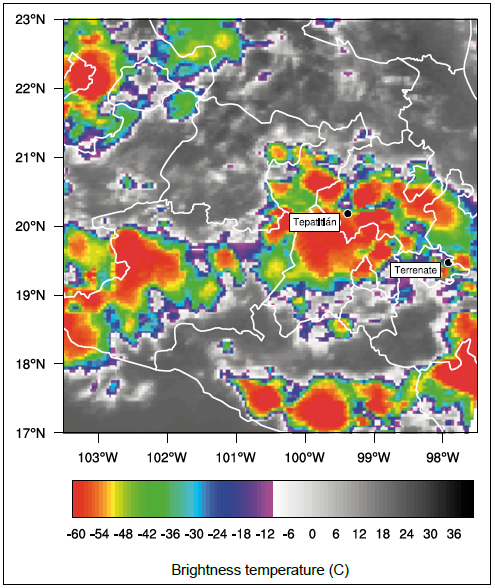
Source: Own elaboration.
Figure 6 GOES infrared satellite image (IR4) (Knapp y Wilkins, 2018) for 11 August 2006 at 23:00 UTC (18:00 local time).
The proximity survey (supplementary material) shows CAPE values of 642 J/kg, CIN of -2 J/kg, LI of -3, lifting condensation level (LCL) of 515 m, level of free convection (LFC) of 565 m, relative humidity (RH) of 80 % at ground to 2 km and 68 % at 2 km to 5 km altitudes. Regarding temperature, it was 15.8 °C at ground level and -6.0 °C at 500 hPa, with the 0 °C isotherm observed at 2485 m. A weak wind shear of 3.1 m/s was observed from low to high levels, mainly from the ground to 6 km, with the equilibrium level (EL) observed at 9650 m. The above indicates an unstable atmosphere associated with the synoptic configuration of tropical wave No. 24 and the low-pressure channel over the study area, which favored deep convection.
The analysis of the RH, geopotential, and wind fields at 850 hPa shows an anticyclonic circulation over the Gulf of Mexico, which favors the entry of moisture flows to the study region, similar to the configuration observed in previous studies on intense storms in Mexico (León-Cruz et al., 2021; Novo y Raga, 2013). The passage of a tropical wave and a low geopotential (Figure 7a) are also observed, coinciding with the analysis of the SMN (Figure 5). The vertical velocity at 500 hPa is coupled with the divergence at 250 hPa for the state of Tlaxcala (Figure 7b), complementing the instability indicated by the proximity survey and shown in the satellite image (Figure 6).
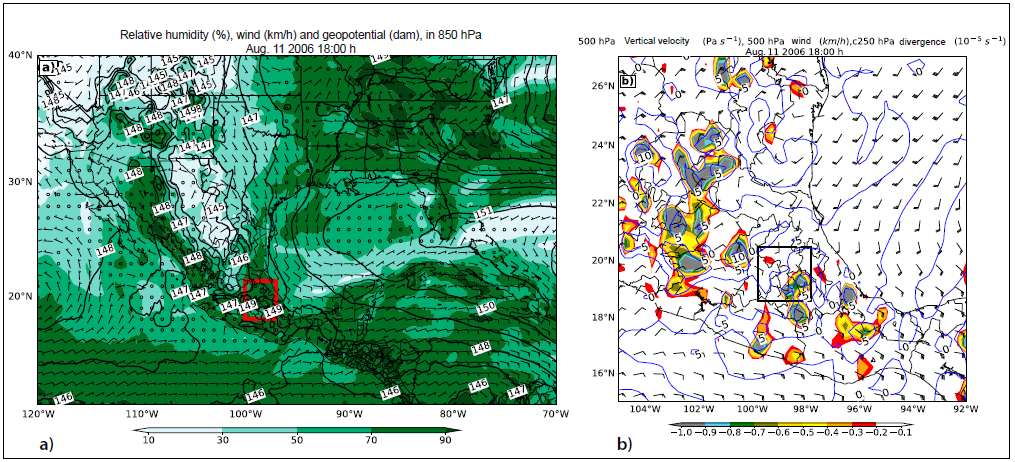
Source: Own elaboration.
Figure 7 a) Relative humidity (%) with the wind vector field (km/h) and geopotential height represented by a black solid line and marked at 1-decameter intervals, all at 850 hPa. b) Vertical velocity (Pa/s) and wind vector field (km/h), both at 500 hPa. Divergence at 250 hPa (10-5/s) is marked with the blue solid line, and the approximate zone of hailstorm occurrence is marked with the red box.
Case 2 (hailstorm of 17 August 2014)
This event was recorded in the CDMX meteorological station database and coincided with the declaration of disaster due to severe rain and hail in the Miguel Hidalgo delegation on 17 August 2014, published in the DOF3 on 27 August 2014. Likewise, a declaration of the municipality of Naucalpan de Juarez, State of Mexico, as a disaster zone was issued on the same publication date in the DOF4 and with the date of occurrence of the hailstorm; however, the meteorological station database of that area has no record of a hailstorm.
The interpreted image of SMN weather systems (Figure 8) shows a trough spanning from the northwest to the center of Mexico. Also observed is the prevalence of high pressure and its ridge extending near the coast of the Gulf of Mexico, which favored the entry of moisture flows into central Mexico. The GOES IR4 satellite image (Figure 9) shows a well-defined convective core represented by cloud tops with brightness temperatures of about -60 °C that can be associated with altitudes between 12 km and 13 km. The core of the storm identified from the satellite image matches the approximate locations where the hailstorm was recorded.
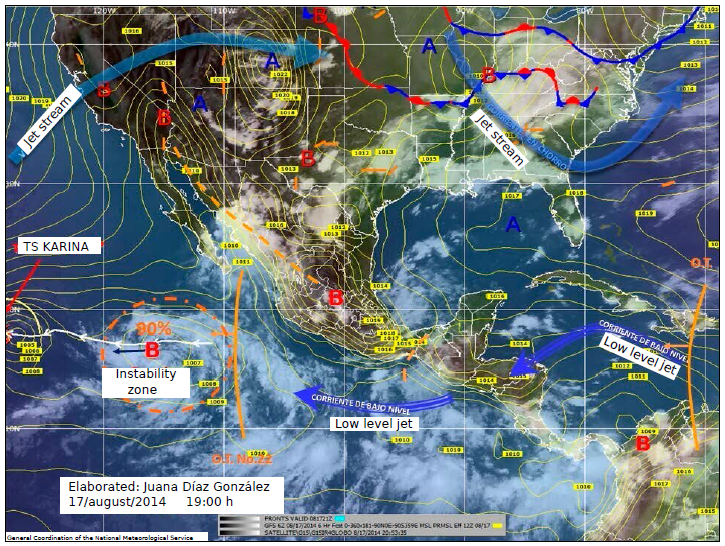
Source: Image provided by the SMN.
Figure 8 Interpreted image of meteorological systems that affected the country on 17 August 2014 at 19:00 hours.
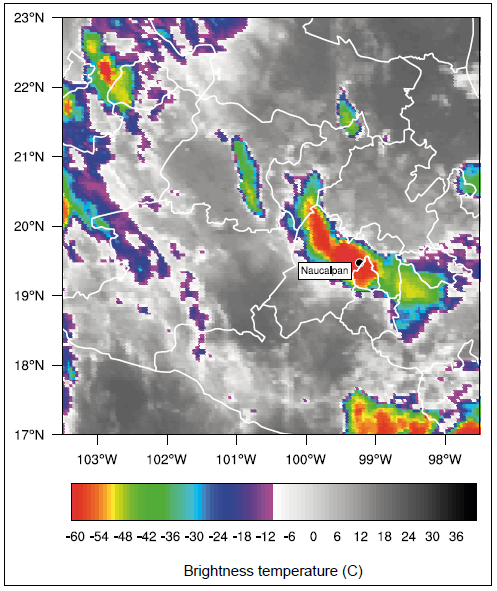
Source: Own elaboration.
Figure 9 GOES infrared satellite image (IR4) (Knapp y Wilkins, 2018) for 18 August 2014 at 03:00 UTC (22:00 local time on 17 August 2014).
The proximity survey (supplementary material) yielded CAPE values of 2166 J/kg, CIN of 0 J/kg, LI of -7, and RH values of 71 % from ground level to 2 km and 66 % from 2 km to 5 km, LCL of 550 m, and LFC also of 550 m. Regarding temperature, it was 16.8 °C at ground level and -7.5 °C at 500 hPa, while the 0 °C isotherm was observed at 1890 m. A wind shear of 11.3 m/s is observed at high levels (8 km) associated with the jet stream, favoring the equilibrium level at 11 630 m. The above indicates a highly unstable atmosphere with a high probability of convective development. It is worth mentioning that this survey showed a value of 0.2 for the Significant Hail Parameter (SHIP); although it does not reach the threshold of a severe hailstorm (1 to 2), it indicates the possibility of hailstorm formation.
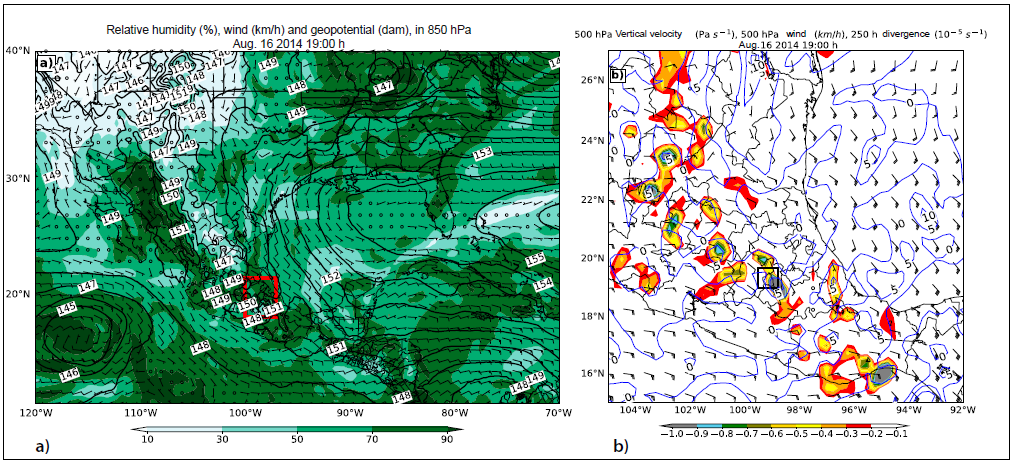
The synoptic fields for RH, wind, and geopotential at 850 hPa (Figure 10a) show a geopotential peak over the Atlantic Ocean with its ridge extending to the north Gulf of Mexico. This peak produces an anticyclonic movement that promotes moisture flow penetration into the ME-PL. Similarly, a geopotential trough spanning from the north to the center of Mexico is observed; this same system is observed in the SMN interpreted image (Figure 8), associated with a trough. Likewise, the vertical velocity at 500 hPa coincides with the divergence at 250 hPa (Figure 10b), and wind flows along the coast of the Gulf of Mexico have the same direction at 850 hPa and 250 hPa (Figure 10b). The coupling of various dynamic components of the atmosphere confirms that it was humid and unstable, which boosted the development of convective storms favorable for hailstorms.
Source: Own elaboration.
Figure 10 a) Relative humidity (%) with the wind vector field (km/h) and geopotential height represented by a black solid line and marked at 1-decameter intervals, all at 850 hPa. b) Vertical velocity (Pa/s) and wind vector field (km/h), both at 500 hPa. Divergence at 250 hPa (10-5/s) marked with the blue solid line.
Case 3 (hailstorm of 16 June 2016)
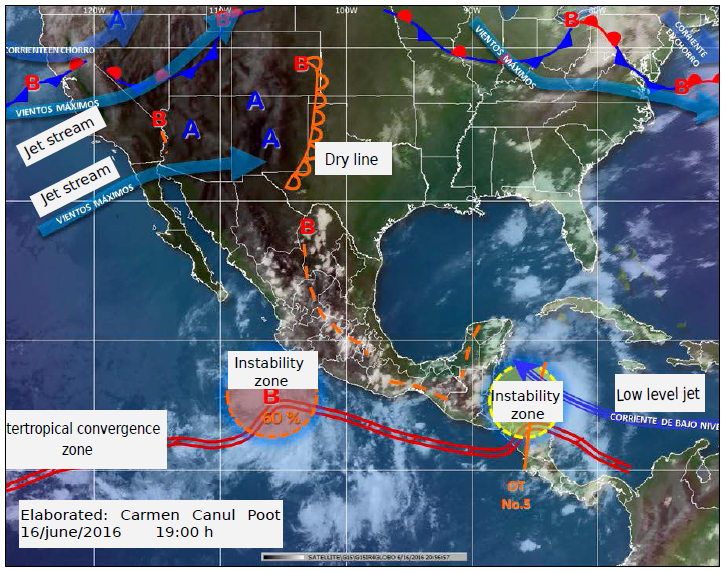
This hailstorm was recorded in the Puebla and Tlaxcala meteorological station databases. Although no emergency declaration was published in the DOF for these events, the digital press5 confirmed the hailstorm severity in Puebla city, Tlaxcala, and CDMX, causing reduced visibility when driving and flooding in the main avenues due to the clogging of the drainage system. The interpreted image of the SMN meteorological systems (Figure 11) shows a trough spanning from the Northern Plateau to the center of Mexico, in addition to an instability zone with a 60 % probability of evolving into a tropical cyclone near the coasts of Jalisco and Colima. The circulation associated with the instability zone and the trough favored the advection of humidity from the Pacific Ocean necessary for the formation of storms toward central Mexico.
Source: Image provided by the SMN.
Figure 11 Interpreted image of meteorological systems that affected the country on 16 June 2016 at 19:00 hours.
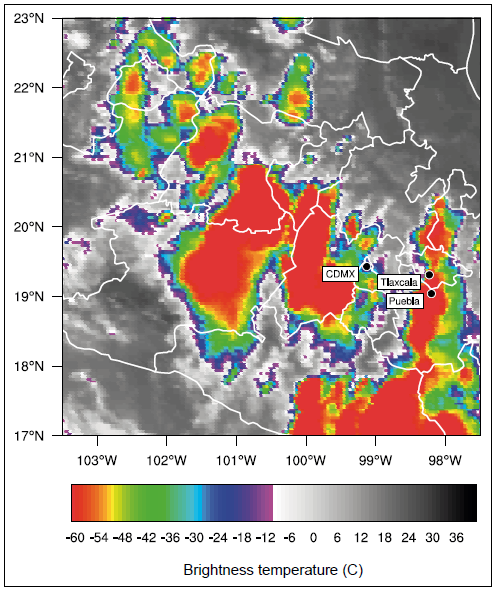
The GOES IR satellite image (Figure 12) shows, for the time close to the hailstorm, cloud tops with temperatures ranging from -50 °C to -60 °C, representative of deep convection and cloud development heights between 12 km and 13 km. It is important to note that the areas with the greatest representation of deep convection coincide, similar to the previous cases, with the approximate places where hailstorms were recorded.
Source: Own elaboration.
Figure 12 GOES infrared satellite image (IR4) (Knapp y Wilkins, 2018) for 17 June 2016 at 00:00 UTC (19:00 local time for 16 June 2016).
The proximity survey (supplementary material) yielded a CAPE of 1338 J/kg, CIN of -28 J/kg, LI of -5, RH of 71 % from ground level to 2 km and 57 % from 2 km to 5 km. Concerning temperature, it was 19.8 °C at ground level and -6.3 °C at 500 hPa, with the 0 °C isotherm observed at 2852 m and LCL and LFC levels of 865 m and 1445 m, respectively. Also, a strong shear of 11.3 m/s was observed at high levels (8 km), contributing to the equilibrium level at 11800 m. Similar to the previous cases, the instability indexes used showed the potential of convection for the study area. This survey yielded a SHIP value of 0.1; similar to Case 2, this value does not reach the thresholds that determine a severe hailstorm, but it indicates the possibility of hailstorm formation.
The synoptic fields for RH, wind, and geopotential at 850 hPa show a low geopotential channel from the north to the center of the country. Additionally, a geopotential peak is observed over the Caribbean Sea. Its ridge extends to the northern Gulf of Mexico, generating an anticyclonic circulation that favors the penetration of moisture flows from the Gulf of Mexico to a large area in central and eastern Mexico (Figure 13a), consistent with synoptic configurations previously described in the literature (León-Cruz et al., 2021; Novo y Raga, 2013).
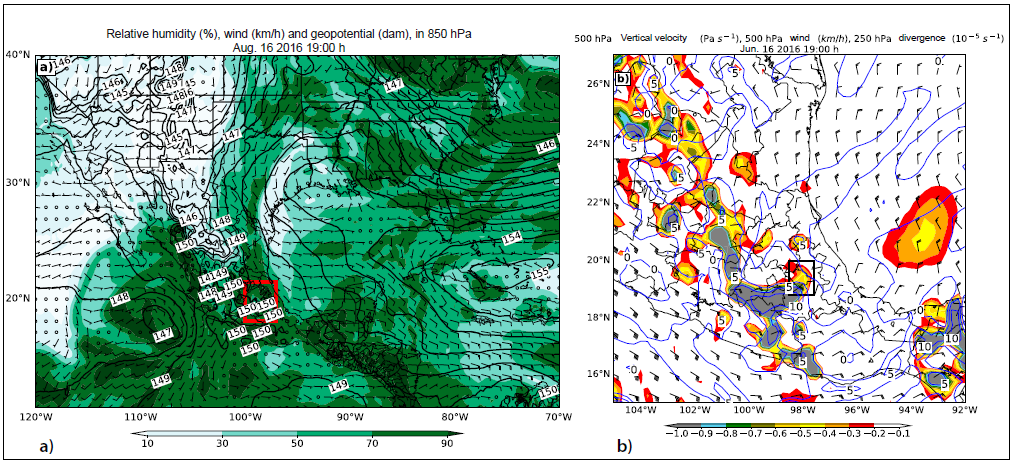
Source: Own elaboration.
Figure 13 a) Relative humidity (%) with the wind vector field (km/h) and geopotential height represented by a black solid line and marked at 1-decameter intervals, all at 850 hPa. b) Vertical velocity (Pa/s) and wind vector field (km/h), both at 500 hPa. Divergence at 250 hPa (10-5/s) marked with the blue solid line.
This configuration is similar to Cases 1 and 2 but differs in that it shows a geopotential trough associated with an area of ground instability with a 60 % probability of evolving to a tropical cyclone that complements the contribution of moisture flows from the Pacific Ocean. This coincides with León-Cruz et al. (2021), who mention that tropical cyclones and eastern waves may influence deep convection in the study region. On the other hand, the vertical velocity at 500 hPa and the divergence at 250 hPa (Figure 13b) show high values in the areas that recorded the hailstorm on the day and time of the present analysis. The coupling of these variables determines strong instability at medium and high levels of the atmosphere, causing storms and hailstorms in the places surveyed.
Characteristic Hailstorm Environments
Instability is a process by which a system (in this case, an air parcel) moves away from its equilibrium state and can be characterized by indices rather than numerical values: Instability indices (Banchero, 2017).
Table 3 summarizes the results of the instability indices for the three cases analyzed and calculated from the surveys. In this sense, the CAPE values range between 642 J/kg and 2166 J/kg. This suggests that no substantially high CAPE records are required (for example, those used in mid-latitude areas) for an air plot to become unstable in the study area. According to some authors, the above patterns are classified as weak and moderate convective potential, respectively (Banchero, 2017). The three cases yielded LI values of -3, -5, and -7, corresponding to a marginally unstable, moderately unstable, and very unstable atmosphere, respectively (Banchero, 2017). The records obtained in the present study could indicate moderate storm potential, with the probability of strong storms and possible tornadoes. Finally, the CIN with values above -75 J/kg indicates the potential for storm generation (Gensini and Ashley, 2021).
Table 3 Variables and instability indices observed in the proximity surveys for the cases analyzed.
| Indices and Variables | Case 1 | Case 2 | Case 3 |
| MUCAPE (J/kg) | 642 | 2166 | 1338 |
| LI | -3 | -7 | -5 |
| CIN (J/kg) | -2 | 0 | -28 |
| LCL (m) | 515 | 500 | 865 |
| LFC (m) | 565 | 550 | 1445 |
| EL (m) | 9650 | 11 630 | 11 805 |
| HR500hPa(%) | 68 | 66 | 57 |
| HRSfc(%) | 80 | 71 | 71 |
| Temperature500hPa (°C) | -6.0 | -7.5 | -6.3 |
| Freezing level (0 °C isotherm) | 2485 m | 1890 m | 2825 m |
The instability indices indicate the potential of an air plot to rise; however, humidity is another necessary element. In this sense, the three events recorded a humid atmosphere at the ground level, with values between 71 % and 80 %, and at intermediate levels (500 hPa), with values between 57 % and 68 % (Table 3). This humidity is necessary for the development and formation of convective storms and, therefore, an increased probability of hail formation.
The closer the freezing level to the surface, the higher the probability of hail formation. This is because the temperature drops below zero closer to the ground, favoring rapid hail formation (Banchero, 2017). In Case 1, the ground level is located at 2427 m asl, and the 0 °C isotherm is at 4912 m, that is, at 2485 meters above ground level. Following this example, for cases two and three, the 0 °C isotherm was located at 1890 and 2825 meters above ground level, respectively. It is also observed that the temperature at 500 hPa in Case 2 is -7.5 °C, indicating a colder environment (from ground to intermediate levels), contrasting with Case 1 and Case 3, where the recorded temperatures were -6.0 °C and -6.3 °C, respectively.
Finally, the differences between the level of free convection (LFC) and the equilibrium level (added to the height above sea level at which the hailstorms were documented) vary across the cases analyzed: 6708 meters for Case 1; 8516 meters for Case 2, and 8716 meters for Case 3. The difference between these levels is commonly used to estimate the vertical development of convection. In this sense, the values obtained are within the ranges evidenced by satellite images. In the three study cases, deep convective storms developed above 6000 meters, coinciding with previous literature reports for high regions in the tropics (Díaz Esteban, 2020).
CONCLUSIONS
The Mexican Plateau is a complex orographic area where diverse types of severe weather occur every year. It also concentrates a large population exposed to convective hazards, including thunderstorms, heavy rainfall, and hailstorms. Hailstorms have been scarcely studied in Mexico; therefore, further research is needed to improve the knowledge of this phenomenon and its prognosis, detection, and relationship with other associated mesoscale systems. In this context, the present work focused on a statistical analysis of hailstorms in ME-PL. Based on data from five meteorological stations, we carried out an analysis of an annual hailstorm cycle. It was found that hailstorms, thunderstorms, and rain events increase during the wet season in the region for the five meteorological stations analyzed. Likewise, the most intense activity occurs between April and October, with peaks observed between May, June, July, and August in each station.
The Puebla, Hidalgo, and Tlaxcala stations showed a similar pattern in the analysis of the annual hailstorm cycle, with the higher frequency of hailstorms related to the proximity to the Gulf of Mexico because moisture flows are predominant. Previous studies have documented that orographic forcing contributes to the higher frequency of hailstorms and that this forcing is observed in areas located at high altitudes. The study area harbors the highest altitudes in Mexico, especially in the Trans-Mexican Volcanic Belt - the area with the highest danger from hailstorms in the country. Therefore, orographic forcing probably contributes to increase hailstorm frequency.
On the other hand, we selected three significant hailstorm events and, along with ERA5 reanalysis data, composites of meteorological variables and proximity surveys were performed for each of them. In the synoptic scale, we identified a prevalent high-pressure system over the Caribbean at ground level, which maintained an anticyclonic circulation that favored the advection of moisture from the Gulf of Mexico to the study region. In addition, a ground-level trough prevailed over central Mexico, which favored convergence and, coupled with the existing instability, contributed to the conditions for the formation of deep convection in ME-PL.
The analysis of proximity surveys showed that no high CAPE values (above 2500 J/kg) are required for the development of storms and hailstorms in the region. On the other hand, weak wind shear conditions were identified at low and intermediate levels (850 to 500 hPa). This is reinforced by the high-level subsidence caused by strong wind shear at 250 hPa and with the 0 ºC isotherm close to the ground level.
Future studies should focus on the analysis of hailstorms at the country level to determine spatiotemporal patterns. In addition, additional case studies are required to determine the environmental conditions necessary for hail formation. This can be done through reanalysis data, as in the present study, or through numerical simulations, real-life radio surveys, or satellite and radar products. A greater knowledge about hailstorms in Mexico is vital for weather forecasters and decision-makers, and remains a challenge for operational meteorology in Mexico.
REFERENCES
Allen, J. T., y Tippett, M. K. (2021). The Characteristics of United States Hail Reports: 1955-2014. E-Journal of Severe Storms Meteorology, 10(3), 1-31. https://doi.org/10.55599/ejssm.v10i3.60 [ Links ]
Allen, J. T., Tippett, M. K., Kaheil, Y., Sobel, A. H., Lepore, C., Nong, S., y Muehlbauer, A. (2017). An extreme value model for U.S. hail size. Monthly Weather Review, 145(11), 4501-4519. https://doi.org/10.1175/MWR-D-17-0119.1 [ Links ]
Baldi, M., Ciardini, V., Dalu, J. D., De Filippis, T., Maracchi, G., y Dalu, G. (2014). Hail occurrence in Italy: Towards a national database and climatology. Atmospheric Research, 138, 268-277. https://doi.org/10.1016/j.atmosres.2013.11.012 [ Links ]
Banchero, S. (2017). Evaluación de la capacidad de predicción de granizo de índices atmosféricos [Tesis de Maestria, Universidad de Buenos Aires, Facultad de Ciencias Exactas y Naturales]. https://www.researchgate.net/publication/320353261_Evaluacion_de_la_capacidad_de_prediccion_de_granizo_de_indices_atmosfericos [ Links ]
Beal, A., Hallak, R., Martins, L. D., Martins, J. A., Biz, G., Rudke, A. P., y Tarley, C. R. T. (2020). Climatology of hail in the triple border Paraná, Santa Catarina (Brazil) and Argentina. Atmospheric Research, 234, 104747. https://doi.org/10.1016/j.atmosres.2019.104747 [ Links ]
Campetella, E. (2018, November 11). Cañones antigranizo: cuando nadie tiene razón. https://www.meteored.com.ar/noticias/actualidad/canones-antigranizocuando-nadie-tiene-razon.html [ Links ]
CONAGUA. (2010). Manual Teórico Práctico del Observador Meteorológico de Superficie. 278. [ Links ]
Díaz Esteban, Y. (2020). Transición de los cúmulos de los alisios a nubes de convección profunda [Tesis de Doctorado, Universiad Nacional Autónoma de México, Centro de Ciencias de la Atmósfera]. https://repositorio.unam.mx/contenidos/3584740 [ Links ]
Dube, R. K., y Rao, G. S. P. (2005). Extreme Weather Events over India in the last 100 years. J. Ind. Geophys. Union, 9(3), 173-187. https://citeseerx.ist.psu.edu/viewdoc/download?doi=10.1.1.583.2822yrep=rep1ytype=pdf [ Links ]
Gagne, D. J., McGovern, A., Haupt, S. E., Sobash, R. A., Williams, J. K., y Xue, M. (2017). Storm-based probabilistic hail forecasting with machine learning applied to convection-allowing ensembles. Weather and Forecasting, 32(5), 1819-1840. https://doi.org/10.1175/WAF-D-17-0010.1 [ Links ]
Gensini, V. A., y Ashley, W. S. (2021). Climatology of Potentially Severe Convective Environments from the North American Regional Reanalysis. E-Journal of Severe Storms Meteorology , 6(8), 1-40. https://doi.org/10.55599/ejssm.v6i8.35 [ Links ]
Hersbach, H., Bell, B., Berrisford, P., Hirahara, S., Horányi, A., Muñoz‐Sabater, J., Nicolas, J., Peubey, C., Radu, R., Schepers, D., Simmons, A., Soci, C., Abdalla, S., Abellan, X., Balsamo, G., Bechtold, P., Biavati, G., Bidlot, J., Bonavita, M., … Thépaut, J. (2020). The ERA5 global reanalysis. Quarterly Journal of the Royal Meteorological Society, 146(730), 1999-2049. https://doi.org/10.1002/qj.3803 [ Links ]
Instituto Nacional de Estadística y Geografía [INEGI] , s.f. (2021). https://www.cuentame.inegi.org.mx/monografias/informacion/pue/territorio/clima.aspx [ Links ]
Jelić, D., Megyeri, O. A., Malečić, B., Belušić Vozila, A., Strelec Mahović, N., y Telišman Prtenjak, M. (2020). Hail Climatology Along the Northeastern Adriatic. Journal of Geophysical Research: Atmospheres, 125(23). https://doi.org/10.1029/2020JD032749 [ Links ]
Jiménez, M., Baeza, C., Matías, L., y Eslava, H. (2012). Mapas de Índices de Riesgo a escala Municipal por Fenómenos Hidrometeorológicos. http://www.atlasnacionalderiesgos.gob.mx/descargas/Metodologias/Hidrometeorologico.pdf [ Links ]
Kahraman, A., Tilev-Tanriover, Ş., Kadioglu, M., Schultz, D. M., y Markowski, P. M. (2016). Severe Hail Climatology of Turkey. Monthly Weather Review , 144(1), 337-346. https://doi.org/10.1175/MWRD-15-0337.1 [ Links ]
Knapp, K. R., y Wilkins, S. L. (2018). Gridded Satellite (GridSat) GOES and CONUS data. Earth System Science Data, 10(3), 1417-1425. https://doi.org/10.5194/essd-10-1417-2018 [ Links ]
Kunz, M., Sander, J., y Kottmeier, C. (2009). Recent trends of thunderstorm and hailstorm frequency and their relation to atmospheric characteristics in southwest Germany. International Journal of Climatology, 29(15), 2283-2297. https://doi.org/10.1002/joc.1865 [ Links ]
León-Cruz, J. F., Henken, C. C., Carbajal, N., y Fischer, J. (2021). Spatio-temporal distribution of deep convection observed along the trans-mexican volcanic belt. Remote Sensing, 13(6), 1-22. https://doi.org/10.3390/rs13061215 [ Links ]
León‐Cruz, J. F., Caetano, E., Cortés‐Ramos, J., Dominguez, C., y Méndez‐Pérez, J. M. (2023). Thunderstorm and hailstorm environments in Mexico. International Journal of Climatology , n/a(n/a), 1-17. https://doi.org/10.1002/joc.8093 [ Links ]
Lkhamjav, J., Jin, H.-G., Lee, H., y Baik, J.-J. (2017). A hail climatology in Mongolia. Asia-Pacific Journal of Atmospheric Sciences, 53(4), 501-509. https://doi.org/10.1007/s13143-017-0052-1 [ Links ]
Martínez, R., Rojo, G., Ramírez, B., y Juárez, J. (2013). Estudios y Propuestas Para el Medio Rural (p. 205). [ Links ]
Méndez, J., De Jesús, J., y González, V. (2008). Análisis de tendencias de precipitación (1920-2004) en México. Investigaciones Geograficas, 65(900), 38-55. [ Links ]
Mezher, R. N., Doyle, M., y Barros, V. (2012). Climatology of hail in Argentina. Atmospheric Research, 114-115, 70-82. https://doi.org/10.1016/j.atmosres.2012.05.020 [ Links ]
Novo, S., y Raga, G. B. (2013). The properties of convective storms in central Mexico: A radar and lightning approach. Atmósfera, 26(4), 461-472. http://trmmfc.gsfc.nasa.gov/trmm_gv/ [ Links ]
Peña-Beltrán, Z. Y., y Pabón-Caicedo, J. D. (2020). Climatology of hailstorms in colombia. Cuadernos de Geografia: Revista Colombiana de Geografia, 29(1), 259-282. https://doi.org/10.15446/rcdg.v29n1.75438 [ Links ]
Prieto, R., Avendaño, A., Matías, L. G., y Eslava, H. (2021). Fasciculo de tormentas severas. http://www.cenapred.gob.mx/es/Publicaciones/archivos/189-FASCCULOTORMENTASSEVERAS.PDF [ Links ]
Punge, H. J., Bedka, K. M., Kunz, M., y Reinbold, A. (2017). Hail frequency estimation across Europe based on a combination of overshooting top detections and the ERA-INTERIM reanalysis. Atmospheric Research, 198(June), 34-43. https://doi.org/10.1016/j.atmosres.2017.07.025 [ Links ]
Punge, H. J., y Kunz, M. (2016). Hail observations and hailstorm characteristics in Europe: A review. Atmospheric Research, 176-177, 159-184. https://doi.org/10.1016/j.atmosres.2016.02.012 [ Links ]
Ruiz, L. (2018, March). Daña granizo cultivos de frutas y hortalizas en Puebla. https://www.e-consulta.com/nota/2018-03-22/sociedad/dana-granizo-cultivos-defrutas-y-hortalizas-en-puebla [ Links ]
Santos, J. A., y Belo-Pereira, M. (2018). A comprehensive analysis of hail events in Portugal: Climatology and consistency with atmospheric circulation. International Journal of Climatology , 39(1), 188-205. https://doi.org/10.1002/joc.5794 [ Links ]
Schemm, S., Nisi, L., Martinov, A., Leuenberger, D., y Martius, O. (2016). On the link between cold fronts and hail in Switzerland. Atmospheric Science Letters, 17(5), 315-325. https://doi.org/10.1002/asl.660 [ Links ]
Schuster, S. S., Blong, R. J., y Speer, M. S. (2005). A hail climatology of the greater Sydney area and New South Wales, Australia. International Journal of Climatology , 25(12), 1633-1650. https://doi.org/10.1002/joc.1199 [ Links ]
Taszarek, M., Czernecki, B., y Szuster, P. (2023). thundeR - a rawinsonde package for processing convective parameters and visualizing atmospheric profiles. https://doi.org/10.5194/ecss2023-28 [ Links ]
Zhang, C., Zhang, Q., y Wang, Y. (2008). Climatology of Hail in China: 1961-2005. Journal of Applied Meteorology and Climatology, 47(3), 795-804. https://doi.org/10.1175/2007JAMC1603.1 [ Links ]
Zhou, Z., Zhang, Q., Allen, J. T., Ni, X., y Ng, C. (2021). How Many Types of Severe Hailstorm Environments Are There Globally? Geophysical Research Letters, 48(23), 1-11. https://doi.org/10.1029/2021GL095485 [ Links ]
Received: May 24, 2023; Accepted: August 03, 2023; Published: September 29, 2023
 Este es un artículo publicado en acceso abierto bajo una licencia
Creative Commons
Este es un artículo publicado en acceso abierto bajo una licencia
Creative Commons
