


Serviços Personalizados
Journal
Artigo
 texto em
  Inglês (pdf)
 Artigo em XML
 Referências do artigo
 Enviar este artigo por email
Indicadores
-
 Citado por SciELO
 -
 Acessos
Links relacionados
-
 Similares em
SciELO
Similares em
SciELO
Compartilhar

 Permalink
Investigaciones geográficas
versão On-line ISSN 2448-7279versão impressa ISSN 0188-4611
Invest. Geog no.109 Ciudad de México Dez. 2022 Epub 29-Maio-2023
https://doi.org/10.14350/rig.60590
Articles
Variables Explaining the Modal Shift in Public Transport Use Due to COVID-19 in an Urban Environment in Queretaro

* Universidad Autónoma de Querétaro, 12 de octubre #65, Col. 4ta Demarcación, Francisco I. Madero, Hidalgo, 42660, México. Email: jlazcano04@alumnos.uaq.mx
** Universidad Autónoma de Querétaro, Rufino Tamayo #8E, Col. Pueblo Nuevo, Corregidora, Querétaro, 76900, México. Email: roberto.delallata@uaq.mx
*** Universidad Autónoma de Querétaro, Facultad de Ingeniería; Centro Universitario, Cerro de las Campanas, Col. Las Campanas, Santiago de Querétaro, Querétaro, 76010, México. Email: saul.obregon@uaq.mx
The COVID-19 pandemic has had a great impact on the way we move due to the constant risk of contracting the virus and the social distancing measures and restrictions implemented by the authorities, which has generated changes in modal travel behaviors due to the perception of COVID-19. Therefore, the objective of this research is to identify the variables that are significant to explain the relationship between sociodemographic, travel and comprehensive perception variables by COVID-19, with modal shift, in the forced urban mobility of public transport users. For the above, the sociodemographic, travel and integral perception characteristics of travelers are considered to estimate a binary logistic regression model based on data from 365 valid questionnaires applied in the Benito Juarez Industrial Park (PIBJ), located in the Urban Zone of Santiago de Queretaro, Mexico. The results show that occupation, travel time, degree of knowledge of the consequences of becoming infected, the possibility of becoming infected on and off public transport, and whether it is considered risky to use public transport, are variables that are significantly related to modal shift in public transport users during the COVID-19 pandemic.
Keywords: modal shift; public transport; urban mobility; binary logistics model; perception of COVID-19
La pandemia de COVID-19 ha tenido un gran impacto en la forma en que nos movilizamos debido al riesgo constante de contraer el virus y a las medidas de distanciamiento social y restricciones implementadas por las autoridades, lo que ha generado cambios en los comportamientos modales de viaje debido a la percepción del COVID-19. Por ello, el objetivo de la presente investigación es identificar las variables que son significativas para explicar la relación entre variables sociodemográficas, de viaje y de percepción integral por COVID-19, con el cambio modal, en la movilidad urbana obligada de usuarios del transporte público. Para lo anterior, se consideran las características sociodemográficas, de viaje y la percepción integral de los viajeros, para estimar un modelo de regresión logística binaria basado en los datos de 365 cuestionarios válidos aplicados en el Parque Industrial Benito Juárez (PIBJ), ubicado en la Zona Urbana de Santiago de Querétaro, México. Los resultados muestran que la ocupación, el tiempo de viaje, el grado de conocimiento de las consecuencias de contagiarse, la posibilidad de contagiarse en el transporte público y fuera de él, y si considera riesgoso utilizarlo, son variables que se encuentran significativamente relacionadas con el cambio modal en usuarios del transporte público durante la pandemia de COVID-19.
Palabras clave: cambio modal; transporte público; movilidad urbana; modelo logístico binario; percepción del COVID-19
INTRODUCTION
In December 2019, an airborne virus causing the respiratory disease COVID-19 was identified in Wuhan, China (Lipitch et al., 2020; Pawar et al., 2020; Zhu et al., 2020; Echaniz et al., 2021; Das et al., 2021). Subsequently, in March 2020, the World Health Organization (WHO) declared COVID-19 as a global pandemic (WHO, 2020).
COVID-19 has affected commuting patterns and urban mobility activities because of the constant risk of contracting the airborne virus and the social-distancing measures and restrictions implemented by the authorities to reduce the risk of COVID-19 transmission (Bucsky, 2020; Cheng et al., 2020; Abu-Raysh and Dincer, 2020; Haas et al., 2020; Chen et al., 2021; Anwari et al., 2021; Das et al., 2021; Echaniz et al., 2021; Abdullah et al., 2022). Given that indoor commuting is a major factor in the spread of airborne infectious diseases (Gezairy, 2003; Browne et al., 2016), people can avoid the daily use of public transport to elude close contact with other passengers (Troko et al., 2011).
When exploring the relationship between urban mobility and society, Beck and Hensher (2020) mentioned that the global impacts of pandemics had not been investigated in detail, as in the case of COVID-19. Early studies have focused on analyzing initial alterations in commuting patterns due to the risk perception related to COVID-19, public transport use, and other mobility modes around the world, using data from questionnaires applied in each study area using generalized linear models (Hotile et al., 2020; Tan and Ma, 2020; Parady et al. 2020). Other studies use decision tree approaches (Pawar et al., 2020) and comparative data analyses (Haas et al., 2020) to determine the impact of COVID-19 on modal travel preference in relation to risk perception and the sanitary measures implemented, using survey data from each study area.
Subsequent studies continue assessing the change in behavioral patterns related to travel mode choices during and after confinement due to risk perception and travel restrictions related to COVID-19, implementing generalized linear models with data from questionnaires applied in each study area (Abdullah et al., 2022; Echaniz et al., 2021; Parker et al. 2021; Aaditya and Rahul, 2021; Anwari et al., 2021). Additional studies keep using generalized linear models to analyze the shift in the choice from public transport to a private car due to COVID-19 (Das et al., 2021) and determine the major drivers affecting the choice of the travel mode before and during the COVID-19 pandemic (Scorrano et al., 2021).
It should be mentioned that modal shift refers to the use of a transport mode other than the one usually used, either a temporary or a permanent modal shift (Rodríguez and Terán, 2021). In this sense, Arnold and Rietveld (2010) mention that the temporal modal shift is due to an altered perception toward a transport mode, generating altered travel patterns. For the above, Mogaji (2020), Bucsky (2020), Das et al. (2021), and Echaniz et al. (2021) agree that the modal shift in public transport and the decrease in the number of passengers were evident since the beginning of the COVID-19 pandemic, mainly because of the social-distancing and confinement measures applied by governments. On the other hand, Rodríguez and Terán (2021) state that a permanent modal shift occurs when users of a transport mode stop using it on a regular basis; that is, they no longer choose the transport mode previously used. However, in the particular case of a COVID-related modal shift, former public transport users may resume using it as soon as life returns to normal.
COVID-19 will likely have significant short-, mid-, and long-term impacts on our lifestyle, the way we behave, and, above all, how we move around. The drop in travel demand was mainly due to the radical change in the commuting behavior of users as a result of travel restrictions, uncertainty, and the risk factor of traveling by public transport from the emergence of the COVID-19 pandemic. De Vos (2020), Abdullah et al. (2022), and Anwari et al. (2021) argue that public transport should be offered as a safe mode of traveling in times of social distancing, supporting the mobilization of users in need of using it despite the pandemic. Therefore, given the uncertainties in users' decision-making, it is necessary to understand how the integral perception of COVID-19 has affected their modal behavior.
OBJECTIVE
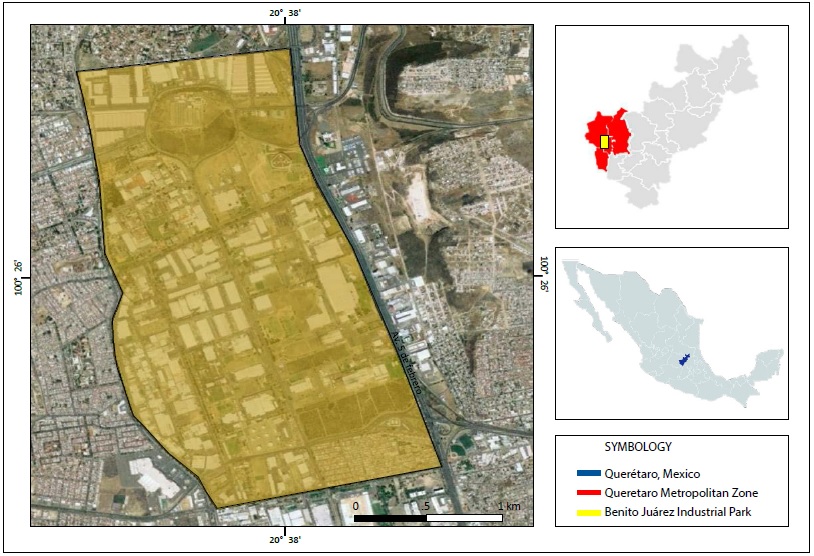
This study aims to identify the significant variables that explain the relationship of socio-demographic, commuting, and integral perception variables related to COVID-19 with the modal shift in public transport users in an urban environment. The study was conducted in the Benito Juarez Industrial Park (PIBJ), a location in the urban area of Santiago de Queretaro, Mexico, because it is served by 31 different public transport suppliers distributed across all its accesses. In addition, by being located inside the metropolis, this Park is connected to the main roads of the Queretaro Metropolitan Zone, thus being a strategic point to analyze and achieve the study objective.
This research provides information on the shift in the commuting behavior of workers and its relationship with socio-demographic, commuting, and integral perception characteristics generated by the COVID-19 pandemic in Querétaro city, a metropolis located in one of the Mexican states with a vigorous economic growth dynamics. According to the Mexican Institute for Competitiveness (IMCO, 2018), the gross domestic product (GDP) of Queretaro city is approximately 72% of the GDP of the state of Queretaro. In the period 2003-2017, Querétaro was a state with the third-highest GDP growth (4.66%) in Mexico, surpassed only by Baja California Sur and Quintana Roo (INEGI, 2021b).
MATERIALS AND METHODS
Study Area
The industrial sector is hugely important for the economic development of the state of Querétaro. In this sense, the study area is the PIBJ, located 11 km south of the geographic center of the Queretaro municipality and 4 km north of the center of Santiago de Querétaro. The PIBJ comprises an area of 450 hectares and started operations in 1963. Today, with nearly 60 years of operation, it continues supporting international and national companies that generate multiple job opportunities.
It is worth mentioning that the study area has been engulfed by urban growth in the municipalities of Querétaro, El Marqués, and Corregidora, which comprise the Querétaro Metropolitan Zone (QMZ). In addition, schools, households, and shopping malls have resulted in the Park being located in one of the areas with the highest public transport mobility in the state of Queretaro. The PIBJ is served by 31 different public transport routes (10, 12, 21, 27, 29, 31, 36, 40, 45, 50, 51, 61, 66, 67, 72, 76, 81, 84, 96, 98, 105, 110, 121, 130, 131, 132, 133, 134, 136, L07, and A1). The study area is shown in Figure 1.
Data Collection
Questionnaire Design
The questionnaire was structured into two main sections. The first is the Departure-Arrival Questionnaire (D-A) with multiple choice questions; the second is the questionnaire on the integral perception about COVID-19 with five-level Likert-type questions (not at all, low, moderate, high, very high), arranged in ascending order. The D-A questionnaire provides information related to the socio-demographic and commuting profile of users. The answers to the D-A questionnaire reveal the actual behavior of the respondent, that is, they regard revealed preferences. On the other hand, the questionnaire on the integral perception of COVID-19 provides information on the impressions generated by this disease, the perceptions of risk in different transport modes, and the understanding of sanitary measures in public transport. The answers to this questionnaire reveal the likely behavior of the respondent under hypothetical scenarios, i.e., they regard stated preferences.
The purpose of addressing socio-demographic characteristics is to identify how they ultimately affect whether users choose public transport in the face of the COVID-19 pandemic. Commuting characteristics were addressed to establish whether they are relevant when users choose public transport in the face of the COVID-19 pandemic. On the other hand, questions about the impressions generated by COVID-19 aimed to distinguish the knowledge, understanding, and perspective of users through the socio-psychological impressions produced by the pandemic. Asking about the likelihood of contracting the virus is useful to determine the perception of users about becoming infected under various hypothetical scenarios. Finally, the purpose of asking about the understanding of sanitary measures in public transport is to identify the users' perspective on the effectiveness of preventive measures, the established guidelines, and the compliance level with them.
Sampling Scenarios
The size of the population currently working in the PIBJ was determined by consulting the National Statistical Directory of Economic Units (Directorio Estadístico Nacional de Unidades Económicas; DENUE, in Spanish) (INEGI, 2021). In this directory, data on the identification, location, economic activity, and size of active businesses were reviewed, mainly in the large-business segment. In this way, based on the data mentioned above, the number of workers in the PIBJ was estimated to be about 7500, distributed in 130 companies focused on the industrial growth of the state of Queretaro.
The sample size was established using Equation 1 (Ibeas et al., 2007) with a 95% confidence level, a standard normal variable of 1.96 (corresponding to a 95% confidence level), and an accuracy level of 0.05 (maximum error of 5%):
Where n is the sample size surveyed; p is the proportion of trips to estimate (0.5 being the most conservative); Z is the standardized normal variable for the required confidence level; E is the accuracy level (expressed as a ratio); N is the total population size.
From Equation 1, the number of questionnaires necessary to be administered was 365.
Application Scenarios
Before administering the final questionnaires, a pilot questionnaire was applied to determine whether the survey would operate efficiently and whether the level of understanding of the questions was appropriate for the respondent. This approach allowed for reviewing the information obtained and making adjustments to the questionnaire, if necessary.
With the authorization of the local government in the study area, a total of 365 valid individual questionnaires were administered to users of PIBJ public transport from October to November 2021. To note, during the questionnaire application period, the situation of the pandemic in Mexico remained with a decreasing trend in confirmed cases. The third wave of coronavirus peaked in mid-August 2021; since then, there has been a sustained reduction in the number of infections in the country. In addition, the vaccination strategy positively influenced the pandemic indicators in Mexico; by the end of October 2021, 85% of the population over 18 years old had already received at least one dose of the anti-COVID-19 vaccine.
Following the established strategy and the schedule, approximately 20 to 30 questionnaires were applied per working day between 09:00 and 12:00 hours. The steps to administer the questionnaires were:
Definition of zones to be surveyed and coverage sequence. We considered only the public transport ascent and descent points and the accesses to each company.
Data collection. Data were collected when the respondent was contacted and the questionnaire was applied.
Assurance that activities were carried out following the established guidelines. Through the monitoring and analysis of completed questionnaires, to ensure progress and information quality.
It should be mentioned that the questionnaire was administered only to users of PIBJ public transport, as required by the study. Potential respondents were selected by asking if they were public transport users during the COVID-19 pandemic or previously. This avoided collecting invalid questionnaire information.
Theoretical Background
Data Analysis Method
The binary logistic regression model was used to analyze the influence of the explanatory variable on the dependent variable when the latter involves two options. This model uses the maximum likelihood estimate when the dependent variables are transformed into logit variables (Ortuzar and Willumsen, 2008; Koppelman and Bhat, 2006).
Thus, the binary logistic regression analysis is part of generalized linear models and is characterized by its response distribution (binomial) and a binding function (Dalgaard, 2008). The binary logistic model is expressed as shown in Equations 2 and 3:
Where P is the probability that Y = 1; x i is the explanatory variable i; α is a constant; and β i is the regression coefficient associated with the variable i.
For the present study, a binary logistic regression model was implemented to predict the result of a categorical variable (qualitative binary variable) dependent on the predictive or independent variables (explanatory variables). In this case, the dependent variable was the choice of public transport, where a Y = 1 means choosing public transport and Y = 0 means choosing not to use public transport.
RESULTS AND DISCUSSION
Preliminary Analysis of the Variables Affecting Modal Behavior
Socio-Demographic Characteristics
Each public transport user has different socio-demographic characteristics, leading to a heterogeneous choice behavior between them. For this reason, when users made decisions about using public transport during the COVID-19 pandemic, they were affected by multiple socio-demographic characteristics. The descriptive statistics corresponding to the socio-demographic characteristics obtained from the questionnaires are shown in Table 1.
Table 1 Descriptive statistics of socio-demographic characteristics.
| Variable | Category | Frequency | % |
| Sex | Female | 73 | 20.00 |
| Male (%) | 288 | 78.90 | |
| Other | 4 | 1.10 | |
| Age | 21 to 30 years old | 130 | 35.62 |
| 21 to 40 years old | 161 | 44.11 | |
| 41 to 50 years old | 58 | 15.89 | |
| >50 years old | 16 | 4.38 | |
| Relationship with the household head | Head | 158 | 43.29 |
| Partner | 40 | 10.96 | |
| Son/daughter | 140 | 38.36 | |
| Other | 27 | 7.40 | |
| Education level (completed) | Basic (primary/secondary) | 92 | 25.21 |
| Intermediate level (high school) | 131 | 35.89 | |
| College (Bachelor and above) | 142 | 38.90 | |
| Occupation | Low (cleaning, driver, assistant, security) | 169 | 46.30 |
| Intermediate (technical/administrative) | 128 | 35.07 | |
| Upper (operational, supervisor, and other) | 68 | 18.63 | |
| Monthly Income: | Less than $10 000 ($500 USD) | 74 | 20.27 |
| $10 000 to $15 000 ($500 to $750 USD) | 261 | 71.51 | |
| >$15 000 ($750 USD) | 30 | 8.22 |
Source: Own elaboration.
Of the 365 respondents in the sample, 73 (20.0%) were female and 288 (78.9%) were male. Since most public transport users working in the PIBJ are middle-aged persons representing the main labor force in society, most respondents were between 31 and 40 years old, representing 44.11% of the sample. Regarding the household role, our data showed that 158 respondents (43.29%) were the head of the household and 140 (38.36%) were sons/daughters of the household head. Regarding the completed education level, approximately 38.90% of users completed college education or higher, followed by 35.89% who completed high school. As for occupation, 46.30% of respondents had a low-level job (cleaning, driver, assistant, and security), and 35.07% had an intermediate-level job (technical/administrative); given the nature of their jobs, these respondents needed to use public transport during the COVID-19 pandemic. Regarding income, 71.51% of respondents earned $10 000-$15 000 Mexican pesos per month, and 20.27% earned less than $10 000 per month. These results were to be expected, as higher wages are related to the possibility of traveling in a more expensive mode than public transport.
Commuting characteristics
The main commuting characteristics are the distance from the household to the workplace, walking time from the household to the public transport, commuting time, transport cost, weekly commuting frequency, and transport mode before and during the COVID-19 pandemic. These characteristics were undoubtedly affected when users chose to use/not to use public transport. Table 2 shows the descriptive statistics obtained from the questionnaires regarding the commuting profile of users.
Table 2 Descriptive statistics of socio-demographic characteristics.
| Variable | Category | Frequency | % |
| Distance from household to workplace | Less than 5 km | 118 | 32.33 |
| 5-10 km | 174 | 47.67 | |
| 10-15 km | 43 | 11.78 | |
| >15 km | 30 | 8.22 | |
| Walking time from household to public transport | Less than 5 min | 93 | 25.48 |
| 5-10 min | 200 | 54.79 | |
| >10 min | 72 | 19.73 | |
| Commuting time | Less than 10 min | 26 | 7.12 |
| 10-20 min | 53 | 14.52 | |
| 20-30 min | 118 | 32.33 | |
| >30 min | 168 | 46.03 | |
| Travel cost (Mx pesos) | Less than $10 | 37 | 10.14 |
| $10-$20 | 214 | 58.63 | |
| $20-$30 | 96 | 26.30 | |
| >$30 | 18 | 4.93 | |
| Travel frequency per week | 1-2 times | 7 | 1.92 |
| 3-4 times | 194 | 53.15 | |
| 5-6 times | 164 | 44.93 | |
| Transport mode during the pandemic | Public transport | 300 | 82.19 |
| Automobile | 39 | 10.68 | |
| Bicycle | 6 | 1.64 | |
| Walking | 12 | 3.29 | |
| Other | 8 | 2.19 |
Source: Own elaboration.
Regarding the distance from the household to the workplace, 47.67% of respondents travel between 5 and 10 km, i.e., they live relatively close to the workplace, considering that the average linear size of the city of Querétaro is 15 km. Concerning the walking time from the household to public transport, 54.79% of respondents walk between 5 and 10 minutes - an acceptable walking time, considering that a person can walk 1 km in 15 minutes, on average. Besides, average commuting time is longer than 30 minutes for 46.03% of workers; considering the heavy traffic in the city of Queretaro, moving across the city commonly takes more than 30 minutes. The travel cost reported by 58.63% of the total respondents is between $10 and $20 Mexican pesos per trip. This cost is relatively acceptable since the average travel cost in urban areas in Mexico is between $6 and $14 Mexican pesos, which encourages users to travel by public transport. With regard to the frequency of commuting per week, 53.15% traveled 3 to 4 times a week to their workplace. This means that remote work from home increased during the pandemic due to restrictions mandated by the authorities; normally, the private sector works 5 or 6 days per week. As for the travel mode used by respondents during the COVID pandemic, 82.19% of users reported that they continued using public transport as their travel mode. These numbers indicate that 17.81% of users stopped using public transport and opted for another travel mode.
Integral Perception of COVID-19
The integral perception of COVID-19 in this study considered three main aspects included in the questionnaires administered to users: the impression of COVID-19 in public transport users, the perceptions of risk in different transport modes, and the understanding of the sanitary measures implemented in public transport.
The integral perception level about COVID-19 was graded according to five Likert levels (not at all, low, moderate, high, very high), where level 5 reflects the highest perception level regarding the impression about COVID-19, the risk of contracting the virus, and the sanitary measures implemented by the authorities in public transport. On the other hand, level 1 is the lowest perception level regarding the impressions about COVID-19, the risk of contracting the virus, and the sanitary measures implemented by public transport authorities.
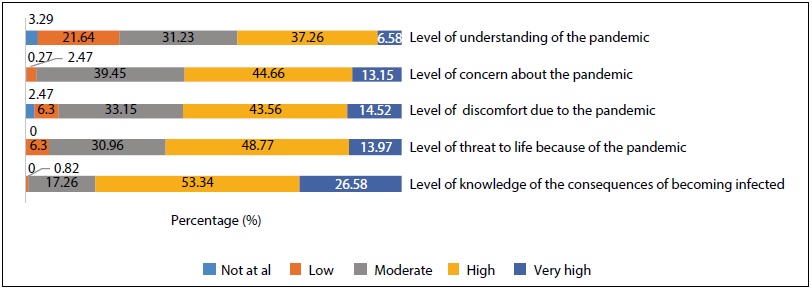
The impressions about COVID-19 were mainly given grade 4 (high), specifically the level of understanding of the pandemic (44.66% of respondents selected grade 4), level of concern about the pandemic (37.26%), level of discomfort about the pandemic (43.56%), level of threat to life from the pandemic (48.77%), and level of awareness about the consequences of becoming infected (53.34%). These figures indicate that most respondents have strong negative impressions about the COVID-19 pandemic but, at the same time, have a high level of understanding and knowledge of the situation. The descriptive statistics corresponding to the impressions about COVID-19 are shown in Figure 2.
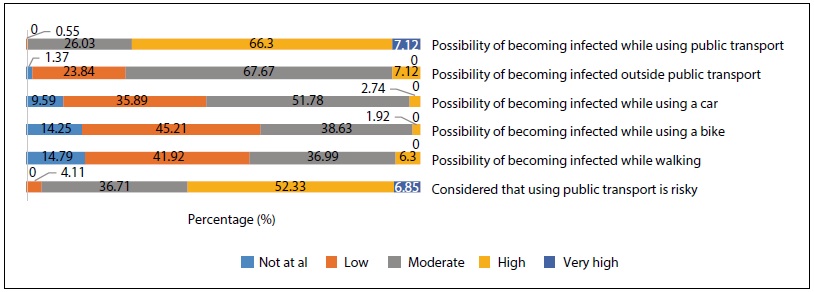
As for the perception of risk in different transport modes, the possibility of becoming infected from public transport, and whether the responder considered it risky to use public transport, most scores corresponded to grade 4 (high), representing 66.30% and 52.33% of all answers, respectively. Besides, the possibility of becoming infected from public transport and from traveling by car was scored with grade 3 (moderate), representing 67.67% and 51.78%, respectively. The possibility of becoming infected by cycling and by walking was scored mainly with grade 2 (low), representing 45.21% and 41.92%, respectively. The above indicates that public transport users perceived the risk of using public transport in the face of the COVID-19 pandemic and considered that using an alternative urban mobility mode was less risky. The descriptive statistics corresponding to the possibility of catching the virus are shown in Figure 3.
Source: Own elaboration.
Figure 3 Descriptive statistics on the perceptions of risk from different transport modes.
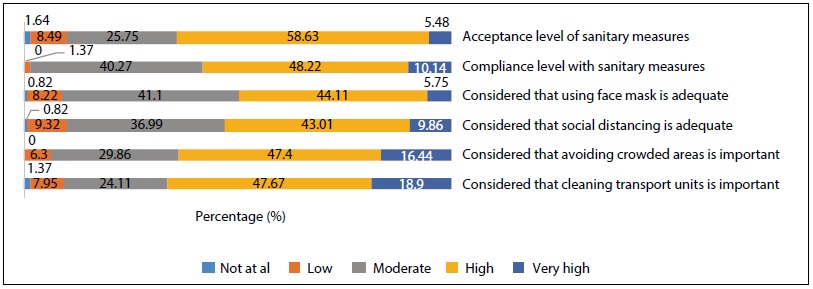
The understanding of the sanitary measures applied to public transport were graded 4 (high), specifically regarding the level of acceptance of sanitary measures (58.63% of all answers were given grade 4), level of compliance with sanitary measures (48.22%), whether the use of a face mask is considered appropriate (44.11%), whether social distancing is considered appropriate (43.01%), whether avoiding crowds is important (47.40%), and whether cleaning the transport units is important (47.67%). These numbers indicate that public transport users accepted, complied with, and understood the sanitary measures implemented by public transport authorities in the face of the COVID-19 pandemic, aiming to protect their health and life. Clearly, users perceived public transport as a high-risk space for the spread of the virus. The descriptive statistics corresponding to the possibility of catching the virus are shown in Figure 4.
Analysis of the Binary Logistic Regression Model
With the results of the questionnaire variables, a logistic regression model was constructed to predict the result of the dependent (categorical) variable based on its interaction with the explanatory (numerical-categorical) variables. Thus, the explanatory variables were the socio-demographic characteristics, travel characteristics, and the integral perception of COVID-19.
To select the best model, i.e., the one yielding the best results, a series of possible binary logistic models were constructed with the most significant variables included in the questionnaire. Based on the significance of the variables in the models analyzed, the following variables were deemed significantly related to the modal shift of users when choosing public transport during the COVID-19 pandemic: occupation, commuting time, level of knowledge of the consequences of being infected, possibility of being infected by public transport, possibility of becoming infected by means other than using public transport, and whether the user considered it risky to use public transport. The significant variables mentioned above are listed in Table 3.
Table 3 Exposure of significant variables.
| Variable | Type | Levels |
| Occupation | Categorical | Low (cleaning, driver, assistant, security) |
| Intermediate (technical/administrative) | ||
| Upper (Operational, Supervisor, and other) | ||
| Commuting time | Categorical | Less than 10 min |
| 10-20 min | ||
| 20-30 min | ||
| >30 min | ||
| Level of knowledge of the consequences of becoming infected | Numerical | Likert scale (1, 2, 3, 4, and 5) |
| Possibility of becoming infected while using public transport | Numerical | Likert scale (1, 2, 3, 4, and 5) |
| Possibility of becoming infected by means other than using public transport | Numerical | Likert scale (1, 2, 3, 4, and 5) |
| Considered it risky to use public transport | Numerical | Likert scale (1, 2, 3, 4, and 5) |
Source: Own elaboration.
The estimated logistic model with better characteristics in terms of the significance of its variables and prediction level is shown in Table 4. This model considers two groups of users: the first includes users that chose to use public transport; the second, users that chose not to use public transport. The estimated linear equation from the results in Table 4 is shown in Equation 4:
Table 4 Results of the estimation of significant variables of the logistic model.
| Significant variable | β | SD | Wald | p | LR | SRC |
| Low-level job | ||||||
| Intermediate-level job | -0.916 | 0.380 | -2.409 | 0.016* | 0.399 | -0.163 |
| High-level job | -2.207 | 0.525 | -4.203 | 0.000*** | 0.110 | -0.543 |
| Travel time less than 10 min | ||||||
| Travel time 10-20 min | 2.511 | 0.650 | 3.859 | 0.000*** | 12.324 | 0.764 |
| Travel time 20-30 min | 2.769 | 0.593 | 4.667 | 0.000*** | 15.952 | 0.769 |
| Travel time longer than 30 min | 3.259 | 0.611 | 5.330 | 0.000*** | 26.032 | 0.933 |
| Level of knowledge of the consequences of becoming infected | -0.691 | 0.282 | -2.448 | 0.014* | 0.500 | -0.091 |
| Possibility of becoming infected while using public transport | -2.185 | 0.472 | -4.629 | 0.000*** | 0.112 | -0.483 |
| Possibility of becoming infected by means other than public transport | 1.165 | 0.426 | 2.734 | 0.006** | 3.208 | 0.232 |
| Considers it risky to use public transport | -0.588 | 0.288 | -2.040 | 0.041* | 0.555 | -0.079 |
| Constant | 10.047 | 2.135 | 4.706 | 0.000*** | 23106.08 | |
| Choice to use public transport = 1 (n = 300), Choice not to use public transport = 0 (n = 65) | ||||||
Note: β = regression coefficient and constant term; SD = standard error; Wald = z-value; p = p-value; LR = likelihood ratio; significance: 0***, 0,001**, 0.01*; SRC = standardization of regression coefficients.
Source: Own elaboration.
Table 4 shows that the p-value, corresponding to Wald’s significance test of the coefficient of each explanatory variable, is less than the maximum significance level of 0.05, indicating a significant linear relationship between the explanatory variable and Logit P (Koppelman and Bhat, 2006; Hilbe, 2009).
In addition to Wald’s significance test, we also performed an Analysis of Variance (ANOVA). This analysis is used to compare the decrease in residual deviation when new variables are introduced into the model (Dalgaard, 2008). Table 5 shows (ANOVA) a significant model improvement after each variable is included. Since all variables are significant (p < 0.05), they cannot be removed from the model. The tests in the ANOVA table are not completely independent, but the approximation should be good.
Table 5 Results of the Analysis of Variance (ANOVA).
| Significant variable | DoF | Dev. | Res DoF | Resid. Dev. | Pr(>Chi) |
| NULL | 364 | 341.99 | |||
| Occupation | 2 | 14.801 | 362 | 327.18 | 0.000*** |
| Commuting time | 3 | 39.012 | 359 | 288.17 | 0.000*** |
| Level of knowledge of the consequences of becoming infected | 1 | 6.338 | 358 | 281.83 | 0.011* |
| Possibility of becoming infected while using public transport | 1 | 26.983 | 357 | 254.85 | 0.000*** |
| Possibility of becoming infected by means other than public transport | 1 | 6.939 | 356 | 247.91 | 0.008** |
| Considers it risky to use public transport | 1 | 4.324 | 355 | 243.59 | 0.037* |
| Choice to use public transport = 1 (n = 300), Choice not to use public transport = 0 (n = 65) | |||||
Note: DoF = Degrees of Freedom; Dev = Deviation; Resid DoF = Residual Degrees of Freedom; Resid. Dev. = Residual Deviation; Pr(>Chi) = p-value
Source: Own elaboration.
Other important tests for the interpretation of results are the model goodness-of-fit (pseudo R 2) since they measure the increase in the likelihood of the model explained by the independent variables of the regression model. These tests are used for assessing model fitness. In this case, a value closer to 1 means that the model is more significant or has a perfect fit; however, values close to 0.4 can be considered an excellent or satisfactory fit (Ortuzar and Willumsen, 2008). McFadden's goodness-of-fit test is analogous to R 2 in the linear regression model (Hilbe, 2009). Therefore, Table 6 shows that the model coefficient is acceptable (in terms of prediction), given that the McFadden value is 0.287. Similarly, the Hosmer-Lemeshow value is 0.287. In addition, the Cox-Snell and Nagelkerke values are 0.236 and 0.388, respectively, suggesting that the model fit is acceptable.
Table 6 Summary of tests and model accuracy.
| Indicator | Value |
| p-value | <0.05 |
| Chi-square | 98.396 |
| DoF | 9 |
| Sig. | 0.000*** |
| -2 Log Probability | 341.99 |
| R2 Hosmer-Lemeshow | 0.287 |
| R2 McFadden | 0.287 |
| R2 Cox-Snell | 0.236 |
| R2 Nagelkerke | 0.388 |
| Overall Accuracy % | 85.47 |
Source: Own elaboration.
On the other hand, the overall model accuracy model expresses the consistency between the results predicted by the model and those observed in the selection behavior. Since the model outputs are probabilities and the actual results are binary variables, if the probability is greater than 0.5, a result equal to 1 is considered, for probability values below 0.5 are assigned a result equal to 0. The model attained a data fit accuracy of 85.47%; this value means that the model is good, and values close to 100% indicate greater model suitability. We can conclude that the results obtained from the binary logistic model are satisfactory. The summary of the tests and the overall accuracy of the model are shown in Table 6.
This model can provide approximate estimates of the distribution of passenger flows in various transport modes in the city and provides data suitable for supporting traffic control plans and emergency measures developed in advance by traffic management authorities.
The results show that occupation and the underlying factor, i.e., related during the pandemic, were statistically significant since respondents with low-level jobs (low monthly income) have a odds ratio to continue using public transport 0.399 higher relative to respondents with high-level jobs (high monthly income). This is because high-income people often own a private car and would prefer to use it regularly regardless of the circumstances.
Our results also show that with longer commuting times within units, users have odds ratio up to 26.032 higher to continue using public transport, given the high cost of traveling on another transport mode. In addition, users who are more aware of the consequences of becoming infected have odds ratio 0.500 lower to continue using public transport than users who are less aware of the situation. Similarly, users who consider that the possibility of becoming infected is high while using public transport and those who consider it risky to use public transport have odds ratios to continue using it (0.112 and 0.555, respectively). Finally, those who consider that the possibility of becoming infected is the same in either public transport or any other travel mode has odds ratio 3.208 higher to continue using the former.
CONCLUSIONS/RECOMMENDATIONS
This document identified the significant variables that explain the relationship between socio-demographic variables, travel variables, and those related to an integral perception of COVID-19 with the modal shift by public transport users in an urban environment during the COVID-19 pandemic in PIBJ, Querétaro.
Based on the results of the binary logistic regression analysis, by estimating the significant variables, the following were deemed variables significantly related to the modal shift of users when choosing public transport during the COVID-19 pandemic: occupation, commuting time, level of knowledge of the consequences of being infected, possibility of being infected by public transport, possibility of becoming infected on and off public transport, and whether the user considered it risky to use public transport. In addition, our results show that the number of public transport users decreased by 17.81% during the pandemic, along with an increase in the use of private motor and non-motor vehicles. However, despite the decrease in public transport users during the pandemic because some of them switched to another travel mode, public transport remained the most extensively used transport mode among the respondents despite the risk of COVID-19 infection.
The number of persons traveling by bicycle or walking increased by 1.64% and 3.29%, respectively, during the pandemic; however, these transport modes still have a low percentage of use. This increase assumes that these transport modes are perceived as being relatively safer under a pandemic scenario since cycling and walking are healthy activities for a self-isolation lifestyle and should be promoted during the pandemic, especially for relatively short distances. It should be noted that, in general, the QMZ lacks cycling infrastructure; however, the space released from reduced traffic levels during the pandemic can be used for this travel mode.
Undoubtedly, the government agencies that control public transport are responsible for maintaining travel standards more systematically and robustly to ensure that the public transport sector is not affected by future pandemics. In Querétaro, public transport trips before the COVID-19 pandemic exceeded 600 000 trips per day, decreasing to about 380 000 trips per day during the pandemic period. For financial reasons, the transport company reduced the number of units operating per day, thereby maintaining crowded commuting conditions for users of these units, which discouraged the use of this public transport mode. This strategy affected the appeal of this transport mode, which has not recovered the number of users after the fourth COVID-19 wave in Mexico (May 2022).
Finally, this study proposes six recommendations related to traffic control and management measures to ensure the safety of public transport users in case of new virus outbreaks or during the resumption of work activities. These recommendations, incorporated into laws and regulations related to disease management protocols and urban planning, can have a greater impact on urban mobility.
Generate preferential measures to promote personalized (direct) travel.
Avoid reducing the number of public transport units so that the system allows social distancing, thus avoiding crowded transport conditions and loss of users.
Temporarily modify the times and phases of traffic lights so that the capacity of the road meets the traffic needs.
Coordinate with private companies to know their plan for resuming work in detail.
Pay attention to social-distance restrictions and user density within public transport units, accesses, and exits.
Implement staggered job schedules, modified working hours, or any other actions as a temporary policy in private companies.
This study faced some issues that limited data collection, affecting the results. One such issue was that the pandemic was on a downward trend in confirmed cases in Mexico when questionnaires were administered because vaccination against COVID-19 had been applied to 85% of the population over 18 years old in Mexico. Besides, when questionnaires were administered, women refused to participate and respond more frequently than men, likely because of the insecurity implied by the approach of a stranger and the potential risk of catching COVID-19.
REFERENCIAS
Aaditya, Bh. y Rahul, T. M. (2021). Psychological impacts of COVID-19 pandemic on the mode choice behavior: A hybrid choice modelling approach. Transport Policy, 108, 47-58. DOI: https://doi.org/10.1016/j.tranpol.2021.05.003 [ Links ]
Abdullah, M., Ali, N., Aslam, A. B., Javid, M. A. y Hussain, S. A. (2022). Factors affecting the mode choice behavior before and during COVID-19 pandemic in Pakistan. International Journal of Transportation Science and Technology, 11(1), 174-186. DOI: https://doi.org/10.1016/j.ijtst.2021.06.005 [ Links ]
Abu-Rayash, A. y Dincer, I. (2020). Analysis of mobility trends during the COVID-19 coronavirus pandemic: Exploring the impacts on global aviation and travel in selected cities. Energy Research & Social Science, 68, 101-693. DOI: https://doi.org/10.1016/j.erss.2020.101693 [ Links ]
Anwari, N., Ahmed, M. T., Islam, M. R., Hadiuzzaman, M. y Amin, S. (2021). Exploring the travel behavior changes caused by the COVID-19 crisis: A case study for a developing country. Transportation Research Interdisciplinary Perspectives, 9, 100-334. DOI: https://doi.org/10.1016/j.trip.2021.100334 [ Links ]
Beck, M. J. y Hensher, D. A. (2020). Insights into the Impact of Covid-19 on Household Travel and Activities in Australia - The Early Days Under Restrictions. Transport Policy , 96, 76-93. DOI: https://doi.org/10.1016/j.tranpol.2020.07.001 [ Links ]
Browne, A., St-Onge Ahmad, S., Beck, C. R. y Nguyen-Van-Tam, J. S. (2016). The roles of transportation and transportation hubs in the propagation of influenza and coronaviruses: a systematic review. Journal of Travel Medicine, 32(1), 1-7. DOI: https://doi.org/10.1093/jtm/tav002 [ Links ]
Bucsky, P. (2020). Modal share changes due to COVID-19: the case of Budapest. Transportation Research Interdisciplinary Perspectives , 8, 100-141. DOI: https://doi.org/10.1016/j.trip.2020.100141 [ Links ]
Chen, Z., Hao, X., Zhang, X. y Chen, F. (2021). Have traffic restrictions improved air quality? A shock from COVID-19. Journal of Cleaner Production, 279, 123-662. DOI: https://doi.org/10.1016/j.jclepro.2020.123622 [ Links ]
Cheng, V. C., Wong, S., Chuang, V. W., So, S. Y., Chen, J. H., Sridhar, S., To, K. K., Chan, J. F., Hung, I. F., Ho, P. y Yuen, K. (2020). The role of community-wide wearing of face mask for control of coronavirus disease 2019 (COVID-19) epidemic due to SARS-CoV-2. Journal of Infection, 81(1), 107-114. DOI: https://doi.org/10.1016/j.jinf.2020.04.024 [ Links ]
Dalgaard, P. (2008). Introductory Statistics with R, Statistics and Computing. Second Edition. USA: Springer. Disponible en http://www.academia.dk/BiologiskAntropologi/Epidemiologi/PDF/Introductory_Statistics_with_R__2nd_ed.pdf. https://doi.org/10.1007/978-0-387-79054-1 [ Links ]
Das, S., Boruah, A., Banerjee, A., Raoniar, R., Nama, S. y Maurya, A. K. (2021). Impact of COVID-19: A radical modal shift from public to private transport mode. Transport Policy , 109, 1-11. DOI: https://doi.org/10.1016/j.tranpol.2021.05.005 [ Links ]
De Vos, J. (2020). The effect of COVID-19 and subsequent social distancing on travel behavior. Transportation Research Interdisciplinary Perspectives , 5, 100-121. DOI: https://doi.org/10.1016/j.trip.2020.100121 [ Links ]
Echaniz, E., Rodríguez, A., Cordera, R., Benavente, J., Alonso, B. y Sañudo, R. (2021). Behavioral changes in transport and future repercussions of the COVID-19 outbreak in Spain. Transport Policy , 111, 38-52. DOI: https://doi.org/10.1016/j.tranpol.2021.07.011 [ Links ]
Gezairy, H. A. (2003). Travel epidemiology: WHO perspective. International Journal of Antimicrobial Agents, 21(2), 86-88. DOI: https://doi.org/10.1016/S0924-8579(02)00365-5 [ Links ]
Haas, M., Faber, R. y Hamersma, M. (2020). How COVID-19 and the Dutch ‘intelligent lockdown’ change activities, work and travel behavior: Evidence from longitudinal data in the Netherlands. Transportation Research Interdisciplinary Perspectives , 6, 100-150. DOI: https://doi.org/10.1016/j.trip.2020.100150 [ Links ]
Hilbe, J. M. (2009). Logistic Regression Models. 1st Edition. USA: Taylor and Francis Group. https://doi.org/10.1201/9781420075779 [ Links ]
Hotle, S., Murray-Tuite, P. y Singh, K. (2020). Influenza risk perception and travel-related health protection behavior in the US: Insights for the aftermath of the COVID-19 outbreak. Transportation Research Interdisciplinary Perspectives , 5, 100-127. DOI: https://doi.org/10.1016/j.trip.2020.100127 [ Links ]
Ibeas, Á., González, F., Dell Olio, L. y Moura, J. (2007). Manual de encuestas de movilidad (preferencias reveladas). España: Escuela Técnica Superior de Ingenieros de Caminos, Canales y Puertos de Santander. [ Links ]
Instituto Mexicano para la Competividad (2018). Índice de Competitividad Urbana 2018. Base de datos. Instituto Mexicano para la Competitividad A.C. México, D.F. Página web visitada 6 de febrero de 2022. Disponible en Disponible en http://imco.org.mx/indices/califica-a-tu-alcalde/ [ Links ]
Instituto Nacional de Estadística y Geografía (2021). Directorio Estadístico Nacional de Unidades Económicas. Página web visitada 6 de abril de 2021. Disponible en Disponible en https://en.www.inegi.org.mx/app/mapa/denue/ [ Links ]
Instituto Nacional de Estadística y Geografía (2021b). Sistema de Cuentas Nacionales de México. Producto Interno Bruto por Entidad Federativa. Año Base 2013. Serie de 2003 a 2019. Página web visitada 6 de febrero de 2022. Disponible en Disponible en https://www.inegi.org.mx/contenidos/temas/economia/pib/pibent/tabulados/ori/PIBE_2.xlsx [ Links ]
Koppelman, F. S. y Bhat, C. (2006). A Self Instructing Course in Mode Choice Modeling: Multinomial and Nested Logit Models. U.S. Department of Transportation, Federal Transit Administration. Disponible en https://www.caee.utexas.edu/prof/bhat/courses/lm_draft_060131final-060630.pdf [ Links ]
Lipsitch, M., Swerdlow, D. L. y Finelli, L. (2020). Defining the epidemiology of Covid-19 - Studies needed. The New England Journal of Medicine, 382(13 ), 1194-1196. DOI: https://www.nejm.org/doi/10.1056/NEJMp2002125 [ Links ]
Mogaji, E. (2020). Impact of COVID-19 on transportation in Lagos, Nigeria. Transportation Research Interdisciplinary Perspectives , 6, 100-154. DOI: https://doi.org/10.1016/j.trip.2020.100154 [ Links ]
Ortúzar, J. D. y Willumsen, L. G. (2008). Modelos de Transporte. España: Universidad de Cantabria. [ Links ]
Parady, G., Taniguchi, A. y Takami, K. (2020). Travel behavior changes during the COVID-19 pandemic in Japan: Analyzing the effects of risk perception and social influence on going-out self-restriction. Transportation Research Interdisciplinary Perspectives , 7, 100-181. DOI: https://doi.org/10.1016/j.trip.2020.100181 [ Links ]
Parker, M. E. G., Li, M., Bouzaghrane, M. A., Obeid, H., Hayes, D., Frick, K. T., Rodríguez, D. A., Sengupta, R., Walker, J. y Chatman, D.G. (2021). Public transit use in the United States in the era of COVID-19: Transit riders’ travel behavior in the COVID-19 impact and recovery period. Transport Policy , 111, 53-62. DOI: https://doi.org/10.1016/j.tranpol.2021.07.005 [ Links ]
Pawar, D., Yadav, A., Akolekar, N. y Velaga, N. (2020). Impact of physical distancing due to novel coronavirus (SARS-CoV-2) on daily travel for work during transition to lockdown. Transportation Research Interdisciplinary Perspectives , 7, 100-203. DOI: https://doi.org/10.1016/j.trip.2020.100203 [ Links ]
Rodríguez, I. y Terán, E. (2021). Equilibrio de largo plazo y cambio modal en el transporte público en ciudades mexicanas. Equilibrio Económico. Nueva Época. Revista de Economía, Política y Sociedad, 17(52 ), 120-146. Disponible en: http://www.economia.uadec.mx/pdfs/Rev21Sem2Art1.pdf [ Links ]
Scorrano, M. y Danielis, R. (2021). Active mobility in an Italian city: Mode choice determinants and attitudes before and during the Covid-19 emergency. Research in Transportation Economics, 86, 101-031. DOI: https://doi.org/10.1016/j.retrec.2021.101031 [ Links ]
Tan, L. y Ma, C. (2020). Choice behavior of commuters' rail transit mode during the COVID-19 pandemic based on logistic model. Journal of traffic and transportation engineering, 8(2), 186-195. DOI: https://doi.org/10.1016/j.jtte.2020.07.002 [ Links ]
Troko, J., Myles, P., Gibson, J., Hashim, A., Enstone, J., Kingdon, S., Packham, C., Amin, S., Hayward, A. y Van-Tam, J. (2011). Is public transport a risk factor for acute respiratory infection? BMC Infectious Diseases, 11(1), 11-16. DOI: https://bmcinfectdis.biomedcentral.com/articles/10.1186/1471-2334-11-16. https://doi.org/10.1186/1471-2334-11-16 [ Links ]
WHO (2020). Virtual press conference on COVID-19 - 11 March 2020, Geneva. Disponible en https://www.who.int/emergencies/diseases/novel-coronavirus-2019 [ Links ]
Zhu, N., Zhang, D., Wang, W., Li, X., Yang, B., Song, J., Huang, B., Shi, W., Lu, R., Niu, P., Zhan, F., Ma, X., Wang, D., Xu, W., Wu, G., Gao, G. F. y Tan, W. (2020). A Novel Coronavirus from Patients with Pneumonia in China, 2019. The New England Journal of Medicine , 382, 729-733. https://doi.org/10.1056/NEJMoa2001017 [ Links ]
Received: June 14, 2022; Accepted: September 24, 2022; Published: October 18, 2022
 Este es un artículo publicado en acceso abierto bajo una licencia Creative Commons
