


Serviços Personalizados
Journal
Artigo
 texto em
  Inglês (pdf)
 Artigo em XML
 Referências do artigo
 Enviar este artigo por email
Indicadores
-
 Citado por SciELO
 -
 Acessos
Links relacionados
-
 Similares em
SciELO
Similares em
SciELO
Compartilhar

 Permalink
Investigaciones geográficas
versão On-line ISSN 2448-7279versão impressa ISSN 0188-4611
Invest. Geog no.109 Ciudad de México Dez. 2022 Epub 29-Maio-2023
https://doi.org/10.14350/rig.60586
Articles
Mapping Stability and Soil Saturation Indices in the Huehuetan River Basin, Chiapas, Using the SINMAP Model
*
 http://orcid.org/0000-0002-4614-5032
**
http://orcid.org/0000-0002-3155-6699
* Investigador titular en el Colegio de Postgraduados, Campus Montecillo, Postgrado en Hidrociencias. Carretera Federal México-Texcoco Km. 36.5, Montecillo, 56230, Texcoco, Estado de México, México. Email: adolfholp@colpos.mx
** Estudiante de Doctorado del Colegio de Postgraduados, Campus Montecillo, Postgrado en Hidrociencias. Carretera Federal México-Texcoco Km. 36.5, Montecillo, 56230, Texcoco, Estado de México, México. Email: colin.gerardo@colpos.mx
*** Profesora en el Laboratoire d'Anthropologie des Mondes Contemporains, Université Libre de Bruxelles. Avenida Franklin Roosevelt No. 50, Bruxelles. 105, Buselas, Bélgica. Email: tania.martinez.cruz@ulb.be
§ Director General de Pisure Tecnologías Sustentables para el Medio Ambiente, SA de CV. Calle 26 A Oriente S/N, Colonia Benito Juárez, 30790 Tapachula, Chiapas, México. Email: javi.andreess@gmail.com
Landslides are among the most common natural events that cause mass destruction worldwide. For this reason, studying the causes, behavior, and mitigation of landslides is essential to reduce their adverse impacts. These occur most frequently in tropical environments because of the amount and intensity of rainfall that, combined with steep relief, damages urban, livestock, agricultural, and industrial infrastructure, leading to changes in the environment and even loss of human life.
Several studies have investigated the origin and effect of morphodynamic processes associated with landslides. However, given their complexity, there is still uncertainty about the prediction of their incidence. Although landslides result from various interactions, where relief morphology and the evolution of slopes play a primary role, a single factor, such as precipitation or an earthquake, is considered the external triggering factor.
The Huehuetan River basin, located on the Chiapas coast, is highly susceptible to landslides caused by heavy rains. Therefore, this study aimed to identify areas prone to landslides due to soil saturation associated with precipitation. To this end, we calculated the Stability Index (SI) and the Soil Saturation Index (SSI) through the SINMAP (Stability INdex MAPping) model to be used as support elements in urban planning and for the prevention or amelioration of landslides through structural and non-structural measures.
The Huehuetan River basin is located in southeast Chiapas, covering an area of 319.27 km2, and is part of the Sierra Madre of Chiapas. It is characterized by a hilly relief, mainly in the upper portion, with elevations ranging from 19 to 2690 meters above sea level, and 83.15% of the total surface area has slopes greater than 10%. The predominant soil is Litosol (36.63%), followed by Andosol (28.71%), while its geology is dominated by igneous (more than 85%) and sedimentary rocks. The basin was delimited using the Soil and Water Assessment Tool (SWAT) model based on the Digital Elevation Model (MDE) with a 10 m spatial resolution and the drainage network from the Instituto Nacional de Estadística y Geografía (National Institute of Statistics and Geography).
We built a landslide inventory for the period 2005 to 2021. First, we performed field trips across the Huehuetan River basin, supported by GPS equipment for the spatial location of landslide polygons. Landsat 7 and Sentinel 2A satellite images were used as support tools for locating and detecting landslides larger than 100 m2; smaller landslides were recorded based on field trips and located on Google Earth®.
The SINMAP model was executed from the MDE, the mechanical and hydrogeological properties of the soils, and the landslide inventory. The terrain stability was classified by estimating the spatial distribution of SI and SSI across the Huehuetan River basin. We determined that 24.36% (77.76 km2) of the basin is an unstable area and 75.64% (241.51 km2) is stable. The highest slope instability values were observed in the highlands due to the relief conditions, soil type, and vegetation cover. The performance of the SINMAP model was evaluated by comparing the spatial distribution of the SI with the landslide inventory obtained for the basin using the ROC curve method; it yielded an 85.60% accuracy that grades it as excellent.
The SINMAP model allowed for determining the SI and SSI easily and accurately. Both indices can be used for urban planning and to reduce serious damage from landslides. The results of this study suggest that using the SINMAP model as a tool for mapping landslide susceptible areas is a feasible option. It will allow decision-makers to plan for urban growth by identifying and zoning vulnerable areas and applying structural and non-structural control measures.
Keywords: susceptibility; landslides; stability models; slope stability; SINMAP model
Los deslizamientos están entre los eventos naturales más comunes que causan destrucción masiva a nivel mundial. Por ello, el estudio de sus causas, comportamiento y formas de mitigación es importante para reducir su impacto negativo. Estos se presentan con mayor frecuencia en ambientes tropicales debido a la cantidad e intensidad de la lluvia que, en combinación con el relieve escarpado, ocasionan daños a la infraestructura urbana, pecuaria, agrícola e industrial, así como, cambios en el medio ambiente e incluso la pérdida de vidas humanas.
Se han desarrollado diversos estudios para explicar el origen y efecto de los procesos morfodinámicos asociados a los deslizamientos, pero por su complejidad, aún existe incertidumbre sobre la predicción de su incidencia. Aunque los deslizamientos son resultado de diversas interacciones, donde la morfología del relieve y la evolución de las laderas desempeñan un papel primordial, sucede que un solo factor como la precipitación, sismos, etc., es considerado el estímulo externo que los detona.
La cuenca del río Huehuetán, localizada en la Costa de Chiapas, es altamente susceptible a deslizamientos causados por la frecuencia de lluvias intensas. Por ello, el objetivo de este trabajo fue identificar áreas suceptibles a deslizamientos debido a la saturación del suelo, generada por la precipitación, mediante la obtención del índice de estabilidad (SI) y del índice de saturación del suelo (SSI) a traves del modelo SINMAP (Stability INdex MAPping), para emplearse como un elemento de apoyo en la planificación de asentamientos urbanos, así como, para la prevención o corrección de los deslizamientos a traves de medidas estructurales y no estructurales.
La cuenca del río Huehuetán se localiza en el sureste del estado de Chiapas y comprende una superficie de 319.27 km2. Esta cuenca forma parte de la Sierra Madre de Chiapas; presenta un relieve accidentado principalmente en la parte alta, sus elevaciones van de 19 a 2 690 msnm y el 83.15% de la superficie total presenta pendientes mayores al 10%. El suelo predominante es Litosol (36.63%), seguido de Andosol (28.71%); mientras que geológicamente está dominado por rocas ígneas (más del 85%) y sedimentarias. La delimitación de la cuenca fue realizada con el modelo SWAT (Soil and Water Assessment Tool) con base en el Modelo Digital de Elevaciones (MDE) de 10 m de resolución espacial y la red de drenaje obtenida del Instituto Nacional de Estadística y Geografía.
El inventario de deslizamientos se llevó a cabo para el periodo del año 2005 al 2021, inicialmente mediante recorridos de campo en dicha cuenca, apoyados con equipo GPS para la ubicación espacial de los polígonos de los deslizamientos; se utilizaron las imágenes de los satélites Landsat 7 y Sentinel 2A, como herramientas de apoyo para la ubicación y detección de deslizamientos mayores a 100 m2, los de menor área fueron registrados con base en los recorridos de campo y ubicados en Google Earth®.
El modelo SINMAP se ejecutó a partir del MDE, las propiedades mecánicas e hidrogeológicas de los suelos y el inventario de deslizamientos. Con ello, se obtuvo la clasificación de la estabilidad del terreno con base en la estimación de la distribución espacial del SI y del SSI en la cuenca del río Huehuetán. Determinando el 24.36% (77.76 km2) de la cuenca como área inestable y 75.64% (241.51 km2) como área estable, concentrándose los mayores valores de inestabilidad de laderas en la parte alta; debido a sus condiciones de relieve, tipo de suelo y estado de la cobertura vegetal. El desempeño del modelo SINMAP se evaluó comparando la distribución espacial del SI con el inventario de deslizamientos obtenido para la cuenca mediante el método de la curva ROC; mostrando una precisión de 85.60% que lo clasifica como excelente.
El modelo SINMAP permitió determinar el SI y el SSI de manera fácil y acertada, mismos que pueden emplearse para planeaciones urbanas y reducir los daños graves a raíz de los deslizamientos. Lo resultados obtenidos sugieren que el uso del modelo SINMAP como herramienta para el mapeo de áreas susceptibles a deslizamientos es una opción factible y que permitirá a los tomadores de decisiones realizar una planificación del crecimiento urbano mediante la identificación y zonificación de áreas vulnerables y aplicar medidas tanto estructurales y no estructurales para su control.
Palabras clave: susceptibilidad; deslizamientos; modelos de estabilidad; estabilidad de laderas; modelo SINMAP
INTRODUCTION
Natural events, such as earthquakes, volcanic eruptions, and heavy rains, combined with anthropogenic factors such as deforestation and land-use changes, contribute to failures such as landslides (Abramson et al., 2001). Landslides are highly related to hillslope, soil moisture, climatic factors, and other conditions that act as triggers, such as earthquakes, volcanic eruptions, hurricanes, floods, and others. However, the primary causes are heavy rains (Ray et al., 2018). For this reason, the study of landslides, their causes, behavior, and mitigation is essential in reducing adverse impacts from these events.
Several studies worldwide aim to analyze or understand landslides, mainly by identifying the underlying causes to describe their evolution and sequence. Other studies aim to map and delimit areas susceptible to landslides as they are a major tool for decision-making in local or regional planning (Legorreta-Paulin et al., 2018; Michel et al., 2014; Neuhäuser et al. 2012) and to establish feasible areas for housing or similar land uses since the identification of highly vulnerable areas is key for preventing landslide disasters (Diaz et al., 2020).
Landslides are more frequent in tropical environments characterized by deep soils and heavy rains, threatening human lives and urban infrastructure in or adjacent to vulnerable areas (Dahal et al., 2008). In this regard, many researchers consider rain as a trigger (Iverson, 2000; Larsen, 2008; Montgomery and Dietrich, 1994; Polemio and Petrucci, 2000; Terlien and Terlien, 1998) and have focused on studying rainfall to understand its behavior.
Several studies explain the origin and effect of morphodynamic processes associated with landslides. However, given their complexity, predicting their incidence is still uncertain. However, different approaches have been proposed; one of the most important involves critical ranges established from physically based, deterministic, or probabilistic models that combine rainfall forecasts and real-time monitoring (Aristizábal et al., 2010).
Landslides result from various interactions, where relief morphology and the evolution of hillslopes play a major role (Brunsden, 2002). The simplest and most accepted definition is the one by Cruden (1991), who defines a landslide as the displacement of rocks, debris, or soil along a hillslope, associated with the progressive decline in the geotechnical characteristics of hillslope materials from natural phenomena and human activities. However, a single factor (precipitation, earthquakes, changes in water level, or increase in erosion in river channels) is considered to be the external trigger that induces— either by the rapid increase in shear effort or the reduction of resistance — the displacement of the soil along a hillslope (Huabin et al., 2005; Wang and Sassa, 2003).
The factors associated with the occurrence and distribution of landslides are divided into quasi-static or conditioning variables and dynamic or triggering variables. The former variables control the characteristics of soil and relief, contributing to the susceptibility of hillslopes and their spatial occurrence. The latter variables are the degree of soil saturation and cohesion, which control the triggering factors in susceptible hillslopes (Aristizábal et al., 2010). Climate, hydrological behavior, and anthropogenic activities control dynamic variables and characterize the temporal sequence of landslides (Crosta and Frattini, 2003). For example, considering rain as a triggering factor, the higher the intensity and duration of the storm, the higher the probability of a landslide (Michel et al., 2014).
Landslides are related to watershed degradation processes, and understanding them requires a multifactorial approach to determine their spatial influence from upper to lower parts. Changes in erosive velocities and sediment load in channels promote its deposition in the lower parts, where the main channel has a more gentle slope. Consequently, the hydraulic and sediment transport capacity of the channel is low, contributing to flooding events that cause damage to population centers and agricultural areas (Bathurst et al., 2005).
Given the importance of these phenomena in the Chiapas coast — a region that, according to the World Fund for Disaster Reduction and Recovery, is highly susceptible to landslides caused by heavy rains, rugged relief, geology, plant cover, and seismic susceptibility (WB, 2022) — more studies should be conducted in this region. Thus, the objective of this research was to estimate the Stability Index (SI) and the Soil Saturation Index (SSI) through the SINMAP (Stability INdex MAPping) model in the Huehuetán River basin to identify areas susceptible to landslides associated with soil saturation from precipitation. The aim is to support urban planning in unstable areas and contribute to prevention or mitigation through structural and non-structural measures.
MATERIALS AND METHODS
Study Area
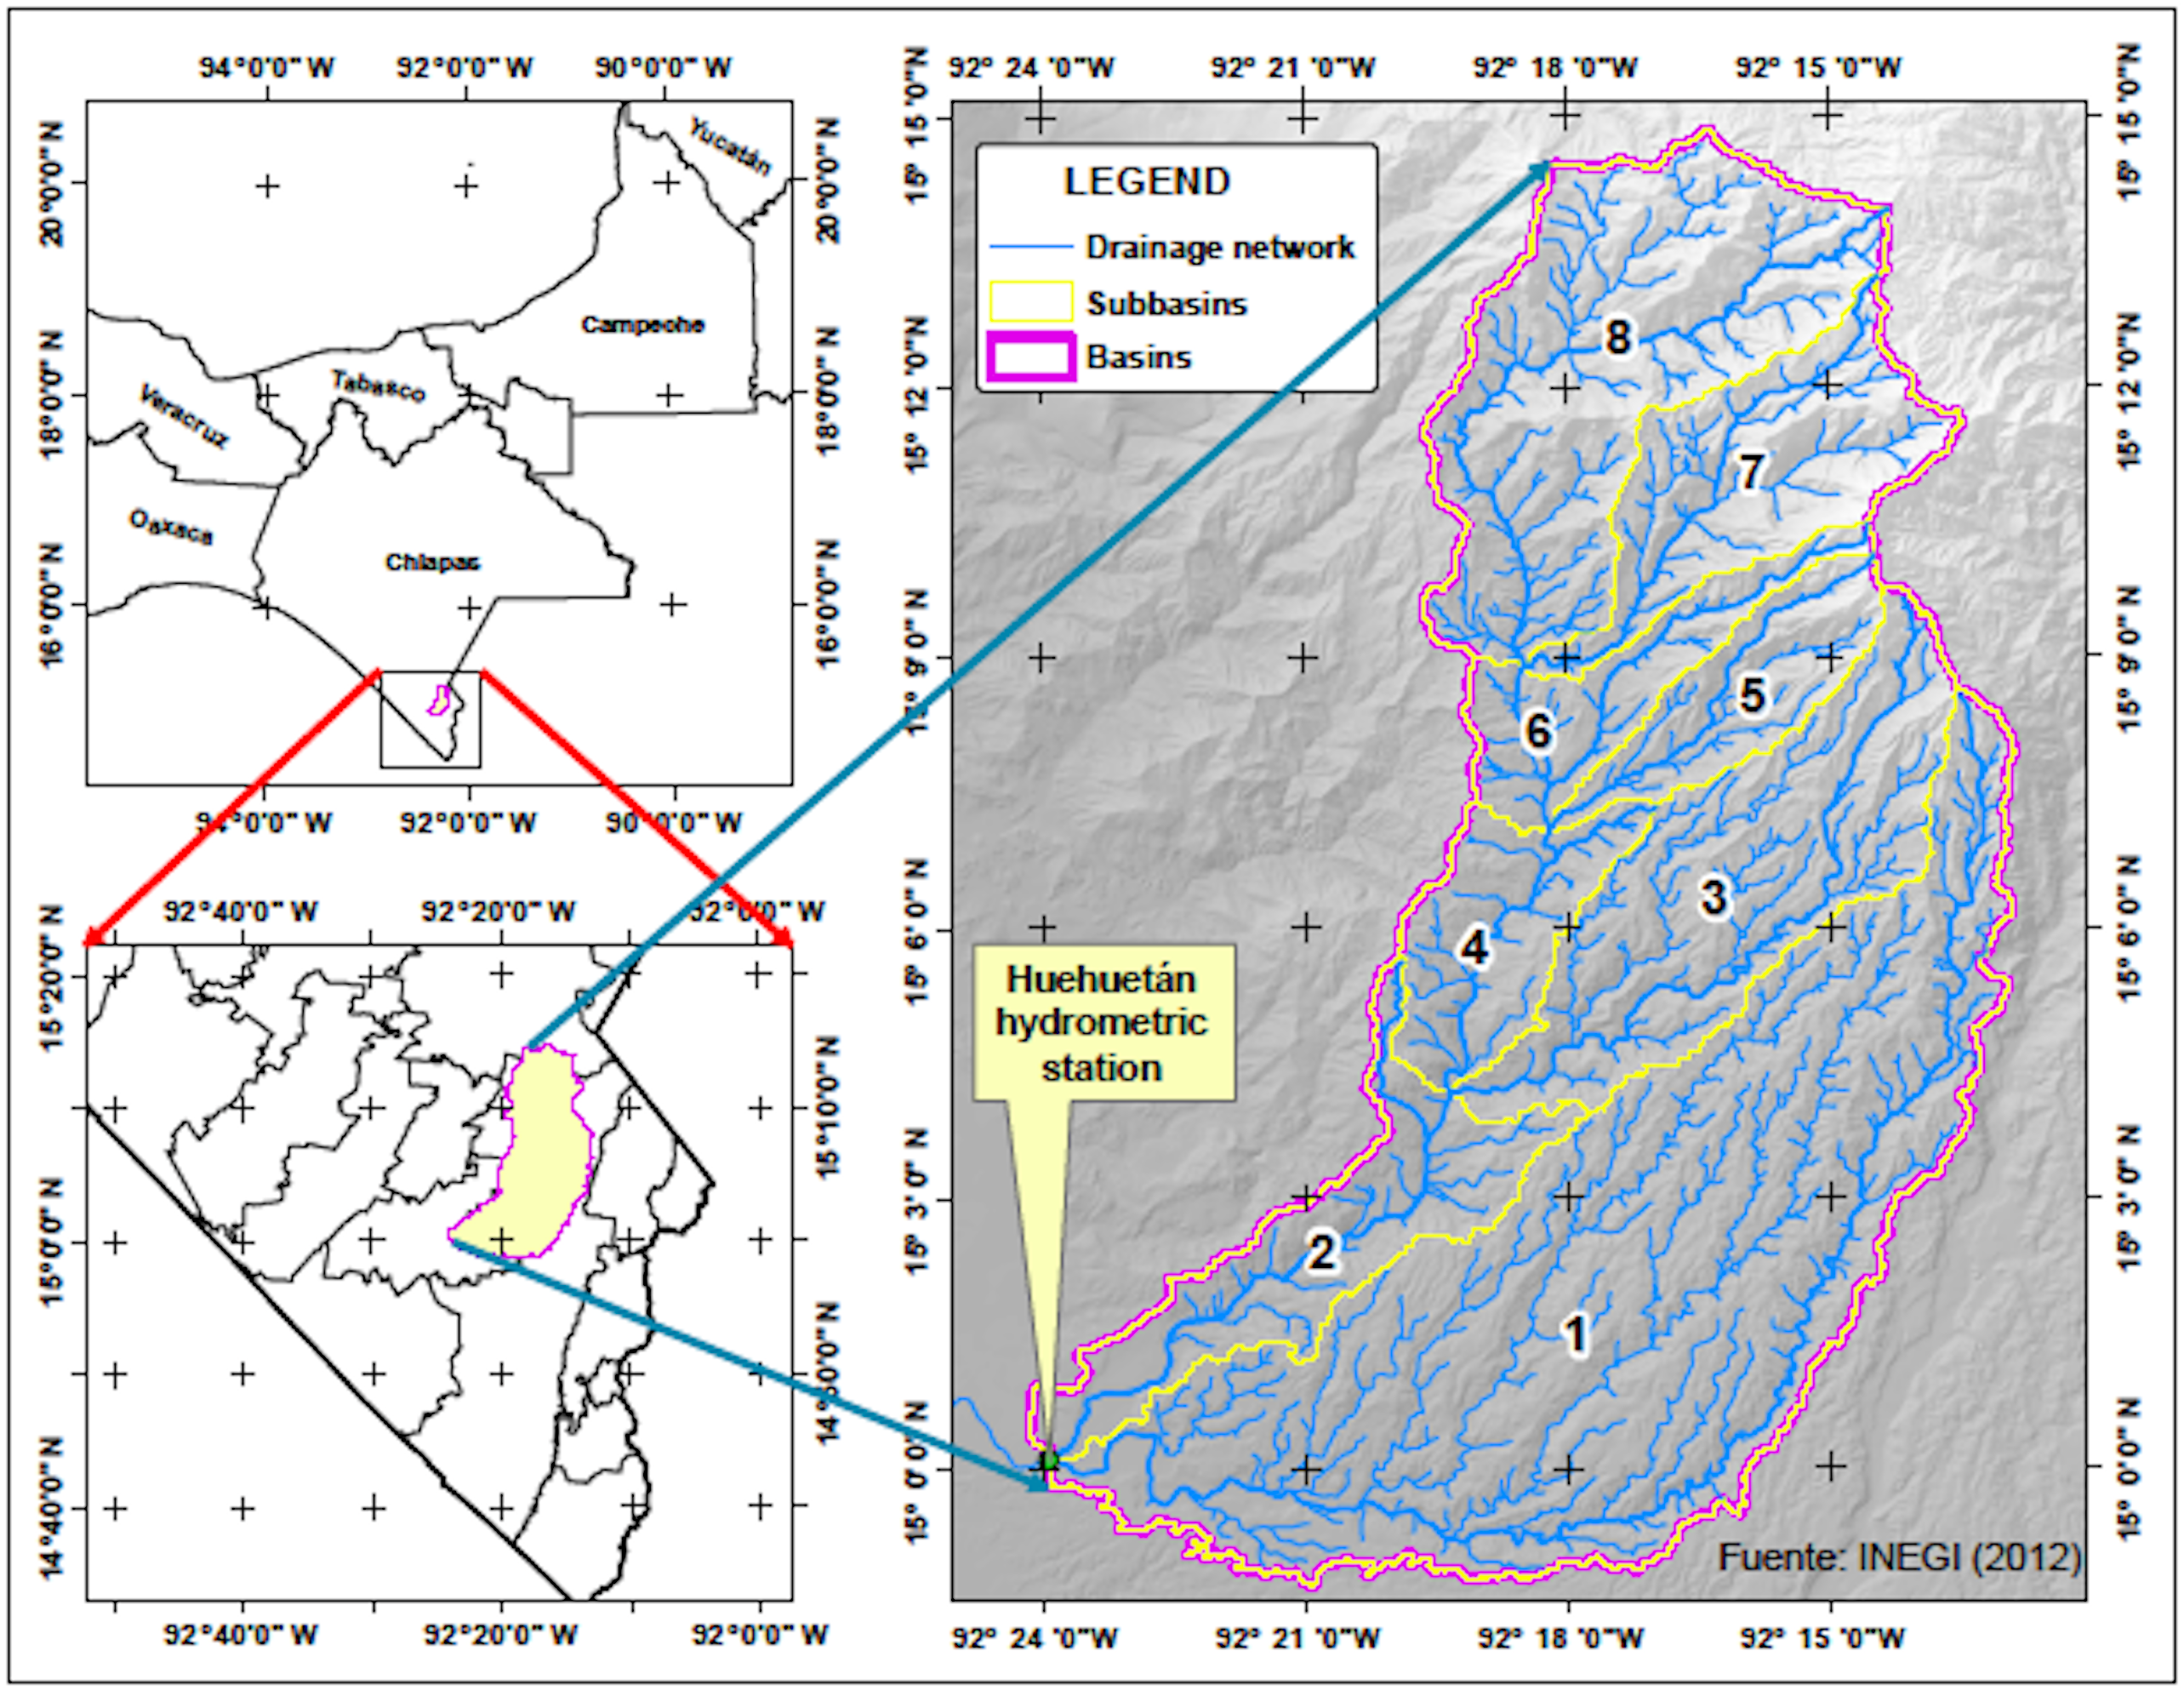
The Huehuetán River basin is located in the southern part of the state of Chiapas, a region known as the Coast of Chiapas. It covers an area of 319.27 km2 from the upper reaches to the Huehuetan hydrometric station located at coordinates 15°05’56” N and 92°24’02” W (Figure 1). The basin was delimited using the Soil and Water Assessment Tool (SWAT) model (Arnold et al., 1998) and a Digital Elevation Model (DEM) with a 10-m spatial resolution and the drainage network from the Instituto Nacional de Estadística y Geografìa (Mexico’s National Institute of Statistics and Geography) (INEGI, 2012).
This basin is part of the Sierra Madre de Chiapas. It is characterized by a rugged relief in the upper portion, with an altitudinal elevation ranging from 19 to 2 690 meters a.s.l. (Figure 2a); 83.15% of its area has hillslopes greater than 10% (Figure 2b). These variations play differential roles during heavy short-lasting rains, producing large volumes of runoff and sediments from landslides due to the saturation of soil pores and erosion in hillslopes and channels (Mora-Ortiz and Rojas-González, 2012).
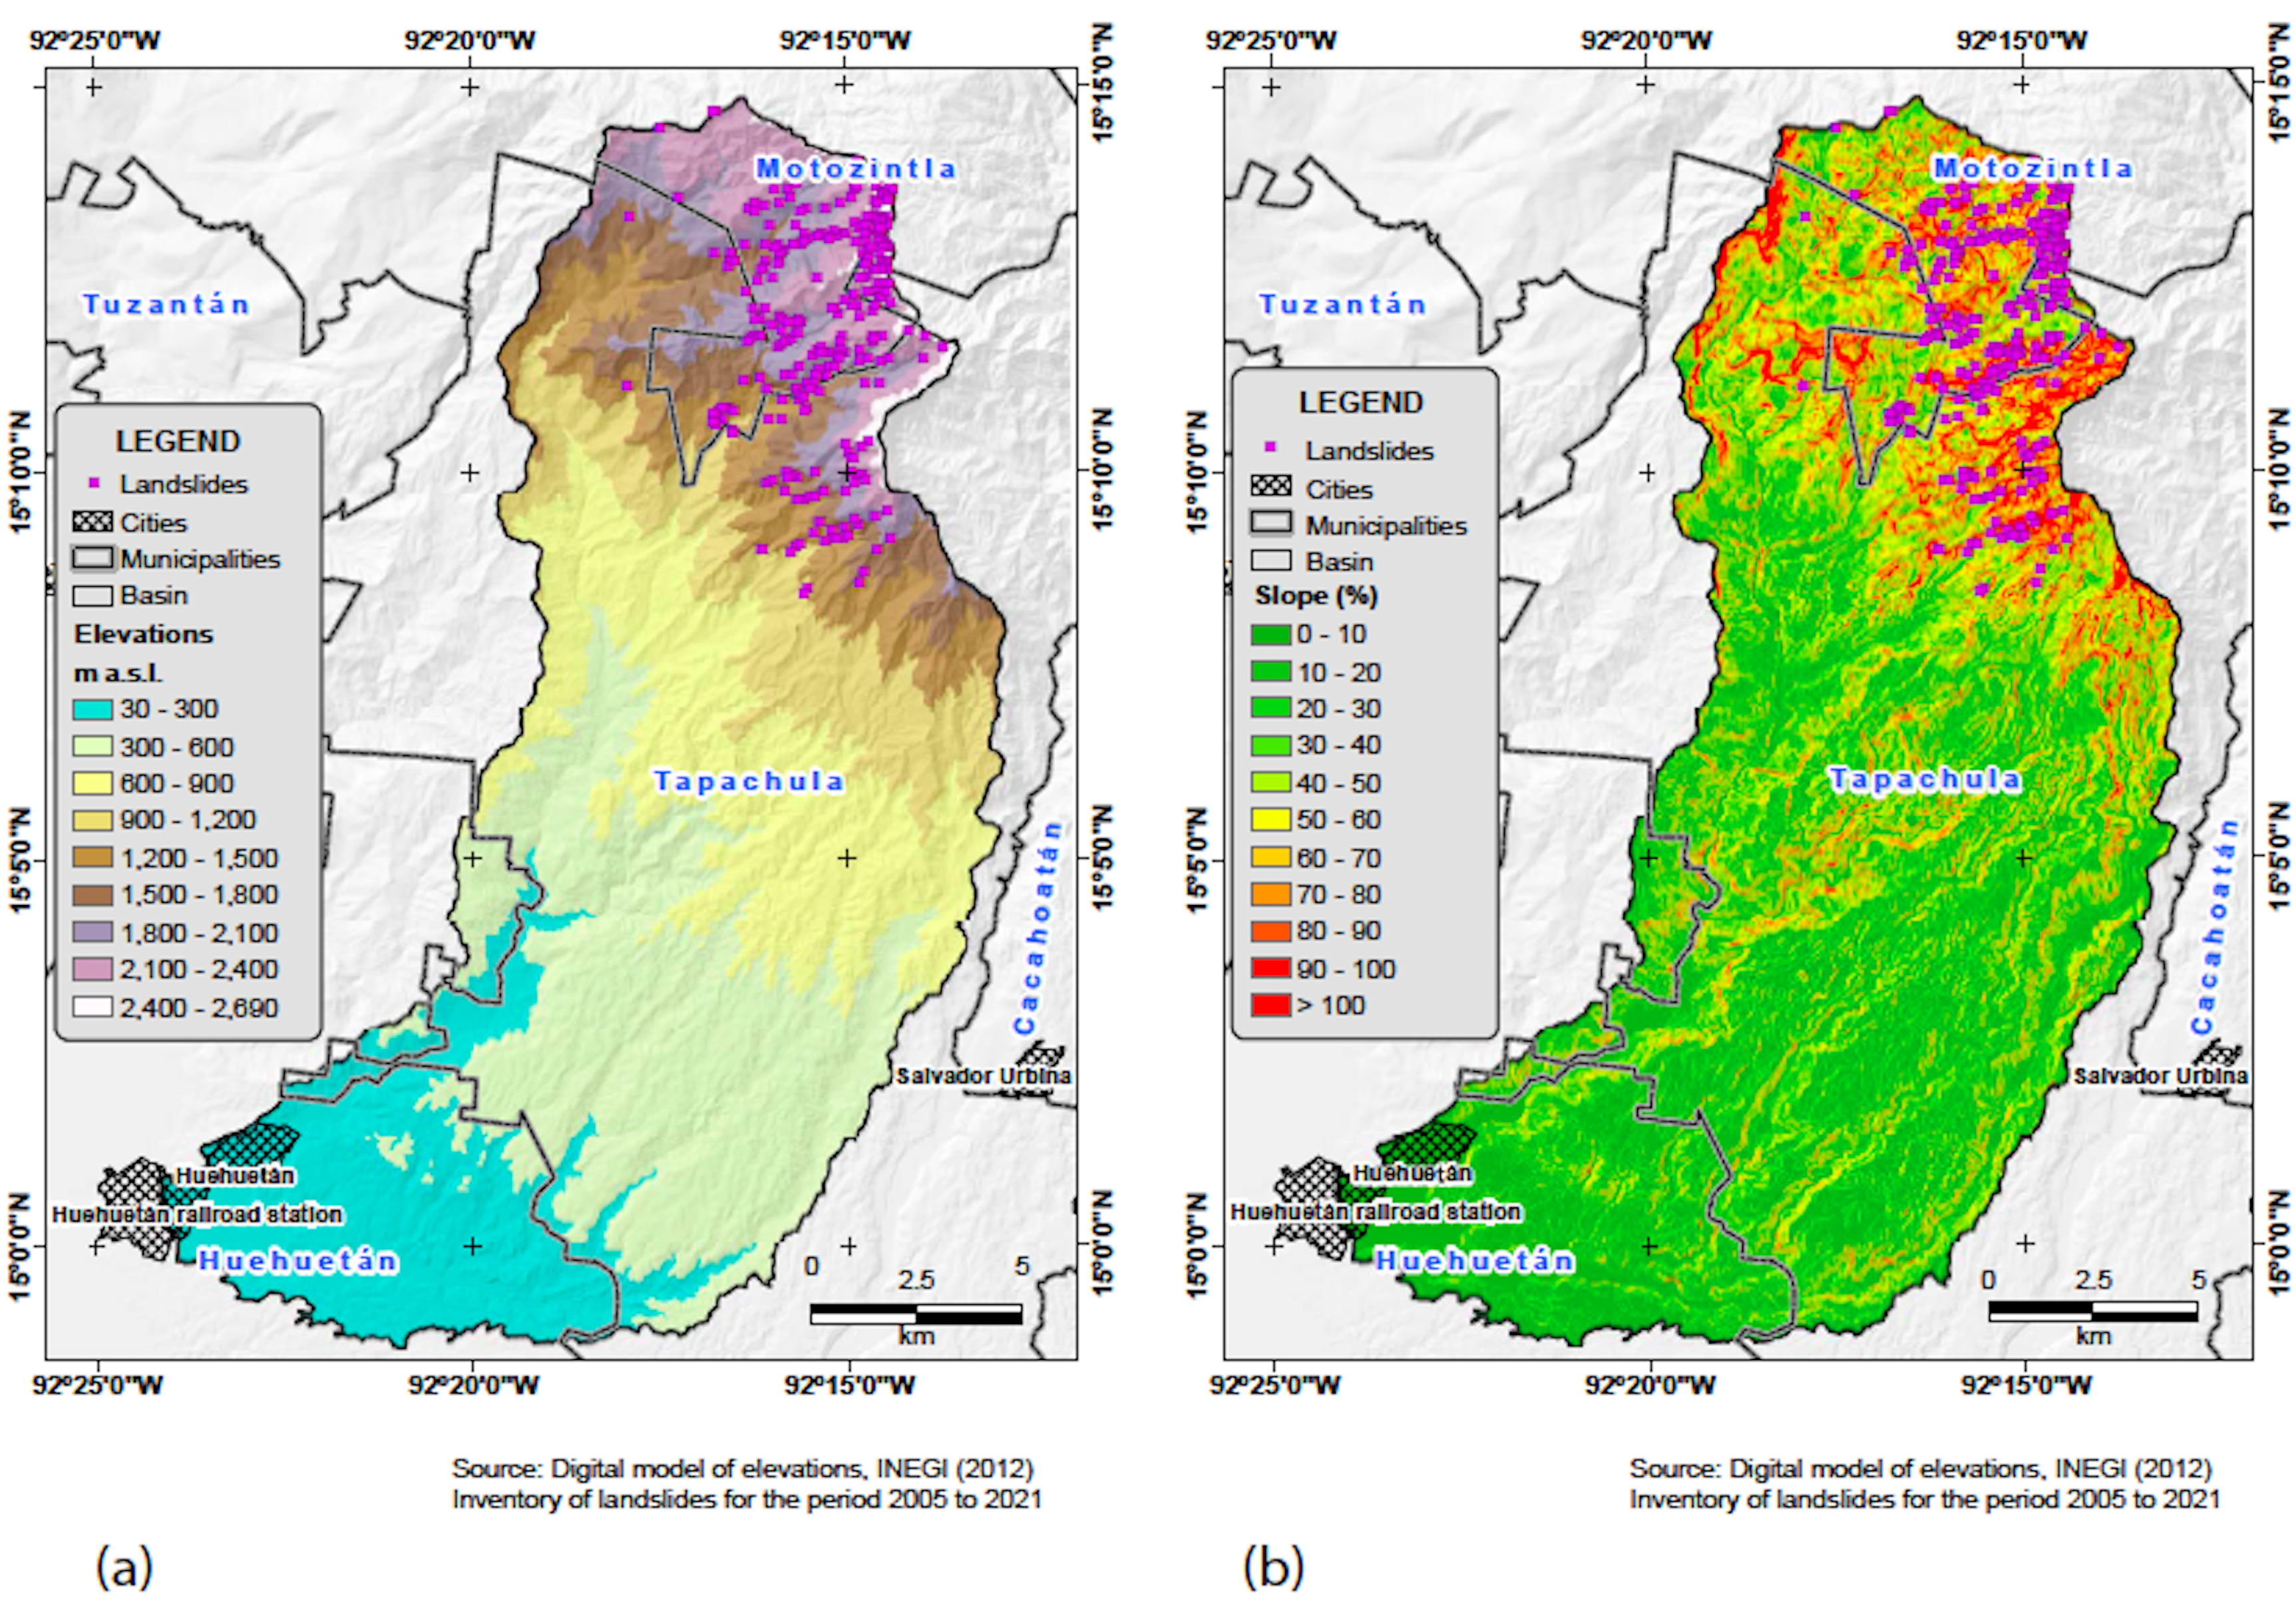
Figure 2 Spatial distribution of relief in the Huehuetán River basin. (a) Elevations; (b) Hillslope.
Mean annual precipitation in the study area was obtained from the Normal Weather Conditions recorded by the National Meteorological Service for the period 1981-2010 (SMN, 2022); this varies between 2 772 mm and 4 654 mm, mainly between May and October. Spatially, its volume is concentrated in the central part because the Sierra Madre de Chiapas is a barrier that makes clouds discharge water on the hillslope facing the Pacific Ocean (Figure 3a). Based on INEGI Series II, the main soil groups are Lithosols, with 36.63%, followed by Andosols, with 28.71%; the remaining 34.66% is distributed between Cambisol and Luvisol soils (INEGI, 2006).
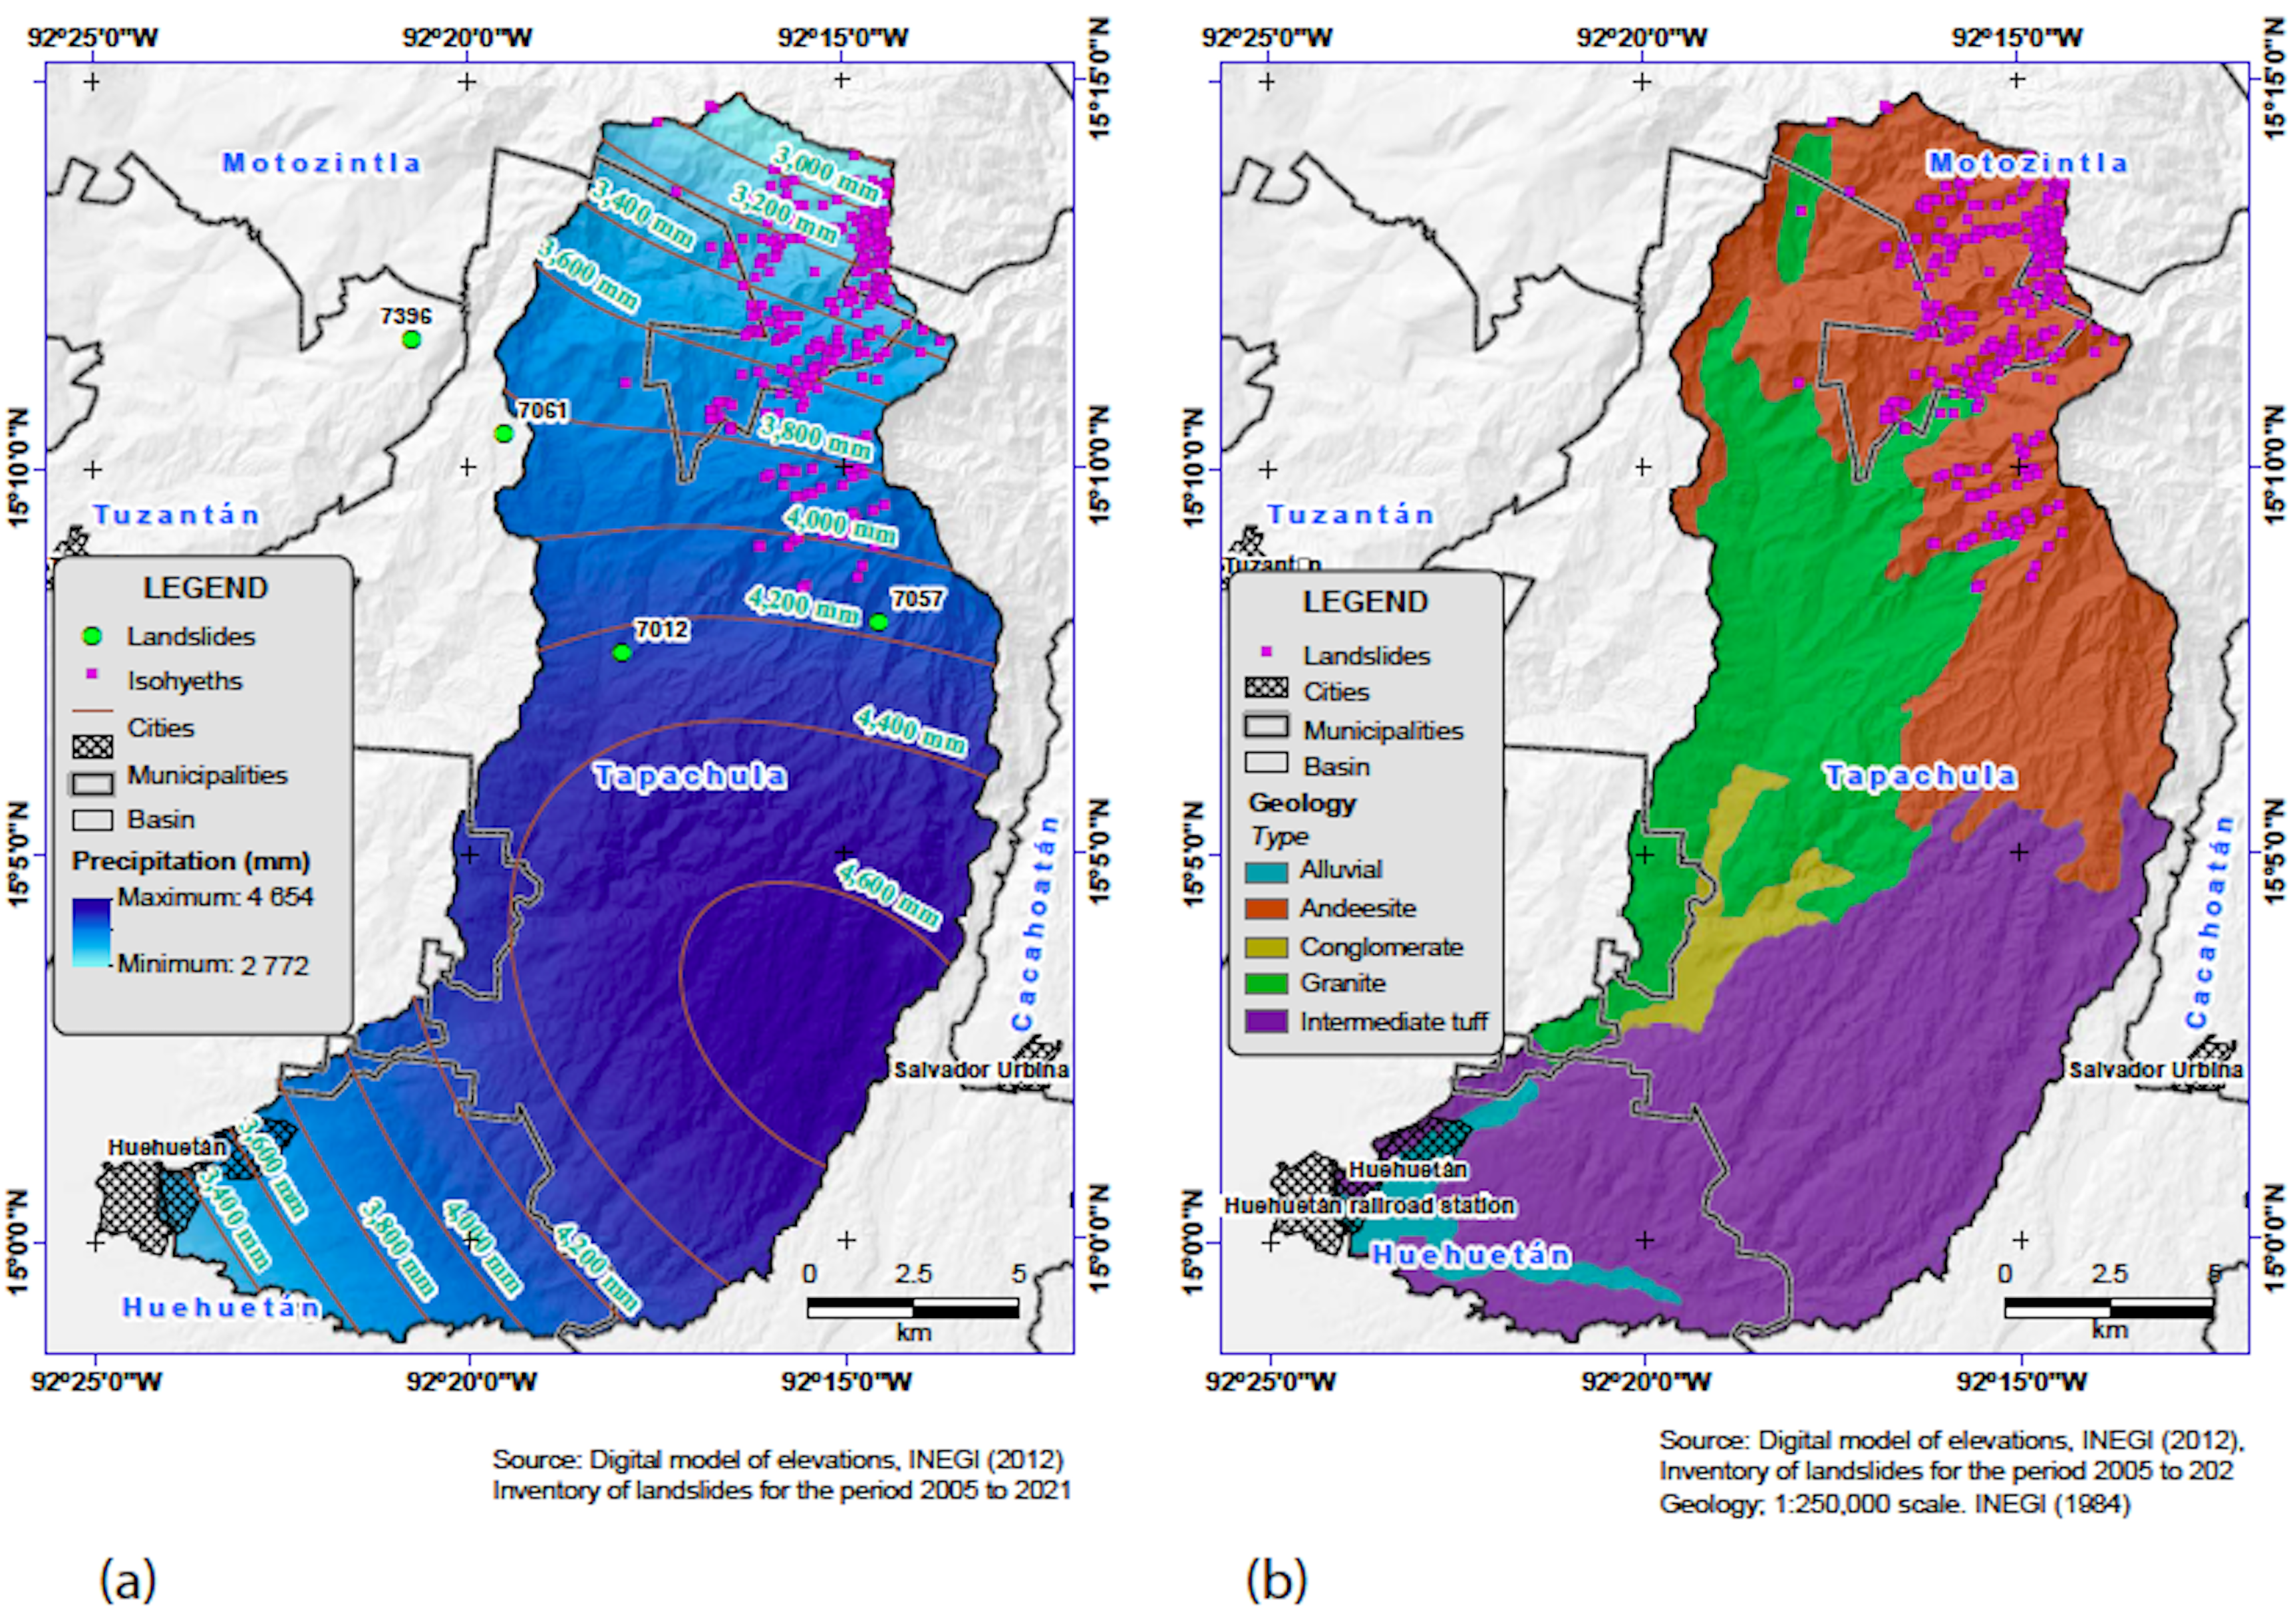
Figure 3 Spatial distribution in the Huehuetán River basin. (a) Mean annual precipitation; (b) geological units.
The geological features are associated with igneous and sedimentary rocks (Figure 3b), with the former occupying just over 85.05% of the surface area (SGM, 1982). Sedimentary rocks are located mainly in lower areas, particularly on the Huehuetán River channel and margins, associated with surface runoff from upper areas and the detachment, transport, and deposition of sediments in areas with more gentle hillslopes. The interaction between precipitation, topography, soil type, geology, and plant cover directly influences the spatial distribution of landslides (Lin and Wang, 2018).
SINMAP Model Conceptual Framework
The SINMAP (Stability Index Mapping) model combines a uniform-regime hydrological model sensitive to relief variations with an infinite slope stability model (Pack et al., 1998, 2005). This model requires a DEM, mechanical and hydrogeological properties of the study area, and an inventory of landslides (Tarolli and Tarbuton, 2006). With this information, SINMAP classifies land stability based on the spatial variation of the hillslope and the watershed (Michel et al., 2014).
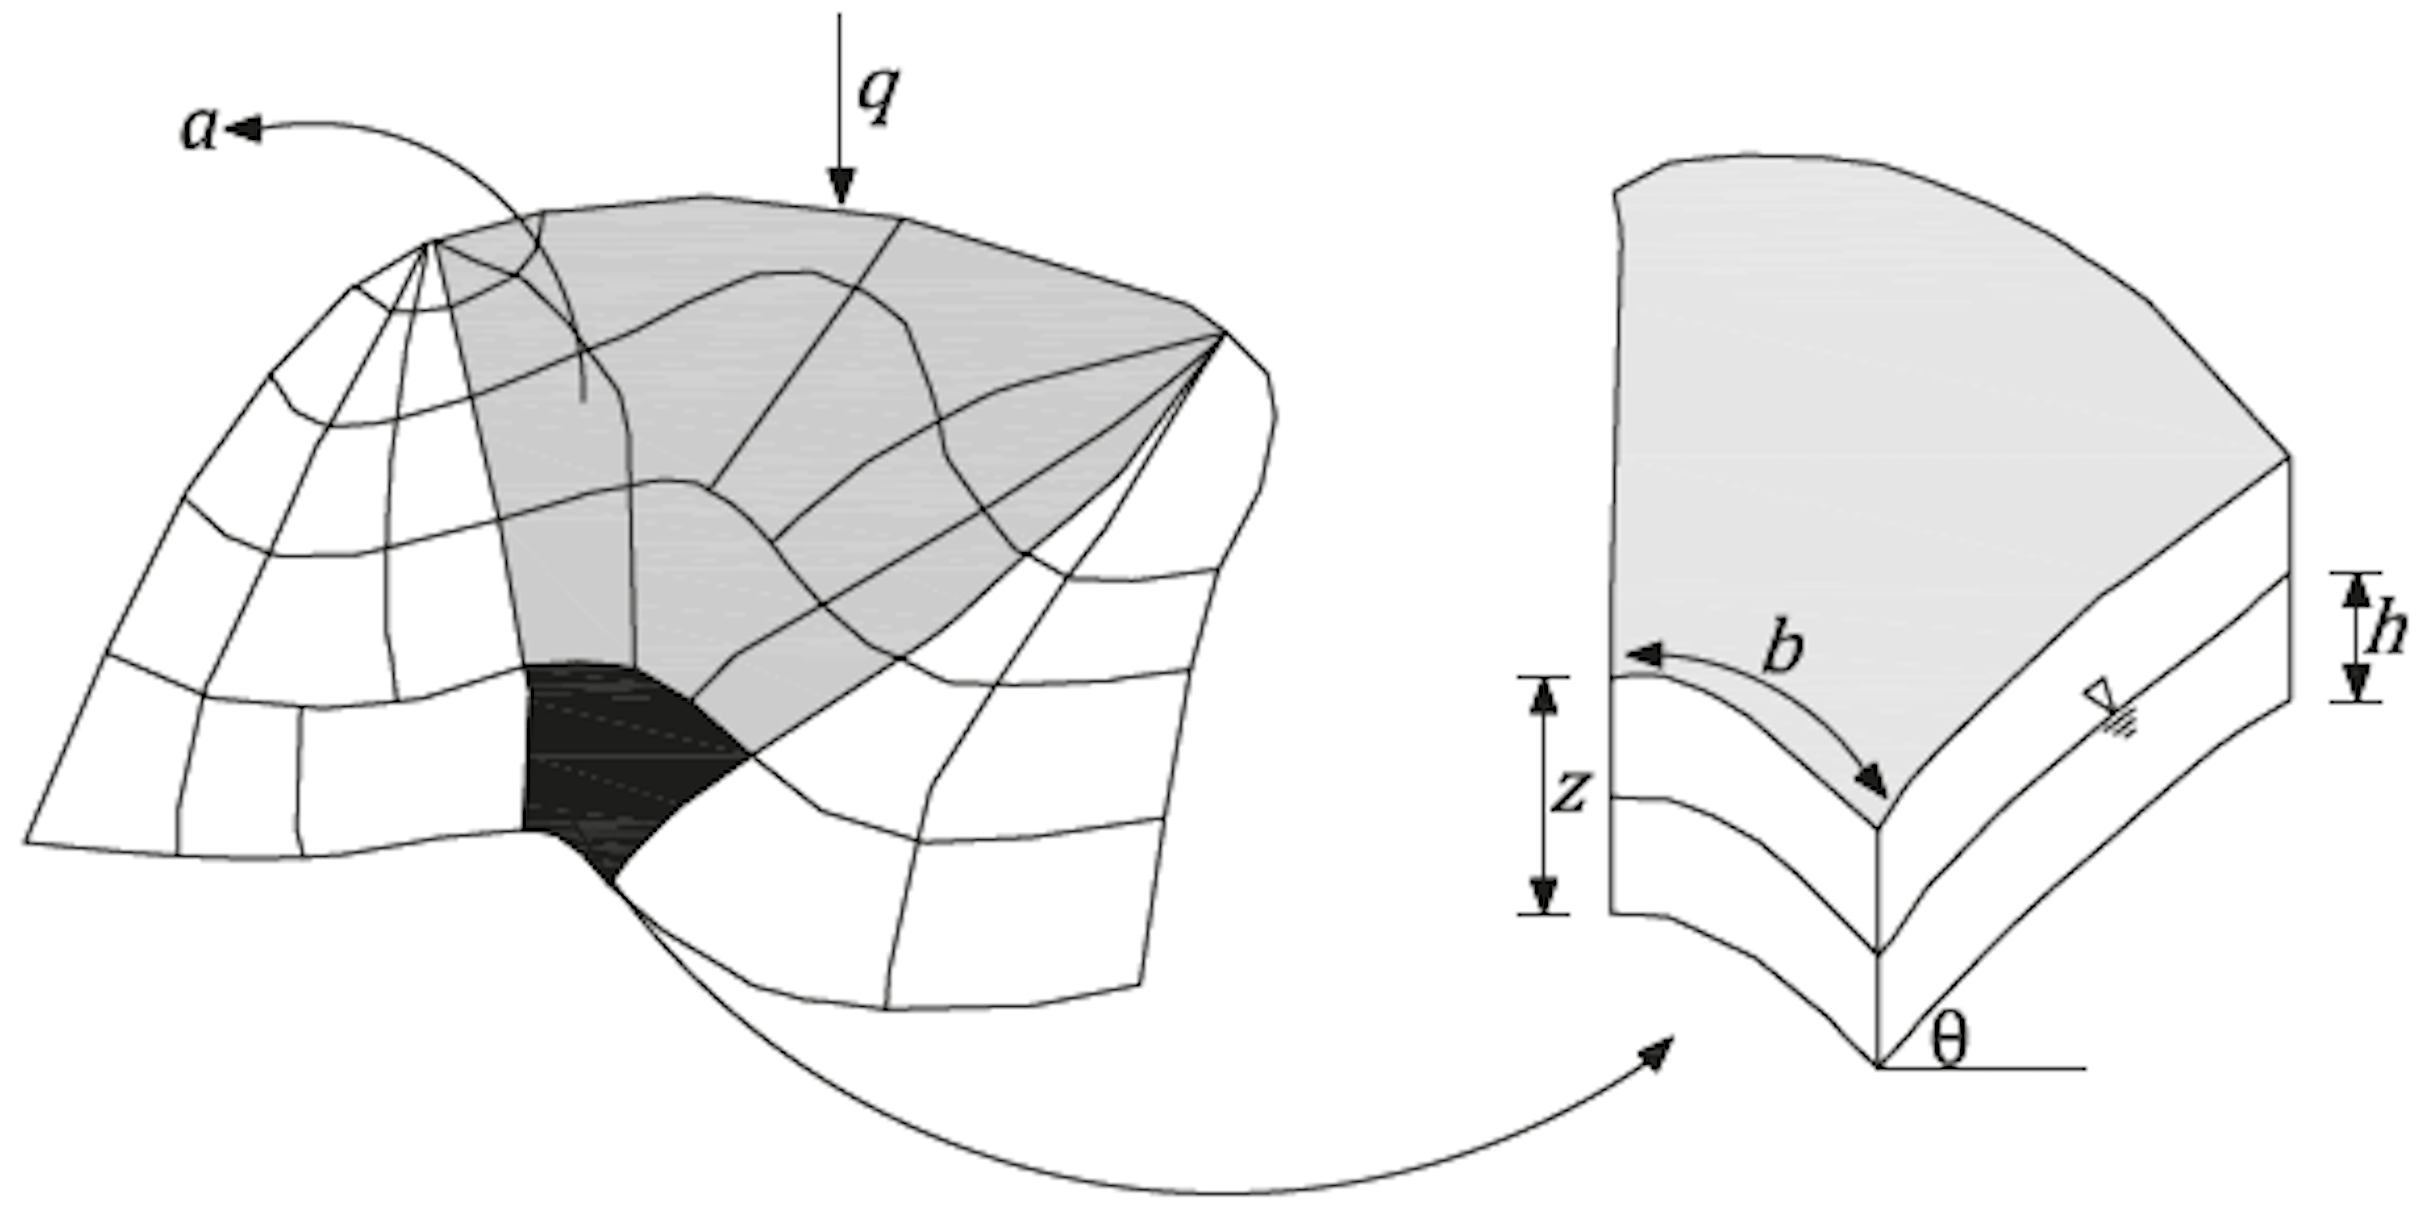
For the infinite slope stability model (Figure 4), SINMAP is based on the Mohr-Coulomb law indicating that, at the time of the failure, the shear stress (τ) generated by the descending component of soil weight is equal to the resistance caused by soil cohesion (c) and the resistance to friction due to effective normal stress across the failure plane (Michel et al., 2014), Equation 1.
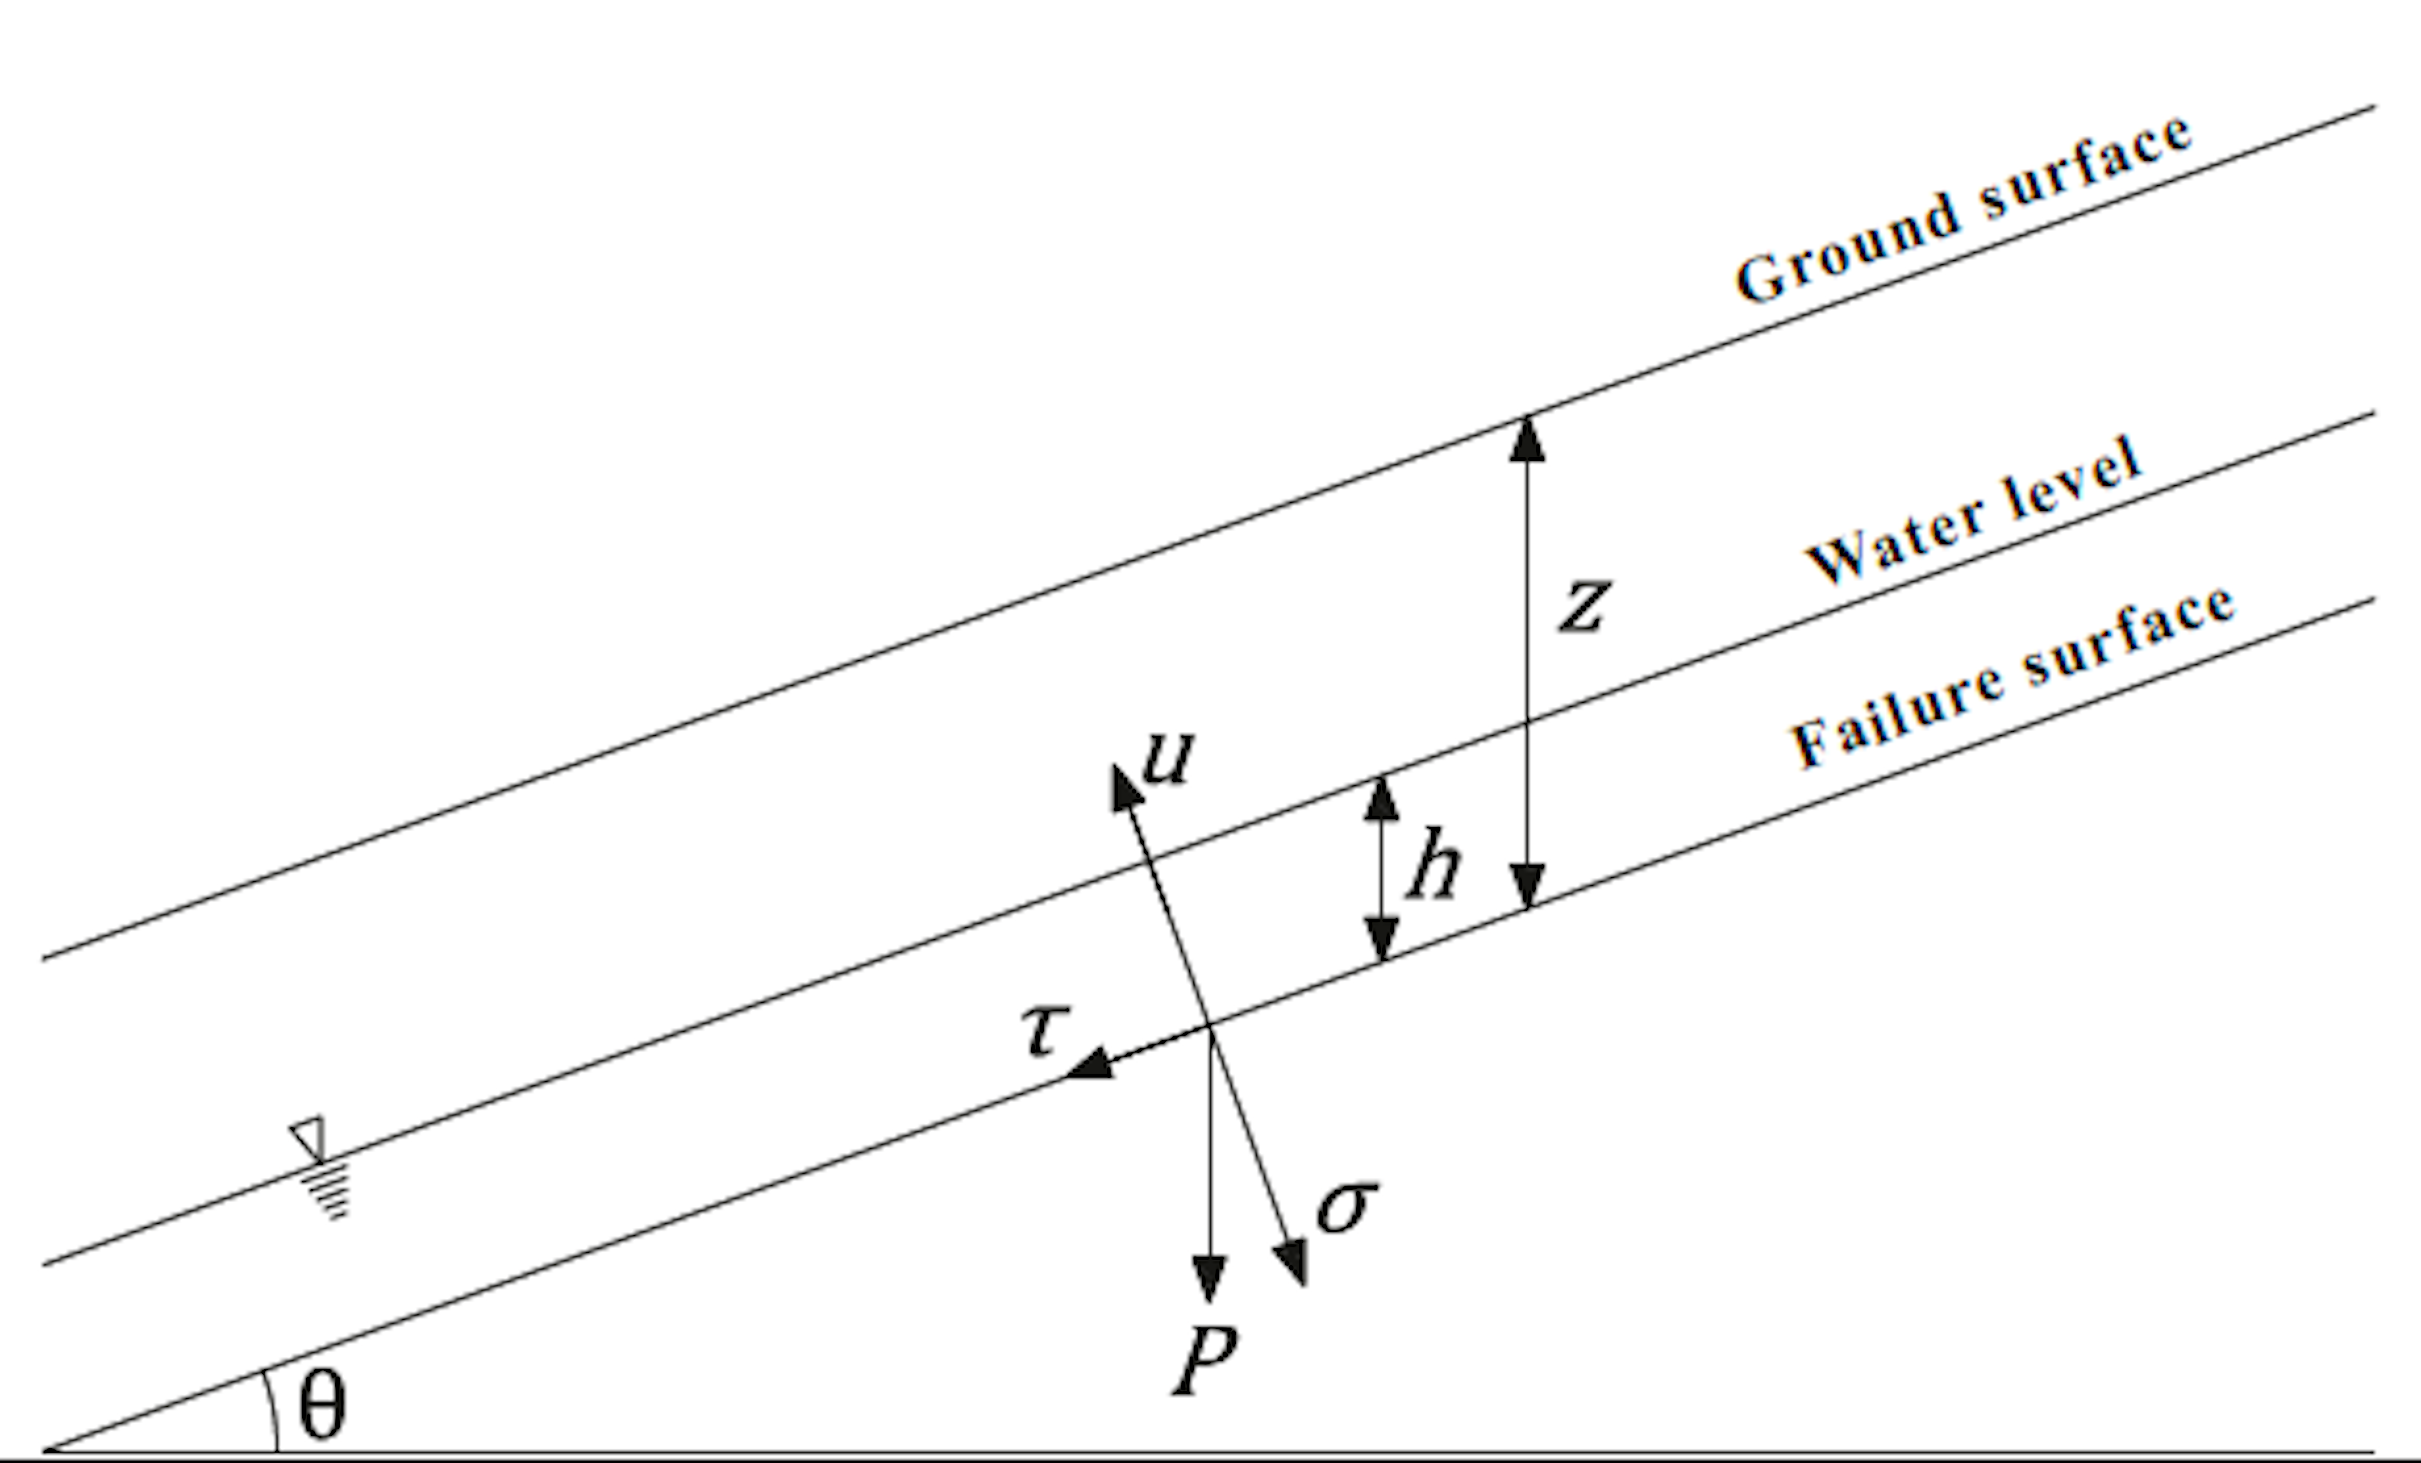
Source: adapted from Michel et al. (2014).
Figure 4 Representation of the infinite slope model. P is the weight of the sliding ground block.
Where: σ It is normal stress (N m-2), u is the pore pressure that opposes the normal stress (N m-2), and ∅ is the angle of internal friction of soil (degrees).
However, Selby (1993) modified Equation 1 to consider the presence of roots and the level of the groundwater table (Equation 2):
Where: ρs is wet soil density (kg m-3), z is soil depth (m), θ is hillslope (degrees), ρw is bulk water density (kg m-3), h is groundwater table depth (m), cr is root cohesion (N m-2), cs is soil cohesion (N m-2), and g is gravitational acceleration (m s-2).
The Safety Factor (SF) is estimated by dividing the right side of Equation 2, representing the soil structural forces (stabilizing forces), by the left side, which corresponds to the destabilizing forces (Equation 3).
In Equation 3, SF = 1 indicates a state of equilibrium; if SF < 1, a hillslope failure occurs; if SF > 1, the hillslope is stable. This value does not indicate absolute stability or instability. Stability increases directly with SF values (Selby, 1993). On the other hand, hillslope stability/instability is closely related to the hydrological conditions of the study area; therefore, SINMAP requires a hydrological model to estimate soil moisture and its relationship with hillslope.
According to Figure 5, α is the area of flow contribution or accumulation (m2), b is contour length (m), and q is the uniform recharge rate (m d-1). Therefore, defining moisture as the portion of saturated soil based on uniform recharge conditions, O’Loughlin (1986) proposed a relationship between water entering the soil as uniform or constant recharge and water leaving the soil by saturation through Equations 4 and 5.
Where: W is soil moisture (m m-1), T is soil transmissivity (m2 d-1), and Ks is the saturated hydraulic conductivity (m d-1) considered homogeneous through the soil profile.
Based on the mechanical and hydrogeological properties, the SINMAP model calculates the Stability Index (SI), defined as the probability that a site will be stable assuming a uniform distribution of the parameters within the established thresholds (Pack et al., 1998, 2005). The SI value normally ranges from zero (most unstable) to one (slightly unstable); however, in places where parameter values allow stability, SI values are greater than one, leading to stability (Michel et al., 2014). Table 1 shows the SINMAP model stability classes.
Table 1 Stability classes based on the safety factor (SF) of the SINMAP model.
| Class | SI Range | Condition | Influence of factors | Description |
| 1 | >1.5 | U-S | Significantly destabilizing factors are necessary for instability | The parameter range never causes instability |
| 2 | 1.5 > SI > 1.25 | M-S | Moderately destabilizing factors are necessary for instability | The parameter range cannot cause rupture |
| 3 | 1.25 > SI > 1.0 | Q-S | Minor destabilizing factors are necessary for instability | The parameter range cannot cause rupture |
| 4 | 1.0 > SI > 0.5 | LL-I | No destabilizing factors are necessary for instability | Pessimistic half to cause rupture with the parameter range |
| 5 | 0.5 > SI > 0.0 | UL-I | The presence of stabilizing factors might be responsible for stability | Pessimistic half to cause rupture with the parameter range |
| 6 | 0.0 > SI | U-U | Stabilizing factors are required for stability | The parameter range never causes instability |
SI = Stability Index, U-S = Unconditionally Stable, M-S = Moderately Stable, Q-S = Quasi-Stable, LL-I = Lower Instability Limit, UL-I = Upper Instability Limit, U-U = Unconditionally Unstable.
Source: adapted from Michel et al. (2014).
The SINMAP model calculates the spatial distribution of SI and SSI; for the former, it is based on the calculation of the SF for each DEM pixel. SF is defined as the relationship between stabilizing (soil cohesion and friction) and destabilizing (force of gravity, mainly) forces (Pack et al., 2005). Thus, Equation 6 is obtained by combining the infinite slope stability model and the uniform-regime hydrological model, corresponding to the SF used in the SINMAP model (Pack et al., 2005; Pradhan and Kim, 2015).
Where: cα is the dimensionless cohesion parameter (
Due to the spatial and temporal variability of rainfall and soil type (Pack et al., 1998, 2005; Pradhan and Kim, 2015), the SINMAP model works with minimum and maximum limits of the parameters; assuming the following:
The lateral subsurface flow occurs through the topographic gradient. This implies that the area of contribution to surface runoff at any point is given by the basin area α, according to the relief conditions.
The lateral discharge q at any point has a uniform recharge R (m h-1).
The lateral flow capacity at each point is given by T sin θ, where T is soil transmissivity (m2 h-1).
Estimation of indexes
The DEM was hydrologically corrected using the ArcGIS® Fill tool, which allows for eliminating model depressions so that each cell has a defined flow direction, eventually reaching lower elevations when moving from one cell to another (Barnes et al., 2014; Survila et al., 2016; Wang and Liu, 2006); then the hillslope, flow direction, and contribution area were obtained. The parameters for each calibration region of the SINMAP model are shown in Table 2, obtained from field data collection by Velescu (2009) and laboratory tests. Plant cover was obtained from the association between calibration regions and land use of INEGI’s Series VI (INEGI, 2017). The limit values of the T/R parameter associated with soil depth were determined with the average values of the landslide depth identified in the field, which varied between 6 and 14 m.
Table 2 Calibration regions and values required by the SINMAP model.
| Region | Name | Plant cover | Moist soil density |
T/Rmín | T/R max | ca mín | ca máx | Φmín | Φmáx |
| kg m-3 | m | m | N m2 | N m2 | ° | ° | |||
| 1 | Igneous | Forest | 1815 | 2500 | 3000 | 0.10 | 0.30 | 45 | 60 |
| 2 | Sedimentary | Tropical forest | 1640 | 2000 | 3000 | 0.00 | 0.25 | 30 | 45 |
T, soil transmissivity (m2 h-1), equivalent to saturated hydraulic conductivity K (m h-1) by soil depth (m); R, uniform recharge state (m h-1); T/R, transmissivity rate by effective recharge (m);ca, soil cohesion (N m2); Φ, maximum and minimum thresholds for the internal friction angle of the soil (°).
The two calibration regions defined according to the basin geology allowed the application of the SINMAP model to estimate SI and SSI. Subsequently, a reclassification was performed to determine the spatial variation of the index classes in the delimited subbasins.
Landslide inventory
The landslide inventory was carried out through field trips from 2005 to 2021, recording the location of each landslide and, subsequently, its spatial characterization based on Landsat-7 satellite images, Sentinel-2A, and historical images from Google Earth®. Satellite images were obtained from the United States Geological Survey (USGS) official website, https://earthexplorer.usgs.gov/, with the processing levels 1TP for Landsat and 2A for Sentinel. During the first years of the inventory, landslides were recorded through their spatial location with GPS equipment supported by satellite imagery; their spatial distribution in the basin was known. This methodology was similar to the approach used by Alanis-Anaya et al. (2017), although these researchers used SPOT images and orthophotos for improved detail.
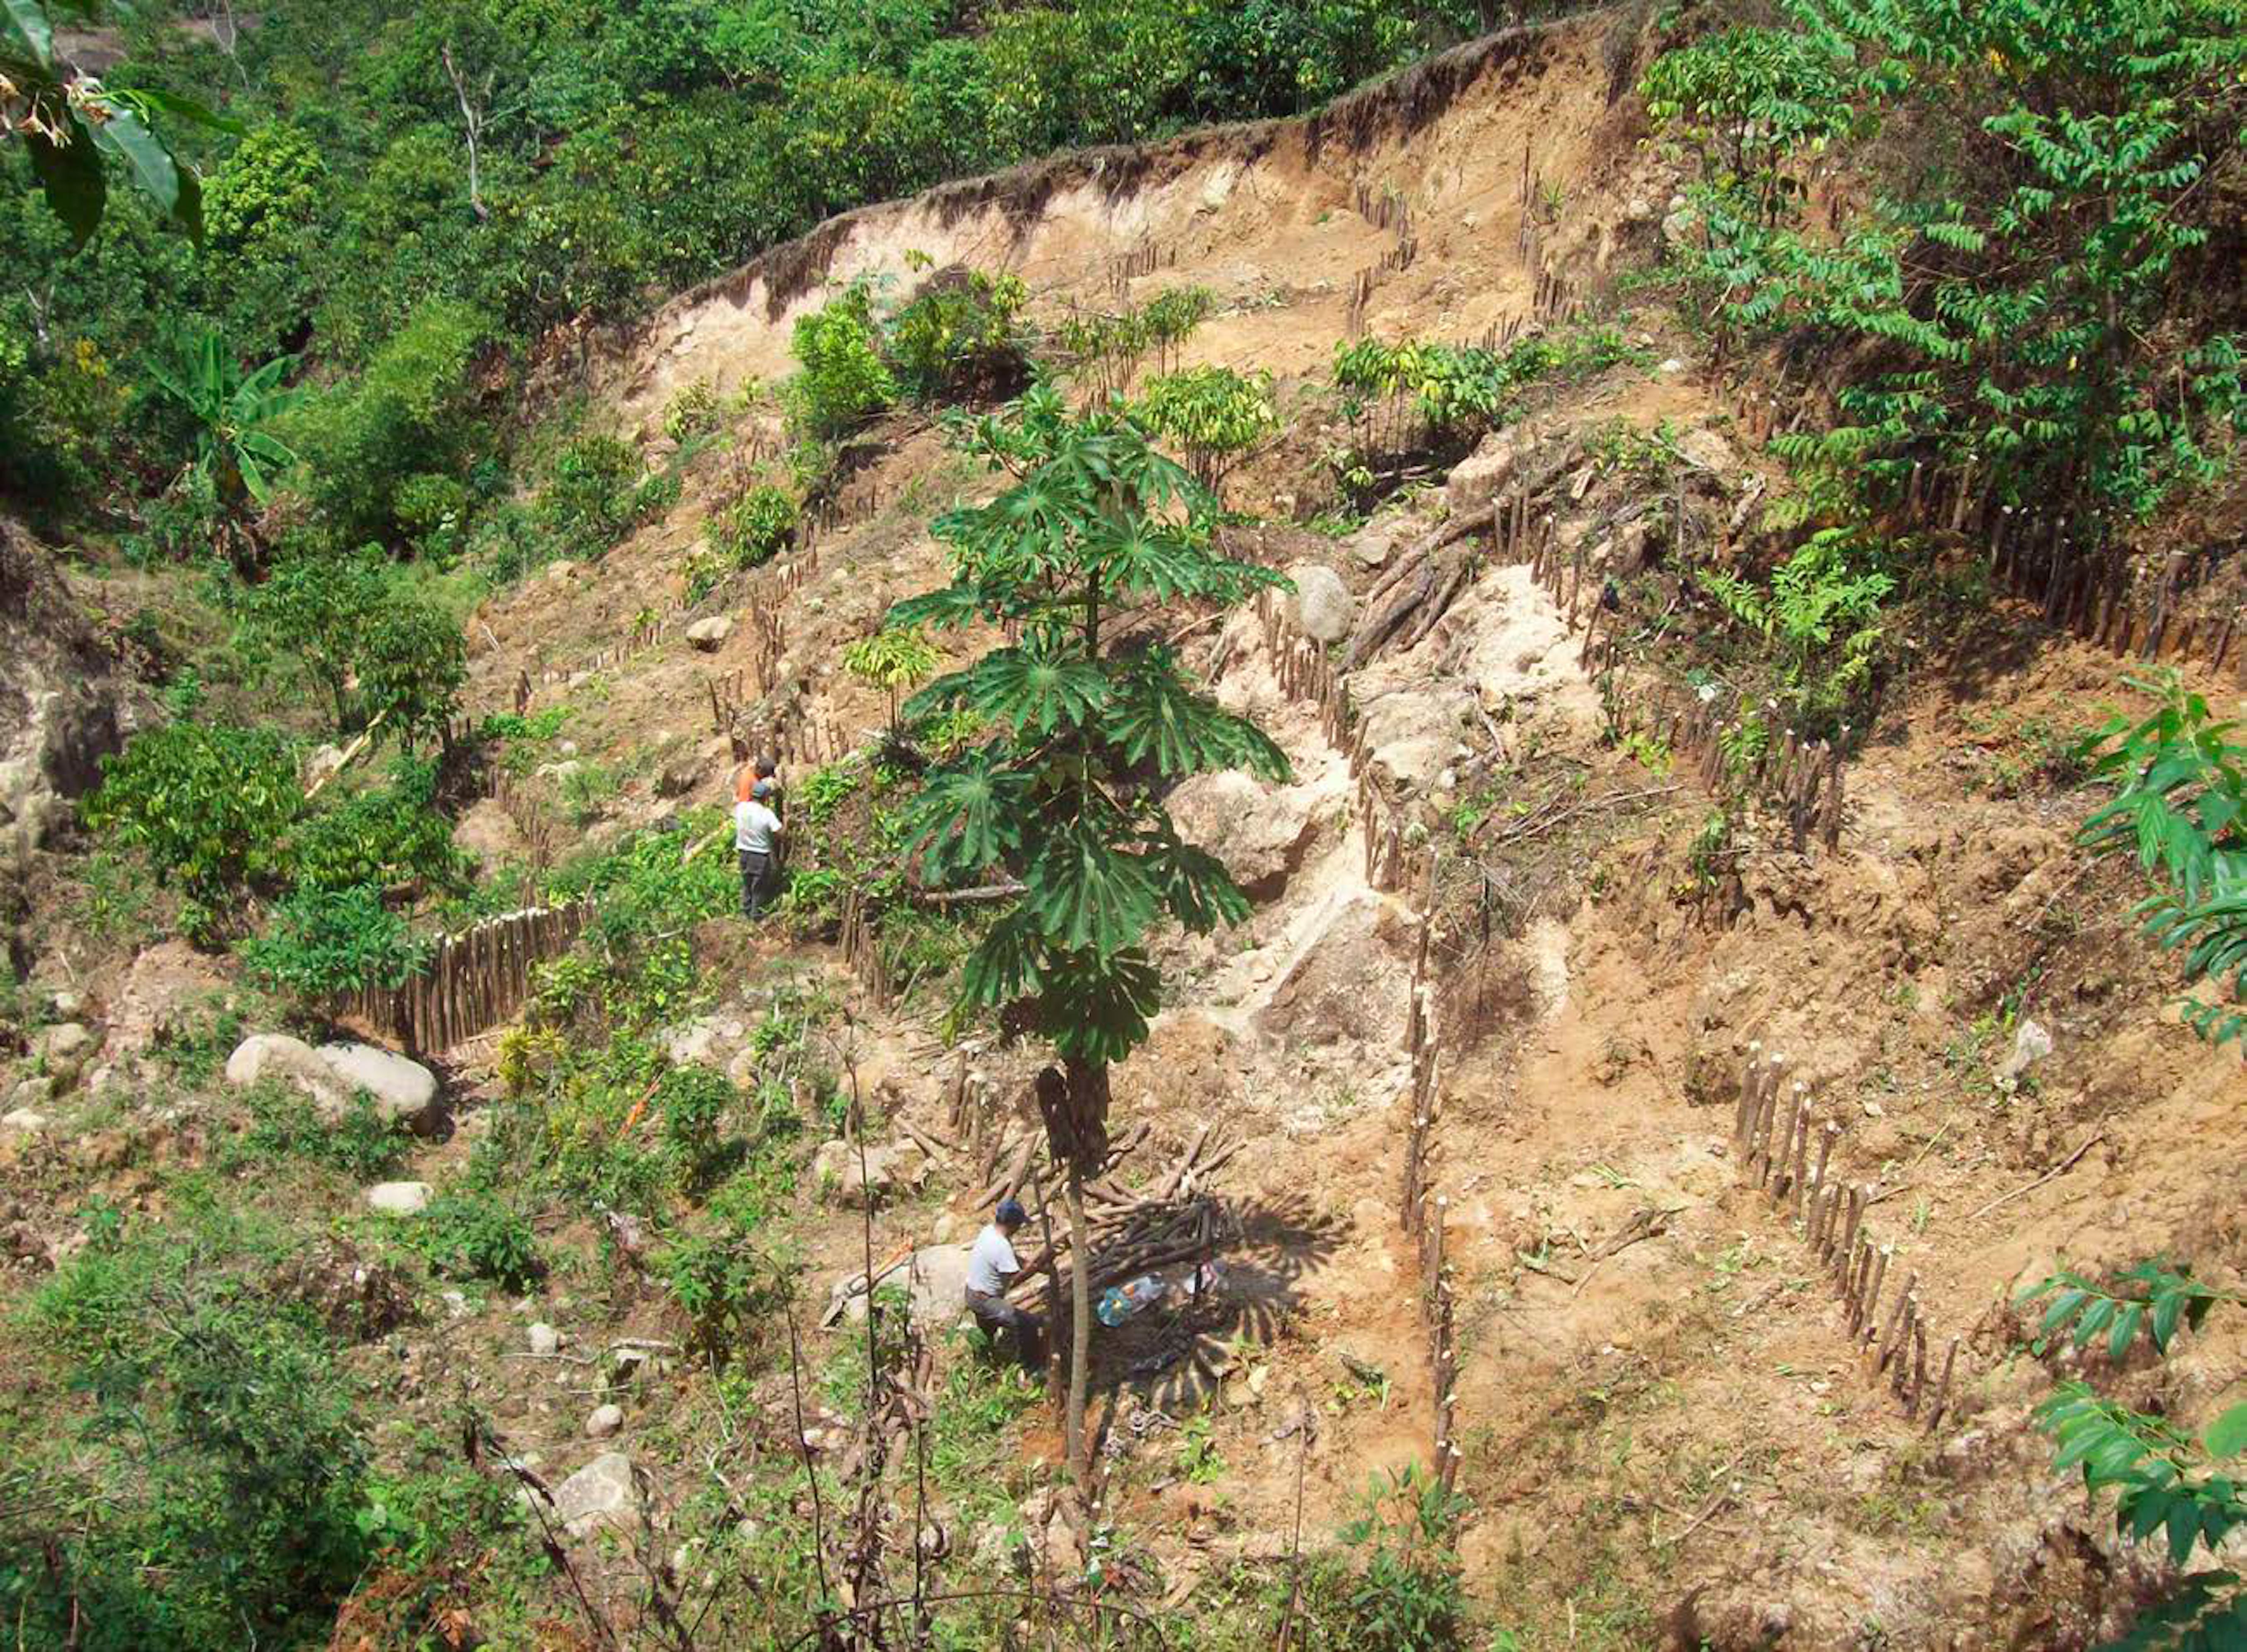
A total of 281 landslide sites were identified for the period 2005 to 2021, mostly located in the upper part of the basin. The main hydrometeorological events that led to landslides included Hurricane Stan in October 2005, with intense rainfall that reached a 100-year return period over six days (Arellano-Monterrosas, 2010; Murcia and Macías, 2009). Figure 6 shows a landslide of a surface of approximately 1 950 m2 and an average depth of 14 m.
Evaluation of the SINMAP Model Performance
The accuracy of the map of unstable zones produced with the SINMAP model was evaluated using the Receiver Operating Characteristic (ROC) Curve (Pradhan and Kim, 2015), an effective method for representing the quality of probability detection and prognosis systems (Svets, 1988).
The ROC curve method provides a curve given by a binary classification confusion matrix according to four possible outcomes (Table 3). These outcomes are derived by comparing the model results with the landslide inventory, examining the rates of true positives and false negatives (Moresi et al., 2020).
Table 3 Calculation parameters of the ROC curve.
| Inventory with landslides | Inventory w/o landslides | |
| SINMAP with landslides | True Positive (TP) | False Positive (FP) |
| SINMAP w/o landslides | False Negative (FN) | True Negative (TN) |
Source: adapted from Moresi et al. (2020).
The area under the ROC curve (AUC) represents the accuracy evaluation index of the model, ranging from 0.5 (random prediction, represented by a diagonal straight line) to 1.0 (perfect prediction) and can be used for model comparison (Hosmer and Lemeshow, 2005), This classification is shown in Table 4.
Table 4 Model performance values based on the area under the ROC curve.
| Area under the ROC curve | Validation |
| 0.5 < AUC < 0.6 | Failed |
| 0.6 < AUC < 0.7 | Poor |
| 0.7 < AUC < 0.8 | Acceptable |
| 0.8 < AUC < 0.9 | Excellent |
| 0.9 < AUC < 1.0 | Outstanding |
Source: adapted from Hosmer and Lemeshow (2005).
According to Pradhan and Kim (2015) regarding physical models, the stability index (SI) is reclassified into two classes (stable, SI > 1.0; unstable, SI ≤ 1.0). It is then superimposed with the landslide inventory to calculate the number of land units with the presence or absence of landslides; afterward, the contingency table is derived for the specific cut when crossing susceptibility classes and landslide presence/absence.
RESULTS AND DISCUSSION
This section outlines the factors triggering landslides according to the results of the SINMAP model and their physical assessment, which is attributed to groundwater recharge in soil as a triggering condition, in addition to geotechnical, hydrological, and soil parameters. First, SI values are analyzed, followed by SSI values; finally, the behavior of the SINMAP model is evaluated.
Stability index
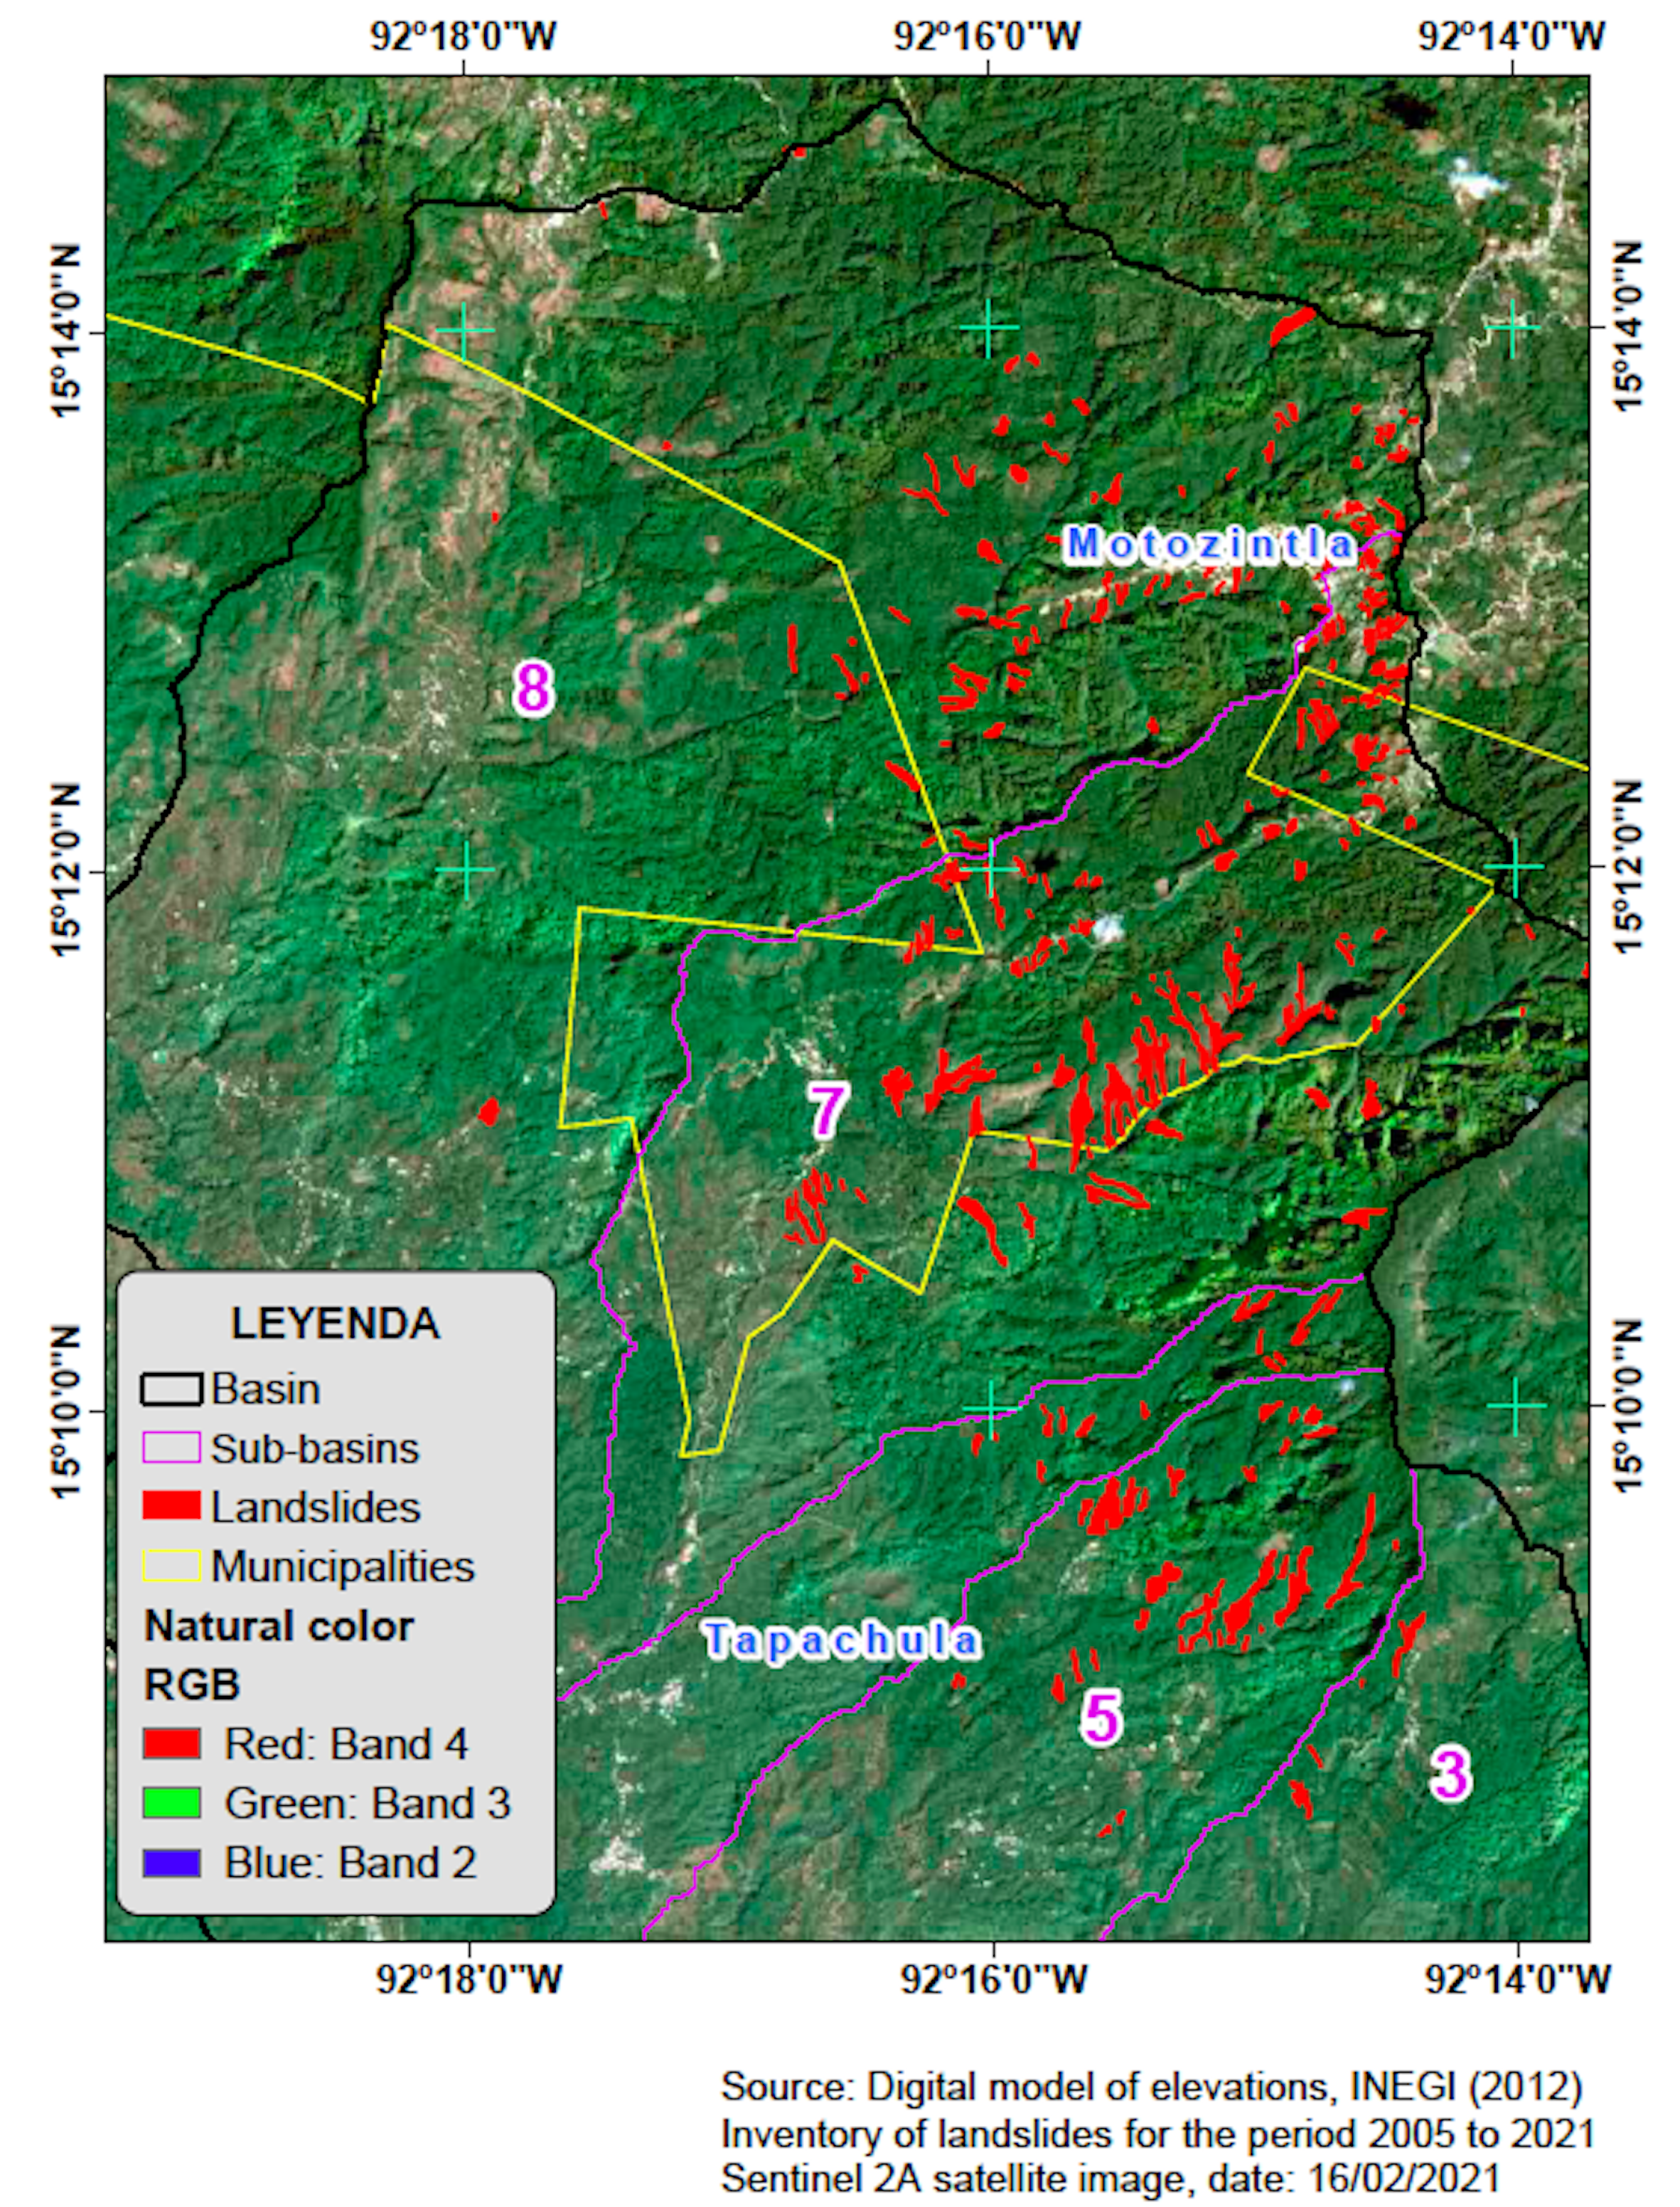
Based on the spatial distribution of landslides, all were found to occur in areas with intrusive and extrusive igneous rocks; in contrast, areas with sedimentary rocks have no records of landslides (Figure 7). A high correlation was observed between areas with steep hillslopes and the presence of landslides, consistent with Fabbri et al. (2003), who determined that topography is one of the key elements defining the location of landslides.
The Stability Index (SI) generated by the SINMAP model classified the Huehuetán River basin into six classes (Figure 8). Each class represents the range of SI values, indicating the probability that each pixel evaluated will get an SF > 1 (Michel et al., 2014). Table 5 shows that the SINMAP model classified 24.36% of the area (77.76 km2) as unstable and 75.64% (241.51 km2) as stable. Previously, Arellano-Monterrosas (2012) determined the vulnerability to landslides in terms of maximum precipitation over 24 hours, soil porosity, hillslope, current land use, and population density; as a result, a surface area of 35.42% of the basin was classified as having high to very high vulnerability. On the other hand, Bischetti and Chiaradia (2010) conducted a study in forest areas and found that 17.3% and 82.7% of the study area was unstable, respectively, emphasizing the effect of soil and root cohesion on landslides.
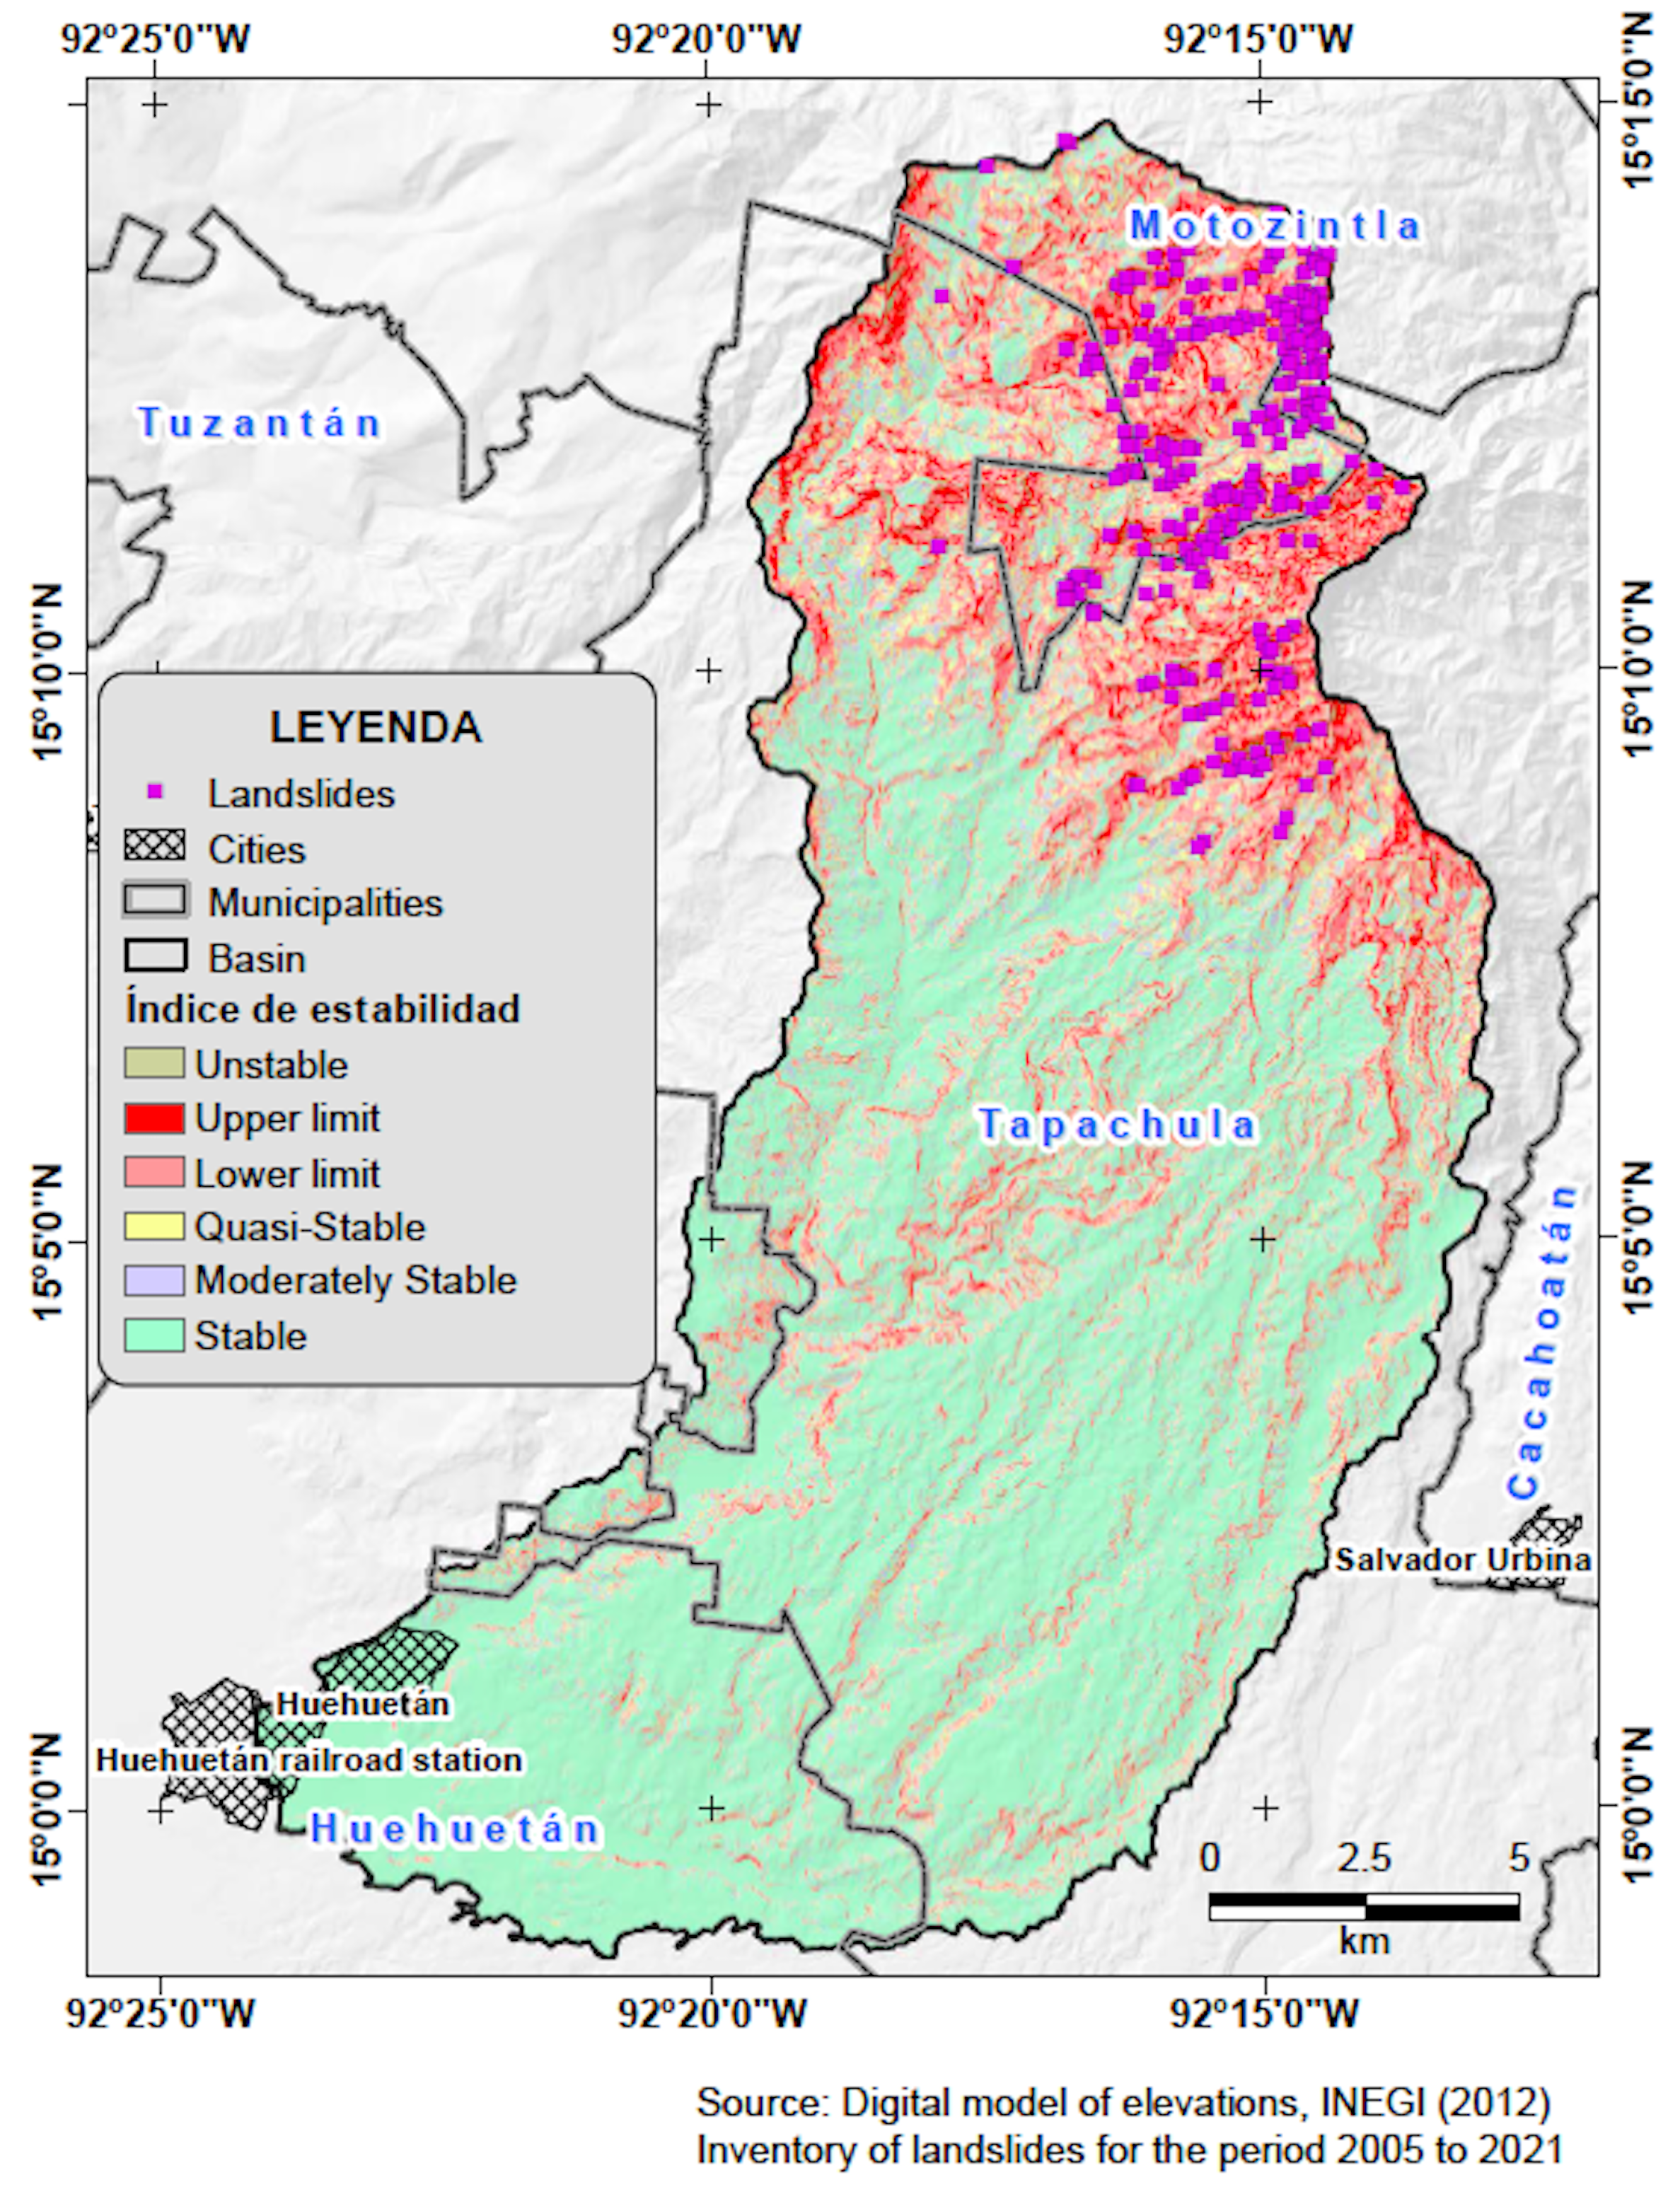
Table 5 Stability classes based on the stability index (SI).
| Zone | Class | Condition | SI Range | Area | Area | Landslides | ||
| km2 | % | Number | % | |||||
| Stable area | 1 | U-S | SI > 1.5 | 174.29 | 54.59 | 12 | 4.27 | |
| 2 | M-S | 1.5 > SI > 1.25 | 30.96 | 9.7 | 10 | 3.56 | ||
| 3 | Q-S | 1.25 > SI > 1.0 | 36.26 | 11.35 | 30 | 10.68 | ||
| Unstable area | 4 | LL-I | 1.0 > SI > 0.5 | 59.8 | 18.73 | 127 | 45.2 | |
| 5 | UL-I | 0.5 > SI > 0.0 | 14.24 | 4.46 | 90 | 32.03 | ||
| 6 | U-U | 0.0 > SI | 3.72 | 1.17 | 12 | 4.27 | ||
| Total | 319.27 | 100 | 281 | 100.00 | ||||
U-S = Unconditionally Stable, M-E = Moderately Stable, Q-E = Quasi-Stable, LI-I = Lower Instability Limit, LS-I = Upper Instability Limit, U-U = Unconditionally Unstable
A total of 229 landslides occurred in the area classified as unstable by SINMAP (Figure 8), and 52 landslides in the area classified as stable. This finding suggests an excessive number of landslides in the stable area; however, their area is significantly smaller, 0.2 km2 (20 ha), while the area with landslides in the unstable area was 1.19 km2 (119.22 ha). The main difference is that the areas with higher stability determined the presence of smaller landslides than those in unstable areas, where landslides with areas greater than one hectare were recorded.
Given the conditions in the basin related to topography and the occurrence of heavy rains, precipitation was one of the main factors identified as a trigger in most landslides. This finding is consistent with Yilmaz and Keskin (2009) and Nery and Vieira (2015), who indicate that pore pressure and air displacement through the infiltrated water increase during heavy rains of long duration, which increase soil weight and reduce shear stress, leading to landslides. Besides, Zhuang et al. (2017) analyzed precipitation scenarios and concluded that soil stability in hillslope areas is sensitive to prolonged periods of heavy rainfall. Additionally, Zúñiga and Magaña (2018) found a trend of an increasing number of events of 100 mm of precipitation accumulated over three days on the Chiapas coast in recent decades, implying a higher incidence of landslides in the region.
The susceptibility to landslides is associated with steep hillslopes, relief, and soil characteristics, magnified by extreme hydrometeorological events that cause groundwater accumulation in soil, triggering mass movements. Sengupta et al. (2010) found that landslides occur from 250 mm of rain accumulated over 15 days; in the Huehuetan river basin, Murcia and Macias (2009) reported 242 mm of rainfall on 04 October, which produced landslides in the upper part.
The proximity of the Tacana volcano influences the relief of the Huehuetán river basin; as a result, the soil properties in the study area are associated with processes that have occurred over millions of years, giving rise to a steep relief and landslide susceptibility in the upper subbasins.
Currently, 75.64% of the basin area is stable (Table 5). However, hillslope stability is strongly associated with relief; thus, areas of higher stability are located in the lower part, while more unstable areas are found in the upper part due to the rugged relief (Figure 8). An issue in unstable areas is that heavy rainfall over a short period combined with a decreased plant cover leads to higher landslide susceptibility by saturation of soil pores (Collins and Znidarcic, 2005; Guns and Vanacker, 2013).
The most unstable subbasins are 7 and 8 (Table 6), located in the upper part. The SI value by subbasin is important for prioritization, as it determines the level of soil degradation due to relief conditions and geotechnical properties. In addition, they allow for a prioritization of subbasins according to their susceptibility to landslides.
Table 6 Area occupied according to the stability index.
| Condition | Area by SI class for each subbasin (ha) | Basin (ha) | |||||||
| 1 | 2 | 3 | 4 | 5 | 6 | 7 | 8 | ||
| U-S | 9851.82 | 1937.11 | 1993.04 | 1037.47 | 403.38 | 690.37 | 393.26 | 1122.12 | 17428.57 |
| M-S | 1045.48 | 218.90 | 518.47 | 216.57 | 140.01 | 161.27 | 229.09 | 565.87 | 3095.66 |
| Q-S | 965.42 | 195.42 | 598.02 | 195.15 | 202.93 | 166.48 | 418.47 | 884.10 | 3625.99 |
| LL-I | 961.81 | 184.16 | 870.26 | 184.73 | 487.67 | 301.29 | 1049.61 | 1940.68 | 5980.21 |
| UL-I | 111.08 | 15.69 | 156.97 | 19.99 | 138.94 | 87.29 | 371.39 | 522.90 | 1424.25 |
| U-U | 14.22 | 0.98 | 21.85 | 2.61 | 49.96 | 18.07 | 130.06 | 134.54 | 372.29 |
| Total | 12949.83 | 2552.26 | 4158.61 | 1656.52 | 1422.89 | 1424.77 | 2591.88 | 5170.21 | 31926.97 |
Stability Index, U-S = Unconditionally Stable, M-S = Moderately Stable, Q-S = Quasi-Stable, LL-I = Lower Instability Limit, UL-I = Upper Instability Limit, U-U = Unconditionally Unstable.
Soil saturation index
As regards the distribution of soil saturation, saturated areas are located in the lower part, close to stream channels. In the upper part, the association between hillslope, precipitation, plant cover, and soil type leads to increased susceptibility to landslides (Figure 9). Besides, in the high part, no saturated areas are observed on hillslopes, so surface runoff and sediment transport have a greater impact. On the other hand, in the lower part, there are areas where runoff and sediments accumulate due to the slight hillslopes in channels, favoring sediment deposition and causing a significant reduction of the hydraulic capacity of the channel (Pérez-Nieto et al., 2012); as a result, channels tend to overflow due to the rising water level during heavy rains, causing flooding.
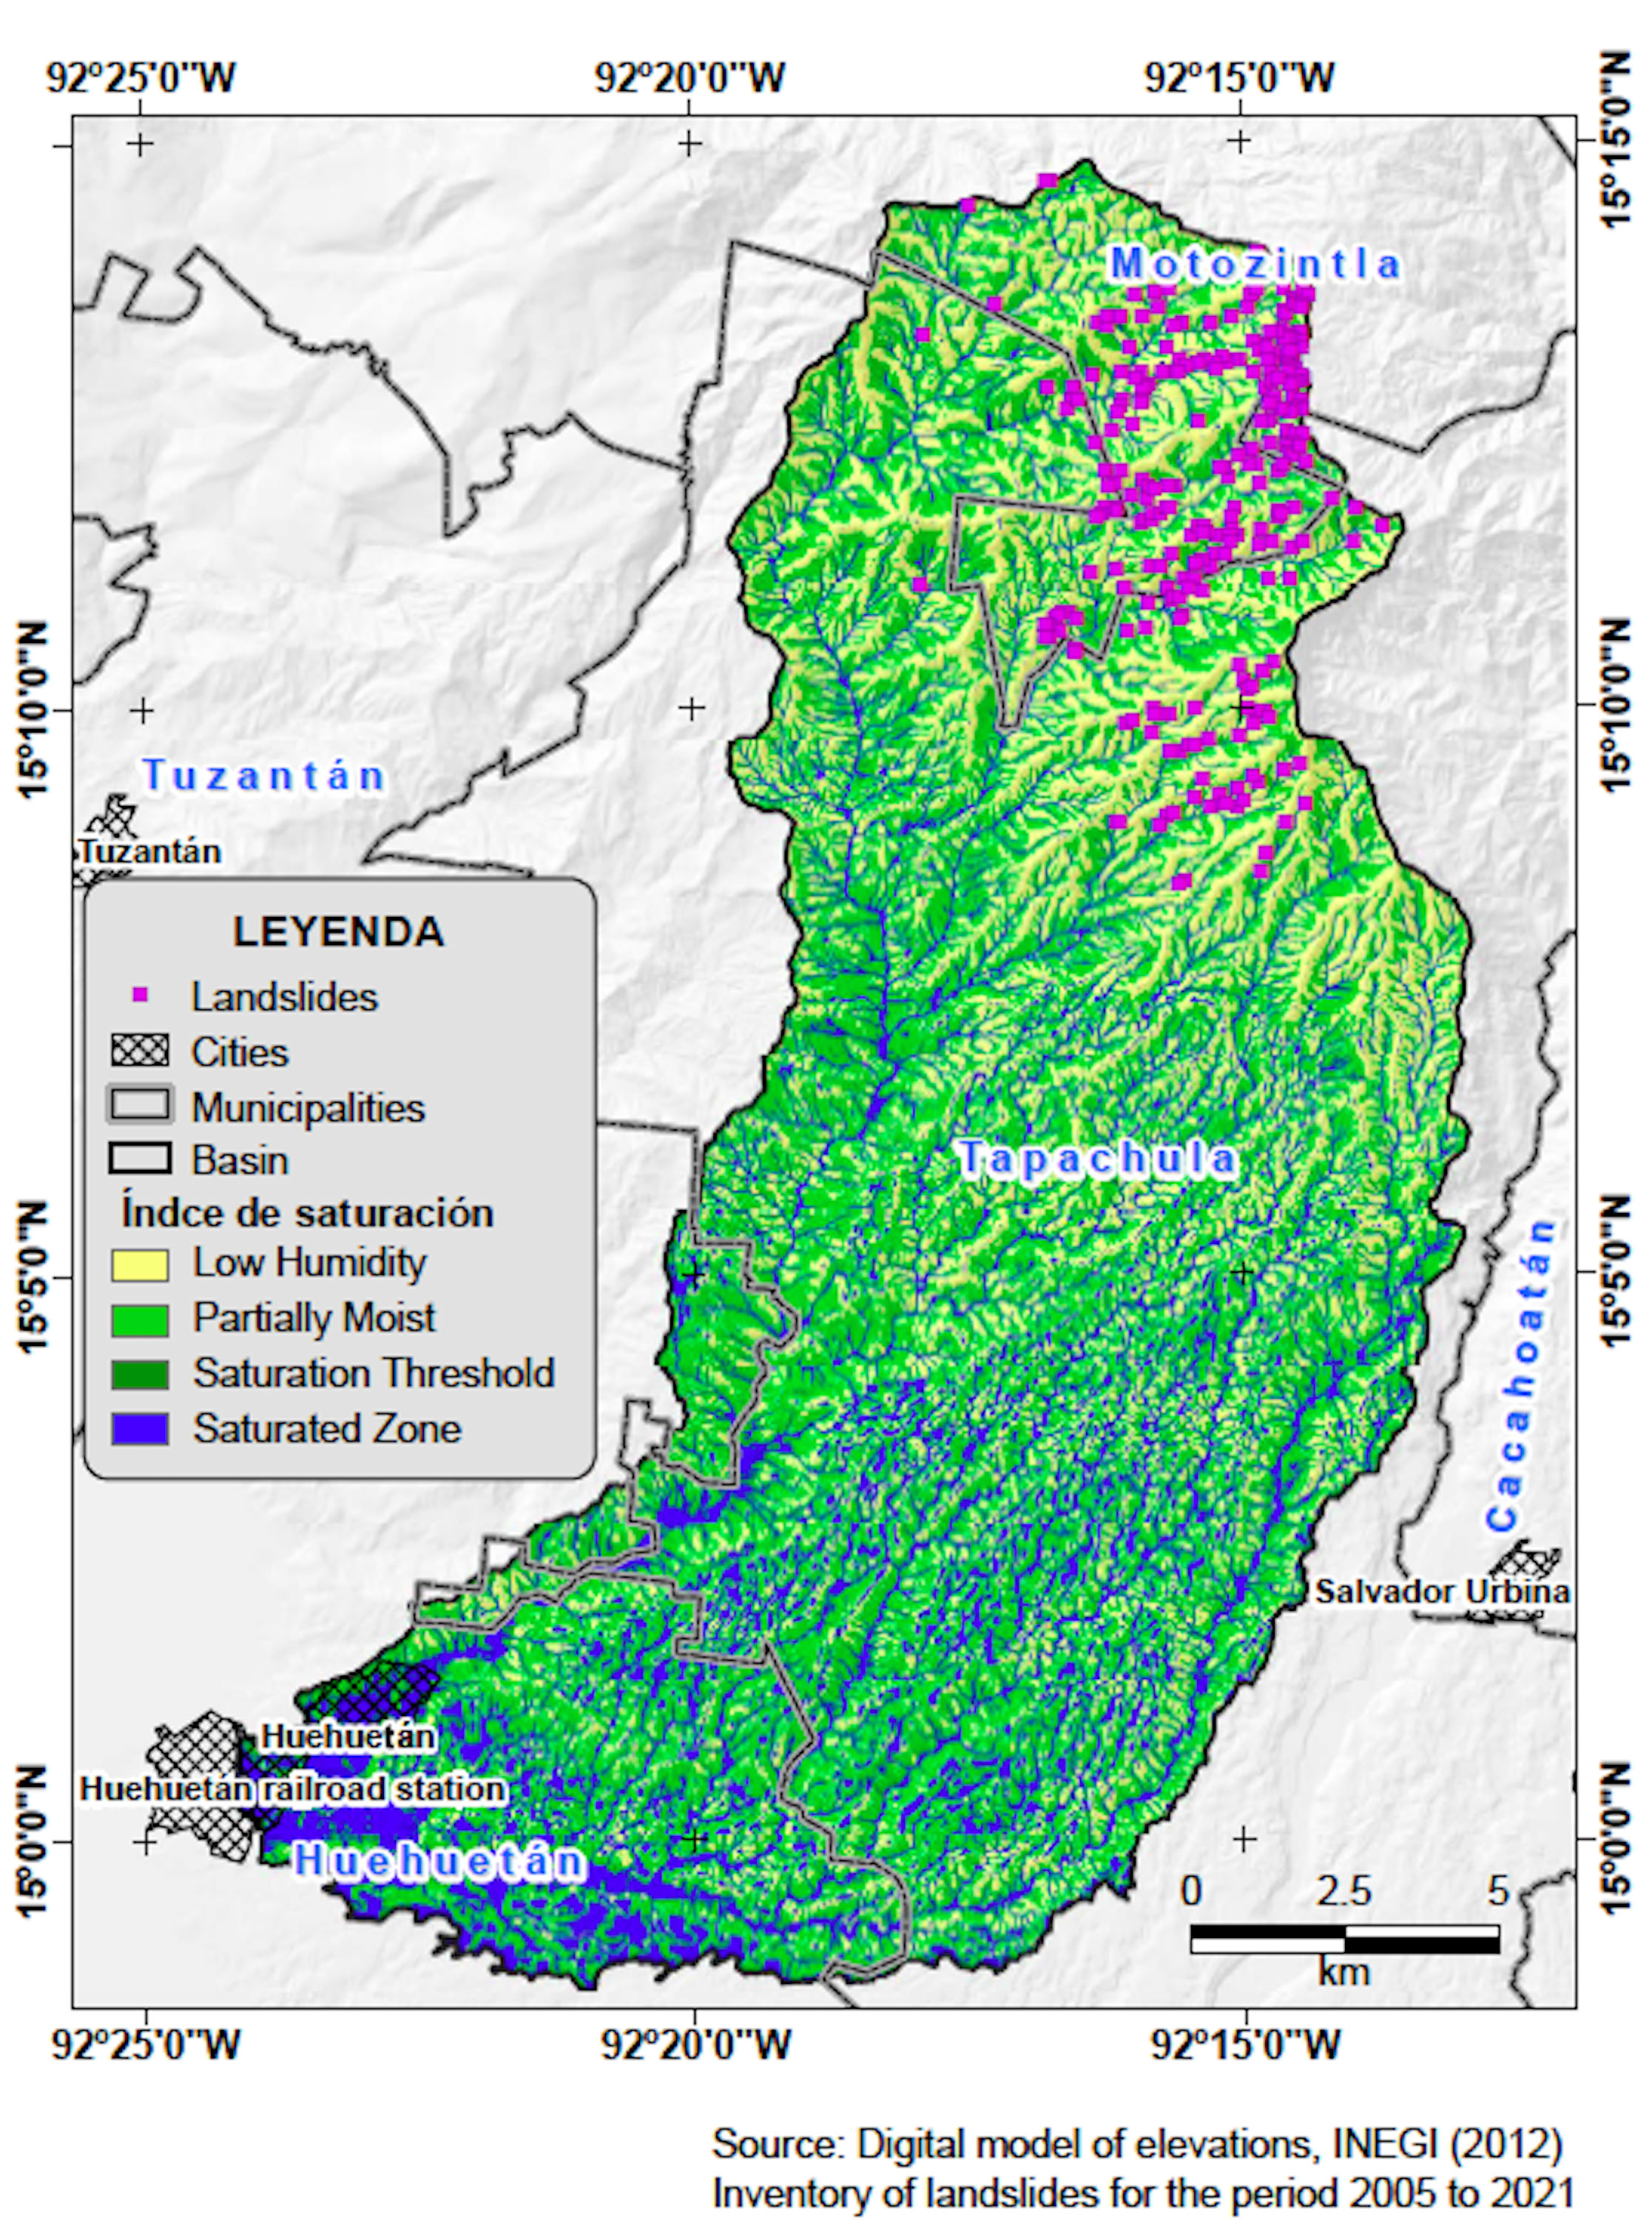
The main driver of instability in upper hillslopes is the combination of soil saturation, geology, hillslope, and plant cover (Table 7). According to Keles and Nefeslioglu (2021), dense vegetation cover in temperate and tropical forests is a key element for decreasing the spatial distribution of unstable areas and functions as a natural mitigation measure for landslides. Although Bruijnzeel (2004) mentions that plant cover can prevent erosion and surface landslides, deep landslides (>3 m) are associated with geological and climatic factors. For their part, Alanís-Anaya et al. (2017) indicate that all areas covered with natural vegetation will be associated with areas of instability at some point from the effects of changes in land use.
Table 7 Area occupied by each class of the Soil Saturation Index.
| Class | Area by SSI class for each subbasin (ha) | Basin ha |
||||||||
| 1 | 2 | 3 | 4 | 5 | 6 | 7 | 8 | |||
| L-H | 3748.10 | 550.30 | 1852.40 | 530.50 | 760.00 | 624.00 | 1456.70 | 2672.50 | 12194.50 | |
| P-M | 5322.70 | 1104.20 | 1695.50 | 848.80 | 512.40 | 598.70 | 909.70 | 1964.10 | 12955.90 | |
| S-T | 320.70 | 89.90 | 64.30 | 36.80 | 17.00 | 29.30 | 32.10 | 83.00 | 673.00 | |
| S-Z | 3558.50 | 807.80 | 546.50 | 240.50 | 133.50 | 172.80 | 193.40 | 450.60 | 6103.60 | |
| Total | 12949.80 | 2552.30 | 4158.60 | 1656.50 | 1422.90 | 1424.80 | 2591.90 | 5170.20 | 31927.00 | |
L-H = Low Humidity, P-M = Partially Moist, S-T=Saturation Threshold, S-Z=Saturated Zone
Most of the surface area in the basin is classified in the moist class, followed by the low-humidity class, and 19.12% is in the saturated zone. However, the upper subbasins (5, 6, 7, and 8) have a greater influence on the degree of soil saturation when combined with heavy rains, eroded soils, degraded plant cover — areas subjected to changes in land and vegetation use, mainly for seasonal agriculture, coffee plantations, urban growth. and areas devoid of vegetation — (Pérez-Nieto et al., 2012; Revenga et al., 1999), and areas susceptible to landslides, leading to hillslope instability by increasing the water content in soil pores, reducing shear stress, and ultimately generating landslides.
SINMAP is an adequate model that can be easily implemented in comparison with other methodologies such as uncertainty analysis, neural networks, fuzzy logic, and logistic regression (Huabin et al., 2005). The data required in SINMAP are easy to obtain, as this model is threshold-based (Michel et al.2015); in contrast, the other methods require detailed field information and complex laboratory tests, which are more time- and resource-consuming to yield results similar to those of SINMAP.
Evaluation of the SINMAP Model
To determine the spatial distribution of landslide stability, SI was reclassified based on the SF classification ranges: classes with an SF ≤ 1.0 were considered for unstable areas, and classes with SF > 1.0 for stable areas (Michel et al., 2014). The success rate evaluates the number of landslides used in the model that are successfully captured by the susceptibility map, thus representing a measure of the model efficiency.
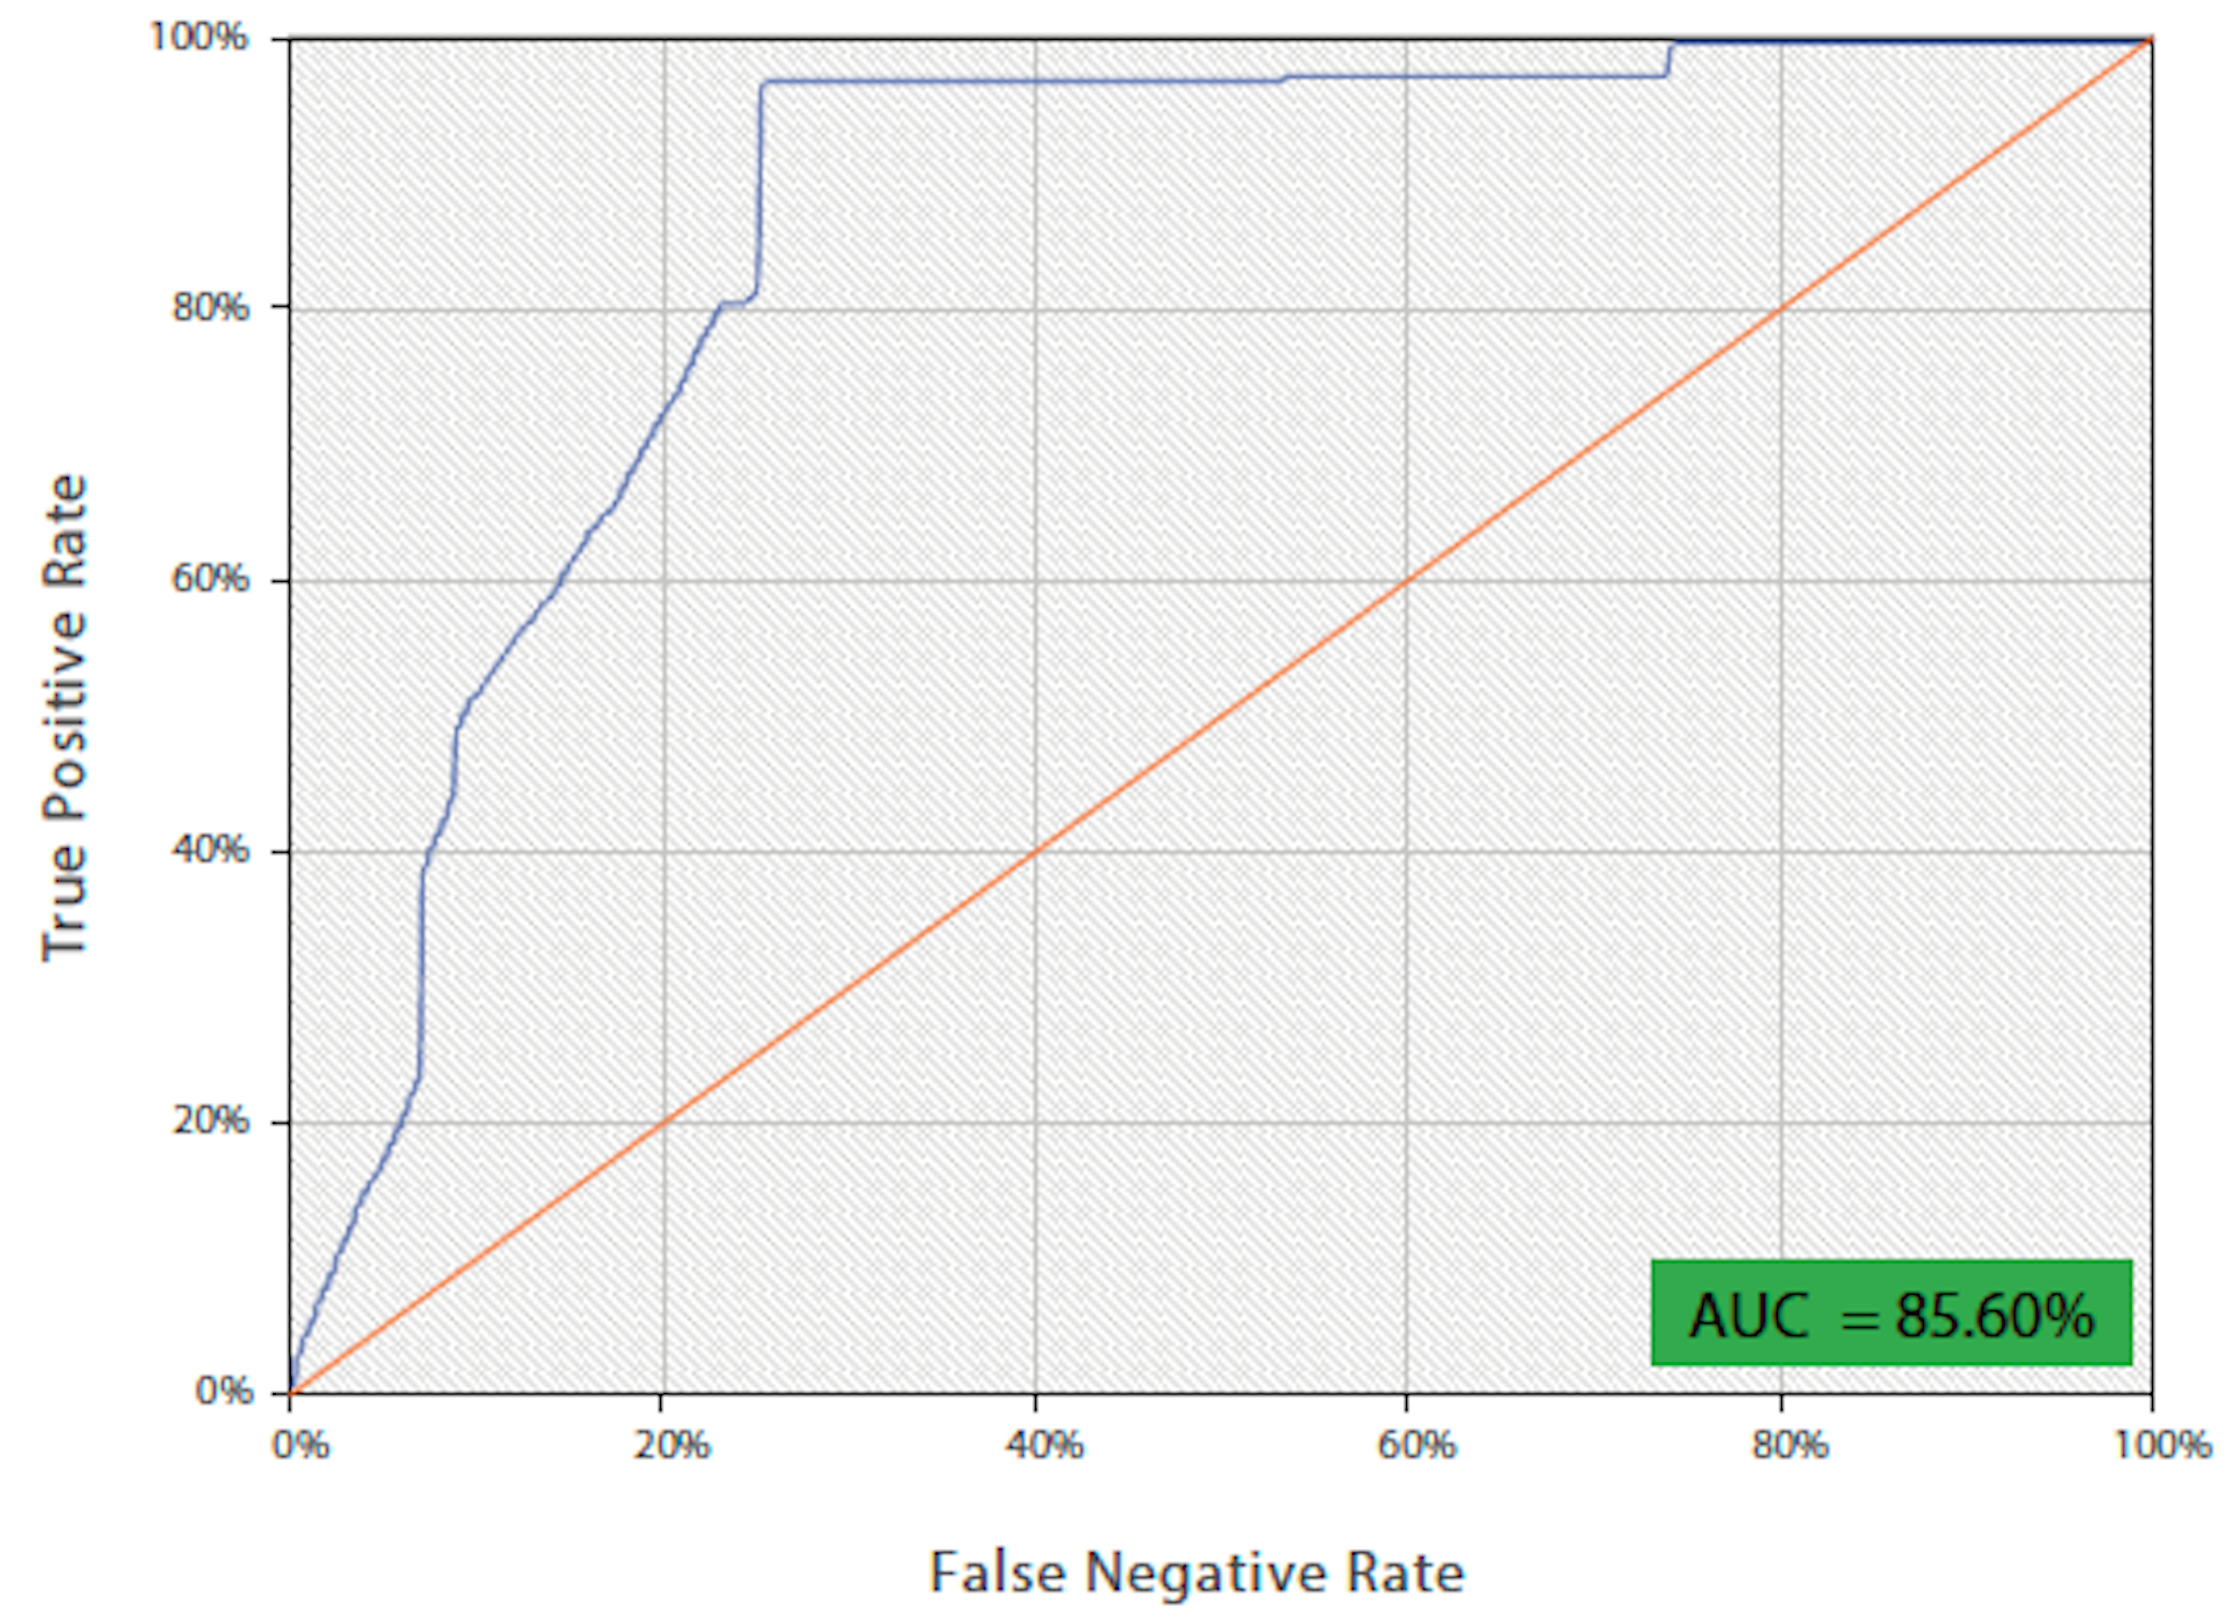
The SINMAP map of landslide susceptibility was validated with the landslide inventory, yielding an accuracy of 85.60% using the ROC curve (Figure 10). Based on these results, the SINMAP model can be regarded as an excellent tool for predicting landslide areas in the Huehuetán River basin.
CONCLUSIONS
The SINMAP model allows for determining the Stability index (SI) and the Soil Saturation Index (SSI) easily and accurately. Both indices can be used for urban planning and to reduce serious damage from landslides. For the study area, SINMAP allowed obtaining the spatial distribution of SI and SSI, which characterized 24.36% (77.76 km2) of the study area as unstable and 75.64% (241.51 km2) as stable.
In addition to the susceptibility areas, the model also determines the potential causes of landslides, thus supporting better land-use management planning. In the Huehuetán River basin, the areas susceptible to landslides are due to soil saturation generated by the amount and intensity of precipitation and are concentrated mainly in the upper part. Subbasins 7 and 8 are worth highlighting, in which more than 50% of the area is classified as unstable, associated with the local topographic conditions, soil type, and plant cover.
The ROC curve indicates that the SINMAP model yields an excellent prediction accuracy, with 85.60%, and was effective in predicting landslide-prone areas larger than one hectare. These results suggest that the SINMAP model is a valuable tool for SI and SSI mapping that uses easily accessible information; it contributes to the spatial analysis of landslide susceptibility, which is important for decision-making in urban land-use planning in mountain areas.
Finally, the results and characterization of the basin validate the SINMAP model and will allow the establishment of structural and non-structural measures to control or mitigate the effects of landslides. In addition, it is important to conduct further studies or characterize basins and their susceptibility to landslides, particularly in Mexico, where, according to the World Fund for Disaster Reduction and Recovery, the Chiapas coast is considered highly susceptible to landslides.
REFERENCIAS
Abramson, L. W., Lee, T. S., Sharma, S. y Boyce, G. M. (2001). Slope stability and stabilization methods. John Wiley & Sons. [ Links ]
Alanís-Anaya, R. M., Legorreta-Paulín, G., Mas, J. F. y Granados-Ramírez, G. R. (2017). Susceptibility to gravitational processes due to land cover change in the Río Chiquito-Barranca del Muerto subbasin (Pico De Orizaba Volcano, México). Journal of Mountain Science, 14(12), 2511-2526. https://doi.org/10.1007/s11629-016-4268-9 [ Links ]
Arellano-Monterrosas, J. L. (2012). Vulnerabilidad y gestión de riesgos por deslizamientos e inundaciones en la cuenca superior del río Huehuetán, Chiapas. Tesis de doctorado. Instituto Mexicano de Tecnología del Agua. [ Links ]
Arellano-Monterrosas, J. L. L. (2010). Integrated water resources management to reduce the vulnerability to land sliding and flooding in the sierra madre of Chiapas watersheds. Ingeniería Agrícola y Biosistemas, 2(1), 23-37. https://doi.org/10.5154/R.INAGBI.2010.05.006 [ Links ]
Aristizábal, E., Martínez, H. y Vélez, J. I. (2010). Una revisión sobre el estudio de movimientos en masa detonados por lluvias. Revista de La Academia Colombiana de Ciencias Exactas, Físicas y Naturales, 34(131), 209-227. [ Links ]
Arnold, J. G., Srinivasan, R., Muttiah, R. S. y Williams, J. R. (1998). Large area hydrologic modeling and assessment Part I: Model development. Journal of the American Water Resources Association, 34(1), 73-89. https://doi.org/10.1111/j.1752-1688.1998.tb05961.x [ Links ]
Barnes, R., Lehman, C. y Mulla, D. (2014). Priority-flood: An optimal depression-filling and watershed-labeling algorithm for digital elevation models. Computers and Geosciences, 62, 117-127. https://doi.org/10.1016/j.cageo.2013.04.024 [ Links ]
Bathurst, J. C., Moretti, G., El-Hames, A., Moaven-Hashemi, A. y Burton, A. (2005). Scenario modelling of basin-scale, shallow landslide sediment yield, Valsassina, Italian Southern Alps. Natural Hazards and Earth System Science, 5(2), 189-202. https://doi.org/10.5194/NHESS-5-189-2005 [ Links ]
Bischetti, G. B. y Chiaradia, E. A. (2010). Calibration of distributed shallow landslide models in forested landscapes. Journal of Agricultural Engineering, 41(3), 23-35. https://doi.org/10.4081/JAE.2010.3.23 [ Links ]
BM. (2022). Determine los peligros naturales en la zona de su proyecto y sepa cómo reducir su impacto. Desprendimientos de tierras, Chiapas, México. Landslide. Banco Mundial. https://thinkhazard.org/en/report/2032-mexico-chiapas/LS [ Links ]
Bruijnzeel, L. A. (2004). Hydrological functions of tropical forests: not seeing the soil for the trees? Agriculture, Ecosystems & Environment, 104(1), 185-228. https://doi.org/10.1016/J.AGEE.2004.01.015 [ Links ]
Brunsden, D. (2002). Geomorphological roulette for engineers and planners: Some insights into an old game. Quarterly Journal of Engineering Geology and Hydrogeology, 35(2), 101-142. https://doi.org/10.1144/1470-92362001-40 [ Links ]
Collins, B. D. y Znidarcic, D. (2005). Closure to “Stability Analyses of Rainfall-Induced Landslides” by Brian D. Collins and Dobroslav Znidarcic. Journal of Geotechnical and Geoenvironmental Engineering, 131(11), 1438-1438. https://doi.org/10.1061/(ASCE)1090-0241(2005)131:11(1438) [ Links ]
Crosta, G. B. y Frattini, P. (2003). Distributed modelling of shallow landslides triggered by intense rainfall. Natural Hazards and Earth System Sciences, 3(1/2), 81-93. [ Links ]
Cruden, D. M. (1991). A simple definition of a landslide. Bulletin of the International Association of Engineering Geology, 43. [ Links ]
Dahal, R. K., Hasegawa, S., Nonomura, A., Yamanaka, M., Masuda, T. y Nishino, K. (2008). GIS-based weights-of-evidence modelling of rainfall-induced landslides in small catchments for landslide susceptibility mapping. Environmental Geology, 54(2), 311-324. https://doi.org/10.1007/S00254-007-0818-3/TABLES/2 [ Links ]
Díaz, S. R., Cadena, E., Adame, S. y Dávila, N. (2020). Landslides in Mexico: their occurrence and social impact since 1935. Landslides, 17(2), 379-394. https://doi.org/10.1007/S10346-019-01285-6/FIGURES/7 [ Links ]
Fabbri, A. G., Chung, C. J. F., Cendrero, A. y Remondo, J. (2003). Is Prediction of Future Landslides Possible with a GIS? Natural Hazards 2003 30:3, 30(3), 487-503. https://doi.org/10.1023/B:NHAZ.0000007282.62071.75 [ Links ]
Guns, M. y Vanacker, V. (2013). Forest cover change trajectories and their impact on landslide occurrence in the tropical Andes. Environmental Earth Sciences, 70(7), 2941-2952. https://doi.org/10.1007/S12665-013-2352-9 [ Links ]
Hosmer, D. W. y Lemeshow, S. (2005). Assessing the Fit of the Model. Applied Logistic Regression, 143-202. https://doi.org/10.1002/0471722146.CH5 [ Links ]
Huabin, W., Gangjun, L., Weiya, X. y Gonghui, W. (2005). GIS-based landslide hazard assessment: An overview. Progress in Physical Geography, 29(4), 548-567). https://doi.org/10.1191/0309133305pp462ra [ Links ]
INEGI. (2006). Conjunto de datos vectorial edafológico (Serie II). Instituto Nacional de Estadística y Geografía. https://www.inegi.org.mx/temas/edafologia/ [ Links ]
INEGI. (2012). Continuo de Elevaciones Mexicano 3.0 (CEM 3.0). Instituto Nacional de Estadística y Geografía. https://www.inegi.org.mx/app/geo2/elevacionesmex/ [ Links ]
INEGI. (2017). Conjunto Nacional de Información de Uso del Suelo y Vegetación (Serie VI). Instituto Nacional de Estadística y Geografía. https://www.inegi.org.mx/temas/usosuelo/ [ Links ]
Iverson, R. M. (2000). Landslide triggering by rain infiltration. Water Resources Research, 36(7), 1897-1910. https://doi.org/10.1029/2000WR900090 [ Links ]
Keles, F. y Nefeslioglu, H. A. (2021). Infinite slope stability model and steady-state hydrology-based shallow landslide susceptibility evaluations: The Guneysu catchment area (Rize, Turkey). CATENA, 200, 105161. https://doi.org/10.1016/J.CATENA.2021.105161 [ Links ]
Larsen, M. C. (2008). Rainfall-triggered landslides, anthropogenic hazards, and mitigation strategies. Advances in Geosciences, 14, 147-153. https://doi.org/10.5194/ADGEO-14-147-2008 [ Links ]
Legorreta-Paulín, G., Alanís-Anaya, R. M., Arana-Salinas, L. y Aceves-Quesada, F. (2018). Evaluación de la eficiencia de predicción a deslizamientos usando un modelo cartográfico-hidrológico: Caso de estudio cuenca La Carbonera, flanco SE del Volcán Pico de Orizaba. Investigaciones Geograficas, 95. https://doi.org/10.14350/RIG.58387 [ Links ]
Lin, Q. y Wang, Y. (2018). Spatial and temporal analysis of a fatal landslide inventory in China from 1950 to 2016. Landslides, 15(12), 2357-2372. https://doi.org/10.1007/S10346-018-1037-6/FIGURES/8 [ Links ]
Michel, G. P., Goerl, R. F. y Kobiyama, M. (2015). Critical rainfall to trigger landslides in Cunha River basin, southern Brazil. Natural Hazards, 75(3), 2369-2384. https://doi.org/10.1007/s11069-014-1435-6 [ Links ]
Michel, G. P., Kobiyama, M. y Goerl, R. F. (2014). Comparative analysis of SHALSTAB and SINMAP for landslide susceptibility mapping in the Cunha River basin, southern Brazil. Journal of Soils and Sediments, 14(7), 1266-1277. https://doi.org/10.1007/S11368-014-0886-4 [ Links ]
Montgomery, D. R. y Dietrich, W. E. (1994). A physically based model for the topographic control on shallow landsliding. Water Resources Research , 30(4), 1153-1171. https://doi.org/10.1029/93WR02979 [ Links ]
Mora-Ortiz, R. S. y Rojas-González, E. (2012). Efecto de la saturación en el deslizamiento de talud en la comunidad San Juan de Grijalva, Chiapas. Ingeniería, Investigación y Tecnología, 13(1), 55-68. http://www.scielo.org.mx/scielo.php?script=sci_arttext&pid=S1405-77432012000100006&lng=es&nrm=iso&tlng=es [ Links ]
Moresi, F. V., Maesano, M., Collalti, A., Sidle, R. C., Matteucci, G. y Mugnozza, G. S. (2020). Mapping Landslide Prediction through a GIS-Based Model: A Case Study in a Catchment in Southern Italy. Geosciences, 10(8), 309. https://doi.org/10.3390/GEOSCIENCES10080309 [ Links ]
Murcia, H. F. y Macías, J. L. (2009). Registro geológico de inundaciones recurrentes e inundación del 4 de octubre de 2005 en la ciudad de Tapachula, Chiapas, México. Revista Mexicana de Ciencias Geológicas, 26(1), 1-17. [ Links ]
Nery, T. D. y Vieira, B. C. (2015). Susceptibility to shallow landslides in a drainage basin in the Serra do Mar, São Paulo, Brazil, predicted using the SINMAP mathematical model. Bulletin of Engineering Geology and the Environment, 74(2), 369-378. https://doi.org/10.1007/s10064-014-0622-8 [ Links ]
Neuhäuser, B., Damm, B. y Terhorst, B. (2012). GIS-based assessment of landslide susceptibility on the base of the Weights-of-Evidence model. Landslides , 9(4), 511-528. https://doi.org/10.1007/S10346-011-0305-5 [ Links ]
O’Loughlin, E. M. (1986). Prediction of Surface Saturation Zones in Natural Catchments by Topographic Analysis. Water Resources Research , 22(5), 794-804. https://doi.org/10.1029/WR022I005P00794 [ Links ]
Pack, R., Tarboton, D. y Goodwin, C. (1998). Terrain Stability Mapping with SINMAP, technical description and users guide for version 1.00. Civil and Environmental Engineering Faculty Publications. https://digitalcommons.usu.edu/cee_facpub/2582 [ Links ]
Pack, R., Tarboton, D., Goodwin, C. y Prasad, A. (2005). SINMAP 2.0 for ArcGIS - A Stability Index Approach to Terrain Stability Hazard Mapping, User’s Manual. Civil and Environmental Engineering Faculty Publications. https://digitalcommons.usu.edu/cee_facpub/12 [ Links ]
Pérez-Nieto, S., Arellano-Monterrosas, J. L., Ibáñez-Castillo, L. A. y Hernández-Saucedo, F. R. (2012). Estimación de la erosión hídrica provocada por el hueracán Stan en las cuencas costeras de Chiapas, México. Terra Latinoamericana, 30(2), 103-110. [ Links ]
Polemio, M. y Petrucci, O. (2000). Rainfall as a landslide triggering factor an overview of recent international research. http://hdl.handle.net/2122/7936 [ Links ]
Pradhan, A. M. S. y Kim, Y. T. (2015). Application and comparison of shallow landslide susceptibility models in weathered granite soil under extreme rainfall events. Environmental Earth Sciences , 73(9), 5761-5771. https://doi.org/10.1007/S12665-014-3829-X/FIGURES/8 [ Links ]
Ray, R. L., Jacobs, J. M. y Douglas, E. M. (2018). Modeling regional landslide susceptibility using dynamic soil moisture profiles. Journal of Mountain Science 2018 15:8, 15(8), 1807-1824. https://doi.org/10.1007/S11629-018-4896-3 [ Links ]
Revenga, C., Murray, S., Abramovitz, J., & Hammond, A. (1999). Watersheds of the world: Ecological value and vulnerability (First Edition). World Resources Institute. [ Links ]
Selby, M. J. (1993). Hillslope materials and processes (2nd edition). Oxford University Press. [ Links ]
Sengupta, A., Gupta, S. y Anbarasu, K. (2010). Rainfall thresholds for the initiation of landslide at Lanta Khola in north Sikkim, India. Natural Hazards, 52(1), 31-42. https://doi.org/10.1007/s11069-009-9352-9 [ Links ]
SGM. (1982). Carta Geológica de los Estados Unidos Mexicanos (Serie II). Servicio Geológico Mexicano. https://www.sgm.gob.mx/GeoInfoMexGobMx/ [ Links ]
SMN. (2022). Normales Climatológicas por estado. Servicio Meteorológico Nacional. https://smn.conagua.gob.mx/es/climatologia/informacion-climatologica/normales-climatologicas-por-estado [ Links ]
Survila, K., Yildirim, A. A., Li, T., Liu, Y. Y., Tarboton, D. G. y Wang, S. (2016). A scalable high-performance topographic flow direction algorithm for hydrological information analysis. ACM International Conference Proceeding Series. 17-21 de julio. https://doi.org/10.1145/2949550.2949571 [ Links ]
Swets, J. A. (1988). Measuring the Accuracy of Diagnostic Systems. Science, 240(4857), 1285-1293. https://doi.org/10.1126/SCIENCE.3287615 [ Links ]
Tarolli, P. y Tarboton, D. G. (2006). A new method for determination of most likely landslide initiation points and the evaluation of digital terrain model scale in terrain stability mapping. Hydrology and Earth System Sciences, 10(5), 663-677. https://doi.org/10.5194/HESS-10-663-2006 [ Links ]
Terlien, M. T. J. y Terlien, M. T. J. (1998). The determination of statistical and deterministic hydrological landslide-triggering thresholds. Environmental Geology, 35(2), 124-130. https://doi.org/10.1007/S002540050299 [ Links ]
Velescu, A. (2009). Heterogenität von bodenkundlichen Standortfaktoren in feucht-tropischen Gebirgslandschaften am Beispiel des Einzugsgebietes des Río Huehuetán (Chiapas, Mexiko). Tesis de maestría. Eberhard-Karls-Universität Tübingen. [ Links ]
Wang, G. y Sassa, K. (2003). Pore-pressure generation and movement of rainfall-induced landslides: effects of grain size and fine-particle content. Engineering Geology, 69(1-2), 109-125. https://doi.org/10.1016/S0013-7952(02)00268-5 [ Links ]
Wang, L. y Liu, H. (2006). An efficient method for identifying and filling surface depressions in digital elevation models for hydrologic analysis and modelling. International Journal of Geographical Information Science, 20(2), 193-213. https://doi.org/10.1080/13658810500433453 [ Links ]
Yilmaz, I. y Keskin, I. (2009). GIS based statistical and physical approaches to landslide susceptibility mapping (Sebinkarahisar, Turkey). Bulletin of Engineering Geology and the Environment 2009 68:4, 68(4), 459-471. https://doi.org/10.1007/S10064-009-0188-Z [ Links ]
Zhuang, J., Peng, J., Wang, G., Iqbal, J., Wang, Y., Li, W., Xu, Q. y Zhu, X. (2017). Prediction of rainfall-induced shallow landslides in the Loess Plateau, Yan’an, China, using the TRIGRS model. Earth Surface Processes and Landforms, 42(6), 915-927. https://doi.org/10.1002/esp.4050 [ Links ]
Zúñiga, E. y Magaña, V. (2018). Vulnerability and risk to intense rainfall in Mexico: The effect of land use cover change. Investigaciones Geograficas , 95. https://doi.org/10.14350/rig.59465 [ Links ]
Received: June 08, 2022; Accepted: August 10, 2022; Published: October 11, 2022
 Este es un artículo publicado en acceso abierto bajo una licencia Creative Commons
