


 nueva página del texto (beta)
 Inglés (pdf)
 Artículo en XML
 Referencias del artículo
 Enviar artículo por email
 Citado por SciELO
  Similares en
SciELO
Similares en
SciELO 
 Permalink
INTRODUCTION
The number of hydro-meteorological disasters associated with extreme precipitation is increasing around the world in recent decades, particularly since the 1980s (Hoeppe, 2016; Kashyap and Mahanta, 2018, Zúñiga et al, 2018). This trend has been frequently associated with global climate change (Hettiarachchi, et al 2018), but some uncertainties on the main processes that contribute to more floods remain (IPCC, 2021). More intense rainfall events and floods in large metropolitan areas are affecting millions of people every year, and this will continue in the coming decades given the tendency for more people to live in urban environments (Kang et al, 2021). To examine the increasing number of urban flash floods one should consider not only climatic trends, but also land use changes and other factors that have made these regions more vulnerable to intense rains (Chang, H. and Franczyk, J., 2008; Rahman, et. al. 2016). The lack of urban development plans or new investments to improve hydraulic infrastructure are among the factors that increase the risks of flash floods (Park and Lee 2019). As the city grows, the permeable soil is replaced by impermeable surfaces such as roads, roofs, parking lots, and sidewalks that store little water, reduce infiltration of runoffs, and accelerate storm water flows to ditches and streams (USGS, 2003). Therefore, the increased risk of floods largely depends on the development process of the cities themselves (Kundzewicz, et al, 2014).
Most cities around the world have strong UHIs and are experiencing more severe storms given that urbanization modulates surface heat and moisture transfer processes in the planetary boundary layer (PBL) (Song et al, 2018). A strong UHI affects surface temperature and moisture convergence over the urban zone, reducing the atmospheric stability and increasing the chances of storm formation (Zhang et al, 2017). Land use/land cover (LULC) changes and urbanization affect regional weather and climate (Pielke and Niyogi 2009), as well as the thunderstorm activity because of land surface heterogeneity (Liu and Niyogi 2019). In this way, the UHI tends to augment the magnitude of the meteorological hazards, such as intense storms, a key component of the risk of floods in urban environments.
A closer look at the rapid demographic and urban growth shows that large cities not only expose more people to intense hydro meteorological hazards but also, contribute to their vulnerability (Niyogi et. al., 2011; Zúñiga and Magaña 2018). In most metropolitan areas of Mexico, urban floods are a recurrent problem during the rainy season. The drainage infrastructure, mostly built in the 1950s - 1970s, is now insufficient to control storm water runoffs. The various efforts of government agencies to reduce such problem have mostly focused on more hydraulic infrastructure where floods occur but so far, this approach has not been successful as the number of flood reports increases year after year (Eakin and Appendini 2008). Almost 80% of Mexicans are expected to live in urban settlements and large cities in the next two decades. So, even when the metropolitan areas offer better standards of living compared to most rural areas, the increasing risk of hydro-meteorological disasters will constitute a drawback, for those in the periphery and even in the central, more consolidated parts of the city. Identifying the main causes of a larger number of hydro-meteorological disasters in Mexican cities requires characterizing the factors that induce local climate changes and the elements that are making them highly vulnerable to intense storms.
The GMA, in the state of Jalisco in western Mexico, faces the challenge of providing urban services to a rapidly growing population. Like most large cities in Mexico, the GMA grew explosively during the second half of the twentieth century (Monkkonena et al, 2017). The urban population of the GMA increased from around 500,000 people in the early 1950s to almost 5 million people in 2020, which makes it the third most populated city in Mexico (INEGI, 2021). The largest rate of demographic and urban growth took place mainly in the 1970s and 1980s. However, the limited planning during this period resulted not only in an UHI and the reduction of human thermal comfort, but also in more vulnerability to intense rains and urban flash floods (Felix, 2005).
Hernandez-Uribe et al (2017) examined the case of the Atemajac river, in the GMA, and determined the most vulnerable regions to intense rains, water overflow and floods were along the riverbanks. However, in the GMA floods are not confined to the Atemajac riverbanks but are scattered over most of the low-level parts of the urban zone. Even more, the Atemajac river nowadays is hardly a natural flow of water since it has been channeled or modified at various parts of its path. As in most large cities in Mexico, rivers in the GMA have been channeled or piped, and are no longer draining in a natural way. At present, city roads in the GMA frequently act as water channels that connect adjacent hydrological basins, which makes the storm runoff to converge into the central low-level parts of the city, where most floods occur. Therefore, in addition to the observed changes in storm activity, a more comprehensive analysis of urban floods in the GMA requires considering the infrastructure elements that have changed the natural hydrological flows.
This study presents a relatively straightforward approach to show estimate the risk of floods, considering the role of urbanization that results in an UHI that enhances the hydrological cycle and increases vulnerability to intense rains. By means of data and methodologies frequently available, it is shown that hydrological basin degradation, larger runoffs, reduced infiltration capacity in the urban zone and urban expansion are dynamic factors that contribute to higher risk and more urban floods in recent years. Rainfall - runoff estimates serve to determine the risk of flash floods by combining hazard (storms of more than 20 mm/hr) and vulnerability factors, and to rank probabilities of a negative impact, ie., risk of urban flash floods. The proposed method may also serve to propose risk management strategies and adaptation to climate change actions for the near future.
The main objective of the present study is to show how urban expansion in the GMA simultaneously contributes to increasing meteorological hazard (intense rains) and to augment vulnerability. The paper is divided in the following manner. Section 1 corresponds to the Introduction of the problem. Section 2 describes data and methodology. Results are shown in section 3, while summary and conclusions are given in section 4.
DATA AND METHODOLOGY
Estimating meteorological risks requires a characterization of the natural hazard and vulnerability factors. In this analysis, the natural hazard corresponds to the probability of intense storms of more than 20 mm/day. The domain of interest corresponds to the GMA located in the state of Jalisco, in western Mexico (Fig. 1). It is defined as a group of municipalities, with an urban zone located in its central part. By the end of the twentieth century, the GMA total area was 3265.5 km2 and the urban zone had an area of around 1327.5 km2. Most of the hydrological sub-basins drain to the Huentitan canyon, in the northern part of the GMA. The urban zone is in the central part of the GMA at the lowest elevation zone.
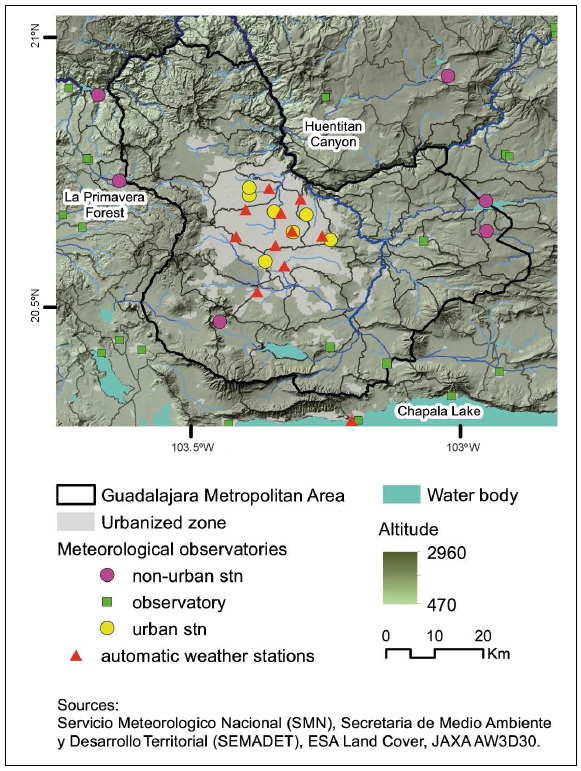
Figure 1 The Guadalajara Metropolitan Area (GMA) in the western part of Mexico (black thick contour), the urbanized zone in its central part (light gray) and the location of automatic weather stations (red triangles) and the meteorological observatories (green squares and circles). Yellow and pink circles correspond to urban and nonurban weather stations. Shades of gray denote topography and black and blue thin solid lines denote sub-basins and streams, respectively
Intense precipitation activity over this region may be characterized with reports of accumulated daily precipitation, since this is almost equivalent to using hourly reports given that most precipitation events correspond to short period convective storms that occur in less than one hour (Fig. 2). Considering precipitation events of more than 20 mm/day and using the ten minutes precipitation rates records at the Guadalajara Automatic Weather Station (20.70638N, 103.39222W) for the 2000 - 2012 period (CONAGUA 2020), it is observed that storms usually last less than one hour, i.e, hazardous events of more than 20 mm/hour are almost equivalent to reports of more than 20 mm/day. Daily precipitation data for the 1960-2018 period serve to characterize intense precipitation activity over the GMA.
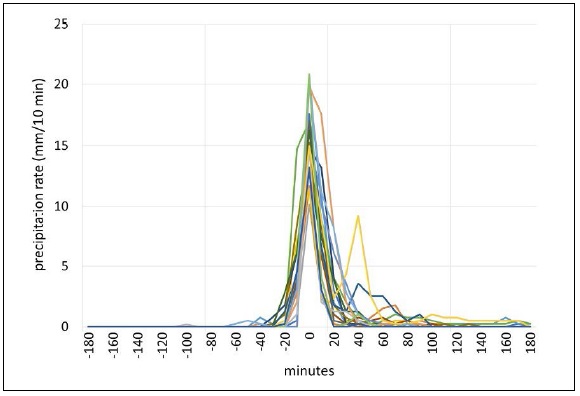
Figure 2 Precipitation rates (mm/10 minutes) for storms of more than 20 mm/day in the GMA between 2000 and 2012 at the Guadalajara automated weather station.
Storms with 20 mm/day precipitation or more (equivalent to 20 mm/hr or more) are considered a threshold value that may result in urban floods. Other statistics used to characterize the long-term evolution of extreme precipitation activity are the 90% and 95% percentiles of daily precipitation along with the annual number of events of more than 30 mm/day reported in observatories. This information is used to examine the role of the UHI as the most important form of climate change at the local level.
Daily reports of precipitation and maximum surface temperature for the GMA are used to document the process of climate change associated with the formation of an UHI. These data were obtained from around 40 surface weather stations from the network of weather stations managed by the Mexican Weather Service (CONAGUA, 2020) over the domain of interest during the 1950-2020 period. There are at least 20 weather stations measuring over the urban zone and periphery of the GMA, including an automated weather station since the year 2000.
The data from these weather stations were objectively analyzed and interpolated to obtain daily grids of 4km X 4km spatial resolution, using a successive correction scheme (Cressman, 1959). Interpolated surface temperature data from interpolated North American Regional Reanalysis (NARR) data were used as preliminary (first guess) fields. For precipitation, a zero-precipitation field was used as initial guess. The daily objectively analyzed gridded fields of maximum temperature and precipitation span for the 1950-2018 period. The quality of such fields was determined by comparing pixel values with data from nearby weather stations (not shown). The correlation between these time series was usually above 0.8 for most weather stations. The METAR data from the Guadalajara airport weather station was considered as an independent reference data to obtain information on specific humidity and temperature, and to validate meteorological fields from reanalysis. The METAR data were obtained from the ASOS/AWOS Global METAR Archives of the Iowa State University (2020) and complement upper-level meteorological data from the Guadalajara airport radiosonde. Precipitable water, Convective Available Potential Energy (CAPE) and Convection Inhibition Index (CIN) data for the 1990-2020 period are used to document the effects of the UHI in changes in the hazard. These data are available at the Integrated Global Radiosonde Archive (IGRA) derived variables Version 2 (Durre et al, 2016).
Data from the NCEP/NCAR Reanalysis for the 1948-2020 period are also used to examine meteorological trends of temperature and humidity in the lower tropospheric levels (PBL) associated with the UHI. The reliability of such data is determined by comparing them with the atmospheric soundings at the Guadalajara airport.
The vulnerability to intense precipitation is estimated by means of data (indicators) on the physical (steady) and environmental (dynamic) factors that affect runoff or infiltration. We acknowledge that there is no universally accepted methodology to represent vulnerability to extreme meteorological events but, whatever the approach is, the resulting estimate of risk should describe part of the spatial and temporal characteristics of a disaster (Zúñiga and Magaña 2018). Vulnerability expressed in terms of exposure, susceptibility, and adaptive capacity, or may be in terms of physical environmental, social, and economic factors. There are numerous reviews on what floods vulnerability and vulnerability to intense rains means, but each has some advantages and limitations (Birkmann & Wisner, 2006; NEMO, 2018; Rehman et al., 2019).
Vulnerability to intense rains is related to orographic factors that may be considered its steady component. High spatial resolution data on the topography over the domain of interest was obtained from the JAXA Digital Surface Model (DSM) with 30 m X 30 m horizontal spatial resolution (Takaku et al, 2020). The DSM is used to represent vulnerability by means of the so-called topographic wetness index (TWI) (Neteler and Mitasova, 2008), which combines heights and slopes that make a region prone to experience floods (Beven, K.J. and Kirkby, M. J. 1979). In this study, the TWI may be considered the steady part of the vulnerability and is evaluated by means of the slope and the upstream contributing area per unit width, orthogonal to the flow direction using:
where, A = is the contribution area (m) (number of pixels that drain to a single pixel per unit width), and 𝛽 is the angle of the slope (degrees). The effect of roads, acting as water channels from the higher elevation to lower elevation basins, was estimated and added as part of the steady vulnerability factor in the GMA.
The dynamical part of vulnerability refers to the environmental factors that change on longer time scales. The most important ones have to do with land use changes and the capacity of the hydraulic infrastructure. Data on land use of the region are from the (Mexican) National Institute of Geography and Statistics (INEGI, 2017). These data are derived from satellite images with high spatial resolution (30 m x 30 m), that served to characterize the urban expansion of the GMA since the 1980s. Information on changes of the vegetation corresponds to the MODIS-Enhanced Vegetation Index (EVI) (Huete et al, 2002) for the 2000-2020 period. The EVI data have a spatial resolution of 250 m x 250 m and are obtained from the International Research Institute for Climate and Society (IRI) archives (IRI/LDEO Climate Data Library, 2013).
The HEC - HMS routines (Feldman, 2000) serve to simulate the hydrology of highly developed urban watersheds. It allows to quantify the effects of land use changes that result in increased water runoff, water accumulation and floods. The rainfall-runoff routines to examine changes in the infiltration (curve number) make use of land use data from the INEGI (2017) archive for recent decades. The infiltration coefficients in the urban zone vary from one region to another depending on the characteristics of urbanization and the existing hydraulic infrastructure. An estimate of capacity of the drainage network system in the GMA (Sanchez, 2019) served to include the contribution of this vulnerability factor to the total vulnerability of the zone. The steady and dynamical vulnerability factors were normalized between 0 and 1 and averaged to obtain a vulnerability index for every pixel in the domain. The product of the probability of rains above 20 mm/day (natural hazard) and the vulnerability index result in risk of urban flood estimates.
In the present study, the activity of urban flash floods in recent decades is associated with the impacts. There is no attempt to deterministically simulate the magnitude of the disasters in terms of the depth of the urban floods, but only its activity (number of reports of floods) and its changes in recent decades. Various experiments were conducted to examine how the urban expansion in the GMA has increased vulnerability and the risk of floods. The scheme was also used to estimate the impact of some “climate change adaptation” measures that may reduce vulnerability and chances of flash floods.
The flood reports data base used to evaluate the risk of flash floods, include the locus of the events and an estimate of its magnitude, in terms of the maximum depth of accumulated water. The quality of the risk of flood model is determined by comparing the probabilities of risk with the number of urban floods (activity) in the GMA. An empirical scenario of urban development in the GMA served to project how the risk of floods may change in the coming years under urban expansion with and without adaptation measures.
RESULTS
The Urban Heat Island (UHI) of the GMA
The explosive demographic growth in the GMA led to a significant urban expansion and land use changes that have altered the local climate and the hydrological properties of the zone. Its largest rate of urbanization, in the central part of the GMA, began in the 1980s and has continued since then. The natural vegetation of the surrounding zone has been transformed to agricultural fields, mainly over the northeastern part of the GMA. The growth of the urban zone augments the catchment area with reduced infiltration capacity over the various sub-basins. The main roads in the metropolitan area converge to the central (lower) part of the urbanization and frequently act as water channels from the higher to lower elevations.
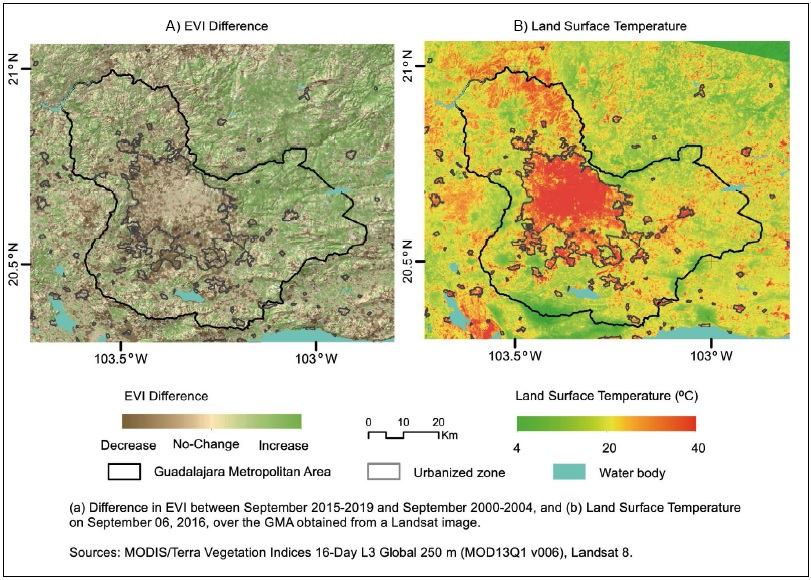
The urbanization and the expansion of the agricultural frontier meant depletion of natural vegetation and landscape transformations within the city and the surroundings. For instance, between the periods 2000-2004 and 2015-2019, the GMA lost a large amount of vegetation due to new human settlements over the periphery of the urban zone (Fig. 4A). The Enhanced Vegetation Index (EVI) indicates that the urban growth has reduced “the green infrastructure” even within the central parts of the city. The new settlements in the periphery transformed more than 68% of the existing vegetation into concrete. In the La Primavera Forest (103º35'- 103º28' W, 20º37'- 20º45'N), a natural protected area west of the GMA, the natural vegetation has also diminished under the pressure of nearby urban developments. The increase in EVI, in the northwestern part of the GMA, corresponds to agricultural fields that replaced natural vegetation. Such changes in the landscape have altered the thermal and hydrological properties of the region, since the dominance of concrete and other construction materials has resulted in larger maximum land surface temperature compared over the city, to the surroundings (Fig. 4B), that clearly show the existence of an UHI.
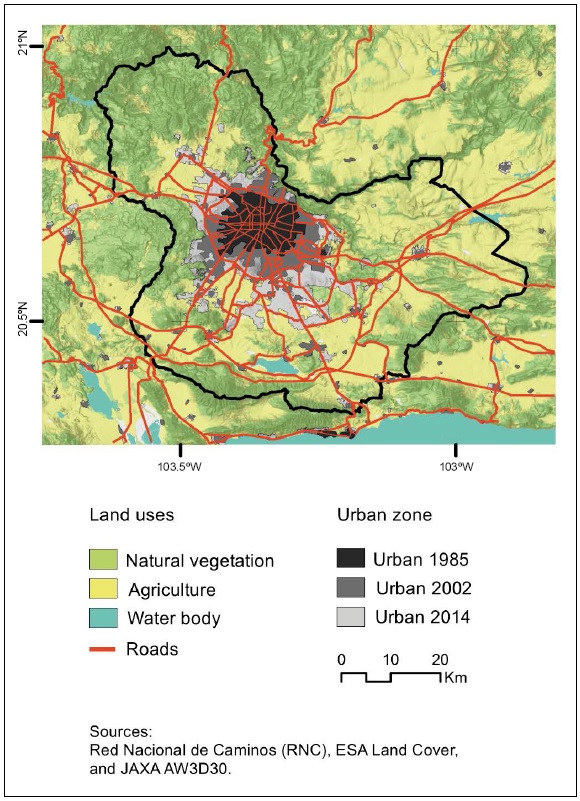
(Data source, INEGI 2017)
Figure 3 Main land uses and roads (red lines) over the GMA. The gray areas correspond to the urban zone in 1985, 2002 and 2014.
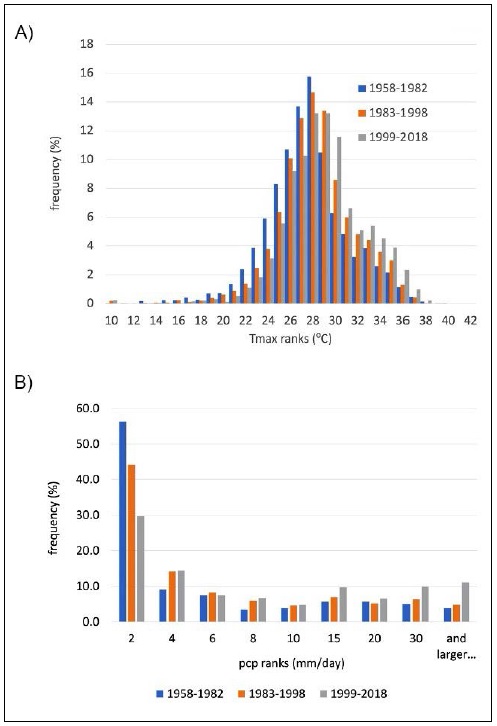
Figure 4 Histograms for (A) daily maximum temperature (ºC) and (B) daily precipitation (mm/day), in the Central Observatory of Guadalajara, Mexico, for three consecutive periods: 1958-1982 (blue), 1983-1998 (orange) and 1999-2020 (gray). )
The mean surface air maximum temperature has increased in about 2ºC in 50 years in relation to the urban growth of the GMA. This may be observed by means of a histogram of daily maximum temperature from the Guadalajara Meteorological Observatory (Fig. 5A), in the center of the city. The very warm conditions (Tmax > 35ºC) have become more frequent in recent decades since the probabilities for these events have changed, from around 4% in the 1950s to almost 8% in recent years. Extreme maximum temperatures are more frequent between March and June, but they remain relatively high (above 30ºC) even during most of the rainy season, between June and September. Along with the increase in temperature, there is a tendency for more intense precipitation events, particularly those of more than 20 mm/day (Fig. 5B), that appear to be part of the UHI signals.
Changes in the hazard of intense convective activity over the GMA
Several studies indicate that the existence of an UHI affects the activity of storms in an urban environment (Liu and Niyogi, 2019). In urban zones, severe storms may become more frequent due to a change in atmospheric stability (Zhang et al 2017), an increase in tropospheric moisture (Trenberth et al 2003), or changes in the surface roughness that affect heat and moisture fluxes near the surface (Cao and Lin 2014). These factors have changed in the GMA and appear to be resulting in stronger convective activity since the 1980s. For instance, events of precipitation of more than 30 mm/day recorded in urban weather stations (yellow circles in Fig. 1) are now almost twice as frequent than they used to be 40 or 50 years ago (Fig. 6A), changing from around 6 (between 1960-1980) to around 12 (between 2000-2018). However, in nonurban weather stations, over the periphery of the city (denoted with pink circles in Fig. 1), the tendency to more intense precipitation is weak, with around 5 events per year in the 1960s, to around 7 events in recent years (Fig. 6B). The altered surface conditions affect the precipitation regime as the atmospheric stability and moisture change, increasing the hazard of intense precipitation at the local level.
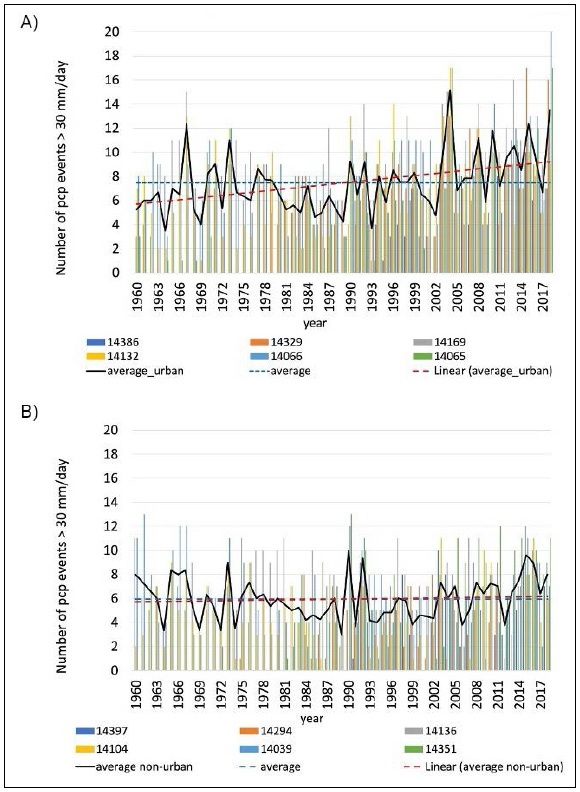
Figure 6 Number of events of precipitation of more than 30 mm/day (colored bars) registered between 1960 and 2018 in weather stations in (A) urban weather stations and (B) in nonurban weather stations. The solid black line corresponds to the average number of intense precipitation events in the urban and nonurban zones.
The observed change in the precipitation extremes activity may also be diagnosed by means of the temporal evolution of the 90% and 95% percentiles of daily precipitation. It is observed that in almost all the sites of the GMA, the value of the 90% and 95% percentiles has increased (Table 1). The 90% percentile in daily precipitation is nowadays more than 30 mm/days over most weather stations of the urban zone.
Table 1 Precipitation (mm/days) percentiles (90% and 95%) in various stations in the GMA for the 1950-1972, 1973-1995 and 1996-2018 periods. Values higher than 30 mm/day are indicated in bold font.
| Weather Stations in the GMA | Precipitation percentiles 90% and 95% (mm/day) | ||||||||
| 1950 - 1972 | 1973 - 1995 | 1996 -2018 | |||||||
| Name | ID | Longitude | Latitude | 90% | 95% | 90% | 95% | 90% | 95% |
| Zapopan | 14169 | -103.392 | 20.720 | 25.9 | 37.5 | 28.5 | 40 | 33.2 | 42.5 |
| Guadalajara Observatory |
14065 | -103.392 | 20.706 | 22 | 32.1 | 29.4 | 37.9 | 30.6 | 40.3 |
| Guadalajara DGE | 14066 | -103.346 | 20.676 | 25.5 | 39.2 | 27.5 | 35.8 | 31.5 | 40.3 |
| La Experiencia | 14329 | -103.286 | 20.670 | 25.5 | 34.7 | 29.2 | 40 | ||
| Tlaquepaque | 14132 | -103.311 | 20.638 | 24 | 32 | 28.2 | 38 | 30.5 | 40.5 |
| Tlajomulco de Zúñiga |
14294 | -103.447 | 20.473 | 24 | 30 | 33.5 | 40.3 | ||
| Ixtlahuacán del Río | 14073 | -103.250 | 20.889 | 24 | 33 | 26 | 35 | 27 | 35.5 |
| Cuixtla | 14038 | -103.439 | 21.052 | 25 | 33.1 | 27 | 35 | 26.1 | 36.3 |
| Zapotlanejo | 14388 | -103.068 | 20.622 | 26.8 | 34 | 25.9 | 33.6 | ||
| Santa Rosa | 14136 | -103.726 | 20.906 | 30.4 | 34.5 | 27.8 | 37.2 | 27.9 | 37.8 |
1 Data Availability Statement
The datasets Analyzed for this study can be found in:
• The Mexican Weather Service (SMN): https://smn.conagua.gob.mx/es, accessed on 20 March 2020.
• Jalisco Ministry of Environment and Territory (SEMADET) http://siga.jalisco.gob.mx/aireysalud/descargas2020 , accessed on 20 March 2020
• IRI/LDEO Climate Data Library. http://iridl.ldeo.columbia.edu accessed on July 2, 2021.
• National Institute of Statistic and Geography (INEGI).(2017) https://www.inegi.org.mx/, accessed on 20 March 2020
• National Institute of Statistic and Geography (INEGI). (2021). Population and Housing Census. https://www.inegi.org.mx/programas/ccpv/2020/default.html [Accessed July 15, 2021]
• Advanced Land Observing Satellite. https://www.eorc.jaxa.jp/ALOS/a/en/index_e.htm, accessed on 20 March 2020
• The METAR data are from the ASOS/AWOS Global METAR Archives of the Iowa State University (2020). https://mesonet.agron.iastate.edu/request/download.phtml, accessed on 20 March 2020
Regional extreme weather activity may be examined through the evolution of various atmospheric parameters that may be examined for recent decades based on various data sources such as: i) the NCEP/NCAR Reanalysis (Kalnay et al, 1996) which represent meteorological conditions for a long period (1950-2020), ii) the surface temperature and precipitation fields obtained from the objective analysis of a high-density network of weather stations in the GMA for the 1950-2018 period, or iii) weather station records, such as those from the atmospheric sounding and the METAR data from the Guadalajara Airport. The mean 850 hPa atmospheric level over the GMA is at 1551 masl, close to the mean altitude of the Guadalajara airport at 1529 masl. Meteorological data at 850 hPa may be used as a reference to examine the atmospheric conditions near the surface, in the PBL. The mean 850 hPa air temperature (T 850 hPa) for the June - September period, in a pixel over the GMA, shows a tendency to increase in around 2ºC in fifty years (Fig. 7A). Its low frequency variations are coherent with those observed in the objective analyses of surface temperature averaged over the GMA. Both sources of temperature data show that the long-term warming of the GMA began in the 1980s and continues until now. This trend of temperature is also present in the mean surface temperature data at the Guadalajara airport (METAR) for the 2000-2020 period.
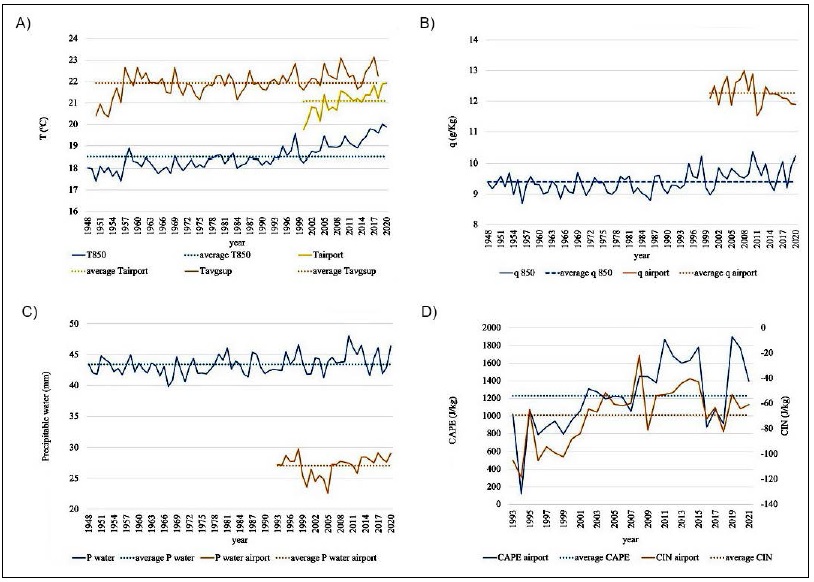
Figure 7 Time series of mean summer (June - September) atmospheric conditions over the GMA. (A) temperature at 850 hPa (blue line), surface temperature spatially averaged over the GMA based on objectively analyzed data from surface stations (red line) and surface temperature data at the Guadalajara airport (dotted blue line), (B) NCEP/NCAR specific humidity, q, at 850hPa (blue line) and surface specific humidity at the Guadalajara airport (blue dotted line), (C) NCEP/NCAR precipitable water (blue line) and precipitable water over the Guadalajara airport based on sounding data from surface to 500 hPa (orange line), and (D) CAPE (blue line) and CIN (orange line) over the Guadalajara airport. The dotted lines correspond to the average value of the variable.
The mean specific humidity, at 850 hPa for June - September over the GMA, also exhibits a positive tendency after the early 1980s, which appears to stop after the 2010 (Fig. 7B). This signal is also present in data of surface specific humidity at the airport station for the 2000-2020 period. At upper atmospheric levels over the GMA, moisture is increasing. The reanalyzes of precipitable water in the entire troposphere indicate a change from around 42 mm in the 1950s to 45 mm in recent years (Fig. 7C). An estimate of precipitable water based on the Guadalajara airport sounding, from surface to 500 hPa shows an increase close to 5 mm for the 1990-2020 period. In summary, temperature and moisture over the GMA have increased over the GMA PBL in recent decades, mainly due to the effect of an UHI that is continuously strengthening.
The rapid urban development of the GMA and its UHI correspond to atmospheric conditions (higher surface temperature and more surface and upper-level humidity) that result in reduced atmospheric stability. These changes in the PBL increase the probabilities of strong storms and may be expressed in terms of the Convective Available Potential Energy (CAPE), which is directly related to the maximum potential vertical speed within an updraft. Higher values of CAPE (more than 2000 J/kg) indicate greater potential for severe weather (Barry and Chorley, 1980). However, as with other indices, there are no exact threshold values of CAPE above which severe weather becomes imminent. CAPE increases mainly because of more low-level specific humidity and temperature, which lead to more latent heating and buoyancy for a lifted parcel above the level of free convection (Chen et al 2020). On the other hand, the Convection Inhibition Index (CIN), a measure of the amount of energy that may prevent an air parcel from rising from the surface to the level of free convection, is decreasing. CIN may also be used as a parameter to diagnose the chances of intense storms, as it is approximately the opposite of CAPE. Large (low) negative values of CIN indicate unfavorable (favorable) conditions for intense atmospheric convection. In recent decades, at the Guadalajara airport, the summer mean values of CAPE are on the rise (Fig. 7D), approaching the threshold of 2000 J/kg, while the CIN values are decreasing. This indicates more probabilities of intense storms in recent decades during the summer months.
Precipitation activity (days with precipitation above 20 mm/day) is adequately captured in the objectively analyzed fields, which allows to estimate the spatial precipitation pattern that results in floods. Spatially, precipitation tends to be more intense in the northwestern-central part of the GMA. The composite pattern of daily precipitation events of more than 20 mm/day is located over the urban zone of the GMA (Fig. 8). By means of an Empirical Orthogonal Function analysis for summer daily precipitation, it was determined such spatial pattern has a probability of around 6% to occur during summer, which may be considered the probability of the threshold value for the critical hazard for the 2000-2018 period. If the estimate of occurrence of such pattern is calculated for the 2000-2009 period only, the hazard is around 5%. If such calculation is also performed for the 2010-2018 period, the probability of intense storms with such pattern is 7%. In summary, the increase in the hazard that results in a higher risk of floods in the GMA is mainly related to the urbanization process that enhances the UHI and the local hydrological cycle.

Flash floods and vulnerability of the GMA to intense rains
The location of most of the urban floods occur in relation to the topographic features of the zone. In the decade 2009-2019, the number of floods almost doubled with respect to the previous decade 2000-2009. This is related to the increase in the intense precipitation events, but also due to higher vulnerability associated with urban expansion. The reduction in the infiltration capacity of a larger urban area, the limited drainage network for more storm water and the effect of roads that converge to the central low-level flat parts of the urbanization have made the city more vulnerable to intense rains. The runoff between the 1990s (10 hm3 for a 20 mm/hr event) and the 2010s (21 hm3 for a 20 mm/hr event) almost doubled because of the city growth.
Most of the floods occur in the flat and low-elevation areas are in the central part of the GMA. The dominant directions of the flow in the central part of the domain are from south to north and from west to east, converging to the central part of the GMA, where the urban zone is. In the central western part of the city the dominant water runoff converges into a relatively low-level flat terrain, south of the Huentitan Canyon, where water flow slows down and accumulates. Therefore, landforms of the zone (slopes) constitute the main steady vulnerability factor that determined the risk of floods.
The Soil Conservation Service Curve Number method (SCS-CN) is a simple and widely used method to determine the amount of water runoff from a precipitation event in each area (basin) that contributes to the occurrence of floods. The SCS-CN method is used in non-instrumented watersheds, such as the GMA watersheds, for the rapid evaluation of runoff and estimates of the probability of disaster events due to heavy rains (Hong and Adler, 2008). In addition to the rainfall data, the SCS-CN uses the curve numbers (CN) and the morphometric characteristics of the basin (Vojtek and Vojteková, 2019). The CN is obtained by combining the effect of a hydrological group of soil types and the hydrological condition of the vegetation and land uses. Morphometry for the region is derived from topographic data.
The TWI and the CN over the GMA allow to estimate the evolution of the total vulnerability to intense rains, considering the reduction of permeability in the urban zone and in the periphery, as in the eastern part of La Primavera Forest, where the decrease of natural vegetation also results in higher vulnerability for the urban zone. The total vulnerability values were normalized and ranked between 1 (very low) and 5 (very high). In this way, the urban expansion between the 1990s and the 2010s resulted in a change in vulnerability, from low-medium (2-3) to medium-high (3-4) in the central part of the GMA (Fig. 9).
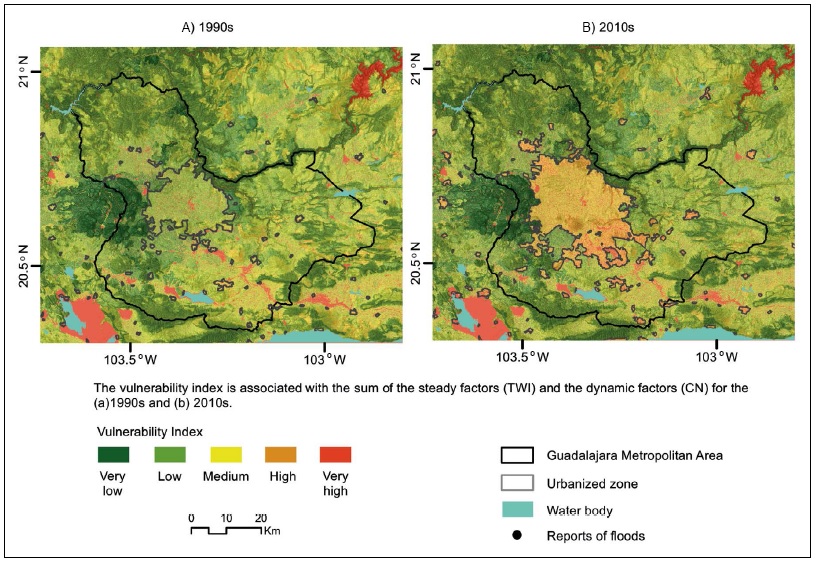
Figure 9 Total vulnerability associated with the sum of the steady factors (TWI) and the dynamic factors (CN) for the (A)1990s and (B) 2010s (see text for details).
In this way, the characterization of the total vulnerability is multifactorial and dynamic, and when combined with information on the natural hazard (probability of intense rains) it provides information on the risk of floods, whose changes in time should explain the trends in the number of such disaster over the GMA in recent decades.
The risk of flash floods in the GMA
The risk of urban flash floods is obtained by combining the probabilities of precipitation of more than 20 mm/day in the central part of the GMA with the total vulnerability index (Fig. 9). The risk is ranked between very low and very high. As a result of the increases in vulnerability and in the hazard of intense rains, the risk of floods in the urban zone increased between the 1990s (Fig. 10A) and the 2010s (Fig. 10B). Using the product of hazard X vulnerability, the risk of flash floods changes from medium-high (5% X 3-4) ~ 15-20% to high-very high (7% X 4-5) ~ 28-35%.
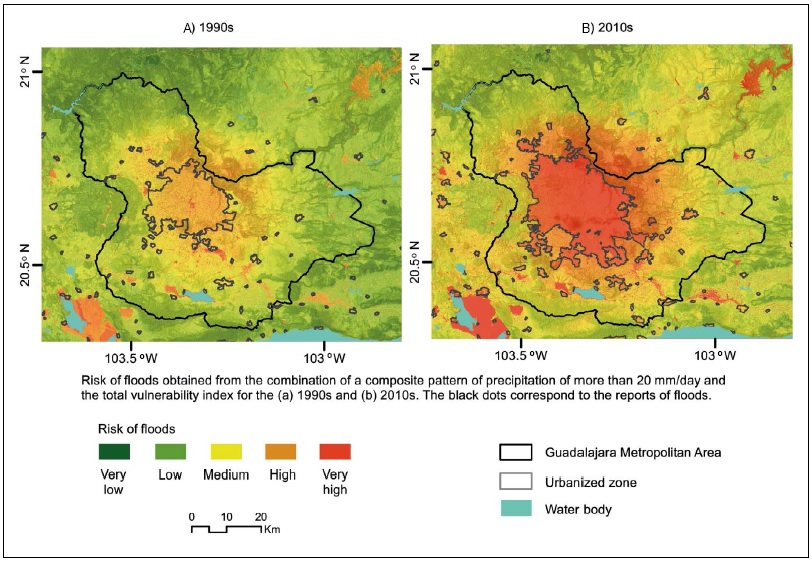
Figura 10 Risk of floods obtained from the combination of a composite pattern of precipitation of more than 20 mm/day in the central part of the GMA and the total vulnerability index for the (A) 1990s and (B) 2010s.
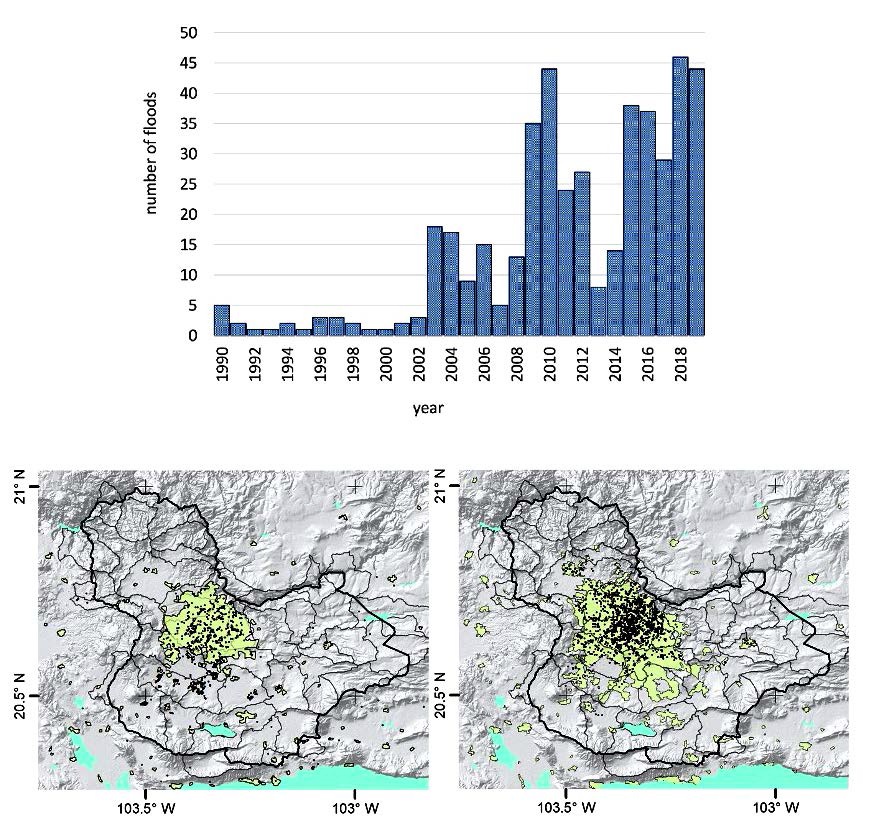
The number of urban flash floods over the central part of the GMA has changed since the 1980s, but the more rapid increase in frequency occurs after the year 2000 (Fig. 11A). The number of flood reports between 2000 and 2010 was approximately between 10 and 15 per year. Between 2010 and 2018, the number of flood reports was approximately between 20 to 40. Given the number of rainy days during summer in the GMA has remained between 80 to 100, the potential number of floods estimated through the risk quantification has changed from 12 - 20 to 22 - 35 events, which is of the order of magnitude of the observed changes in the number of reports of flash floods in the GMA in recent decades (Fig. 11B and 11C). Risk values above the medium value may be considered intolerable when the critical threshold of risk is above 20%. This is certainly an arbitrary value of critical risk, since it would be more adequate to have for instance, less than 5% probabilities of flash flood events, i.e. low risk, but the costs of reaching such level may be high.
Flash flood risk management
In order to remedy or at least, reduce the problem of flash floods in the GMA, it is necessary to consider a number of adaptation measures. The recovery of the infiltration capacity of the GMA is necessary to reduce the risk of urban floods and consequently, the number of hydro-meteorological disasters. For instance, climate risk scenarios based on urban expansion projections for 2030 allow to compare a “business as usual” city growth scenario (Fig. 12A), with one in which urban planning and mitigation works are implemented (Fig. 12B). In the business-as-usual scenario, the urban expansion continues and results in less infiltration capacity increasing the urban catchment area under risk of floods (high to very high risk of floods). When urban planning and adaptation measures are considered to recover part of the infiltration capacity of the zone, the risk of floods decreases to medium levels. The proposed adaptation measures for this purpose include around 40 absorption wells in some parts of the urban zone, and an increase of 10% in the capacity of the drainage system, which has not been significantly modified for about 50 years and is now insufficient to transport the increased amount of the storm water runoff over the central urban zone. So, even if the city growth continues, the implementation of some adaptation measures could lower the risk of floods to medium (acceptable) levels (Fig. 12B). Even more, there are strategies to reduce the intensity of the UHI and possibly, the intensity or frequency of the intense storms (Gunawardena et al., 2017). This factor would contribute to reducing the hazard and also the risk of flash floods. The recovery of the green infrastructure through an urban reforestation program could have co-benefits in term of human comfort in the city, by reducing extreme maximum temperatures and possibly, the chances of intense storms over the urban zone.

SUMMARY AND CONCLUSIONS
The number of flash floods in the GMA has significantly increased in recent decades. Urbanization and the resulting UHI have altered the local climate (more hazards) and the climatic vulnerability of the city. Storms (precipitation above 20 mm/day) are now more frequent than in the 1980s, making the hazard larger than a few decades ago. On the other hand, the vulnerability of the GMA to intense rains has also increased given the land use changes, the limited capacity of the drainage network system and the water channel effect of roads. The very high levels of risk of flash floods in recent years make the GMA to expect more than 30 events of flood of various magnitudes every rainy season. The identification of the risk factors has served to find the main causes for more floods during the rainy season in the GMA and, opens the possibility of defining actions as part of a risk management plan. Most of the increase in the number of floods is associated with the increase in vulnerability.
The municipal program for adaptation to climate change should consider quantitative diagnoses of risk under various scenarios, in order to have estimates of the number of works that should be implemented to reduce the flood activity to “acceptable” levels. Through a collaborative project with the Metropolitan Institute for Planning of the GMA (IMEPLAN), the present methodology to define the risk of floods was discussed. A capacity building program was implemented to assist the IMEPLAN personnel to make use of the proposed methodologies to define risk management strategies in their planning work.
Up to know, most of the actions proposed to reduce the risk of floods in Mexican cities have to do with enlarging the capacity of the hydraulic infrastructure in places where severe floods frequently occur. These solutions have been partially effective, since they solve the problem for specific sites in the city but not for the urban zone as a whole. In the GMA, flash floods occur in several places and appear to spread out as the city grows. The modelling capacity may serve to test the efficiency of various approaches for the risk management problem. In particular, it may be useful when considering the role of green infrastructure, recovering ecosistemic services to reduce the hazard and the vulnerability simultaneously. There is no unique solution against floods and various approaches are necessary, in a comprehensive framework of risk management. Structural prevention measures, with a balance between natural and engineering approaches, will be necessary for flood risk reduction. In addition, the implementation of flood early warning systems may be necessary in order to reduce the impact of floods on the population.
So far, most attention has been given to the challenge of adaptation to global warming. But at the local level, it is necessary to attack the problem of the UHI and its effects in the hydrological cycle. The adaptation actions to face a changing climate may be evaluated using numerical models to quantify critical levels of risk that demand action. In any event, a relatively simple and clear method to explain how risk and disaster increases is necessary for a participatory approach to adapt to climate change.
Conflict of Interest
The authors declare that the research was conducted in the absence of any commercial or financial relationships that could be construed as a potential conflict of interest.
Author Contributions
All authors have equally contributed to the development of this article. The main contribution by the authors is the presentation of a methodology that quantifies risk factors (hazard and vulnerability) in such a way that it explains the tendency for a rapid increase in the number of urban flash floods in recent years in a large city of Mexico. The representation of hazards, vulnerability and risk may serve local authorities to design risk management (adaptation to climate change) plans to face one of the most serious challenges in the planning of urban expansion.

