


 nueva página del texto (beta)
 Inglés (pdf)
 Artículo en XML
 Referencias del artículo
 Enviar artículo por email
 Citado por SciELO
  Similares en
SciELO
Similares en
SciELO 
 Permalink
INTRODUCTION
The spread of crises through a region, in time, force and speed, is usually distinct. The impacts of crises reveal underlying social disparities in different regions: some regions recover quickly while others struggle to recover (Pontarolo & Sampieri, 2018). The before and after COVID-19 outbreak has negatively affected the quality of life globally. Many countries are unable to cope with the negative effects on economic activities, healthcare and education.
The term social vulnerability is recently being used as a tool to measure the impact of diseases on a population. In a pandemic, overlooked social deprivations become much more apparent. The impact of a pandemic is greater in low-income groups, who have limited available resources and access to information in order to mitigate the spread of diseases (Sánchez, et al., 2020).
Mexico has the fourth highest COVID-19 deaths worldwide, after the United States, Brazil and India, and 2,281,355 confirmed cases of COVID-19 as of February 28, 2021. The COVID-19 pandemic situation has made the severity of social inequalities such as income, healthcare and education in Hidalgo even more obvious. The already complex pre-pandemic situation has been exacerbated by the impacts of the disease and its related adverse side effects, which have been hard hitting especially on the vulnerable groups in society.
In the socioeconomic sphere, data from CONEVAL (2018c) revealed that in Mexico 52.4 percent of the population lives in poverty, 9.3 percent in extreme poverty; and 47.6 percent earn incomes below the poverty line. Looking at other poverty measurement variables, 43.6 percent of homes across Mexico do not have internet access, 19.8 percent do not have access to basic services such as drinking water inside their homes and proper indoor plumbing, and 27.6 percent of the homes are overcrowded (INEGI, 2010).
The pandemic´s behavior in Mexico affirms that the country’s public policies were not enough to cope with the health emergency. Upon the arrival of SARS-CoV-2, the country already had a fairly poor and unhealthy population, with a high morbidity rate due to chronic-degenerative diseases (Partida, 2004). There are regional variations in mortality rates according to the socioeconomic and health condition in such groups. The inadequate healthcare system with its deficient hospital infrastructure has been incapable of dealing with the people who require specialized care.
In Mexico, the number of available hospital beds is 1.5 per 1000 people, which is way below the world average of 2.7 beds according to the World Bank (2015). Hospital infrastructure is concentrated in less marginalized areas and health resources are unevenly distributed throughout the country, so there are major shortages in marginalized areas. Diseases such as diabetes, hypertension and obesity are increasingly prevalent in Mexicans; however, other factors, such as the increase in domestic violence, unwanted pregnancies UNFPA (2020) stress-related problems during the lockdown and treatment interruption of the aforementioned chronic diseases since many general hospitals, have been used as designated COVID hospitals and people continually living in fear of contracting the virus have worsen the general health of people with such chronic diseases during the pandemic, which has added even more pressure on the already strained healthcare system.
The main causes of morbidity in the State of Hidalgo are infectious diseases, with acute respiratory, urinary and intestinal diseases and obesity being the most prevalent (Dávila et al., 2014). Nine out of ten deaths are caused by non-communicable diseases (Health Services in Hidalgo, 2017). According to Hanff, Harhay, Marrón, Cohen, & Mohareb (2020), having comorbidities increases the development of severe stages of the COVID-19 disease.
The leading cause of death in people from Hidalgo before COVID-19 was heart disease, followed by diabetes, cerebrovascular disease, cirrhosis, chronic obstructive pulmonary disease, accidents, hypertension related diseases, nephritis, acute respiratory infections and protein-calorie malnutrition (Health Services in Hidalgo, 2017. In the case of diabetes, geriatric patients with heart and kidney disease are more susceptible to reaching more severe stages of COVID-19, since they are more at risk of getting infections, especially influenza and pneumonia (Gupta, et al., 2020).
This work is an analysis of social vulnerability as it relates to mortality due to COVID-19 using the fatality ratio, which could serve as a benchmark for decision-making to protect the most vulnerable sectors in municipalities in Hidalgo. The socioeconomic information from CONEVAL (2018a) and COVID-19 mortality data by municipality, published in official sources, are used for reference (Government of Mexico, 2021).
The concept of social vulnerability
Over recent decades, Mexico has been known for its widespread inequalities, which is observed in every state. The unequal distribution of the benefits provided by cities in highly urbanized and globalized societies results in a series of asymmetries (Busso, 2005) that also affects specific groups (age, sex, territory, income level) and limits their ability to cope with the adverse impacts such inequality causes [14]. The concept of vulnerability provides a multidimensional perspective that incorporates conditions of helplessness, insecurity and exposure to risks (Chambers, et al., 2018), and also includes the availability of resources and strategies to face adverse impacts (Pizarro, 2001).
Poverty measurements descriptively evaluate the resources that are available to individuals; however, the vulnerability approach incorporates the role of economic and social institutions. The term vulnerability refers to the inability of the weakest groups of society to cope with adverse impacts. Helplessness is not always attributable to low income, which is indicative of poverty (Pizarro, 2001). CONEVAL (2018b) defines poverty as any condition that violates an individual’s dignity and limits their basic rights and freedom. From the perspective of multiple factors, the poverty line is the minimum income considered as sufficient to buy essential goods to satisfy a person’s or family’s basic needs. People who earn incomes below the poverty line usually lack the resources overcome poverty (Busso, 2005).
Poverty is also measured by a person’s access to health services, social rights and economic well-being. These standards were put in place by the State and are meant to protect the social and human development of the people (Di Caro, 2017; Espon & Cardiff University, 2013). Poverty is a measure of a series of deficiencies that limit physical, human or social capital. These deficiencies are from two large groups, the first is well-being, which comprises the Unsatisfied Basic Needs (UBN) (Feres & Mancero, 2001) and of assets modules (Kaztman, et al., 1999). The second group is associated with fundamental human rights and the role of the State in guaranteeing they are met.
The vulnerability approach involves a change in the assumptions of policies that are aimed at the poor, so that they no longer focus on the lack of income; and their outlook on subsidies and mobilization of the resources and capabilities of the poor are broaden (Busso, 2005).
Analyzing assets belonging to the poor provides insight transitions out of poverty; therefore, the vulnerability approach gives an added value in terms of better understanding poverty and developing more appropriate solutions for reducing long-term poverty (Mosser, 1998). The resources that the poor have or lack are called “assets” and can be tangible or intangible: natural, physical, social, financial and human capital (Kaztman, et al., 1999). Vulnerability is a dynamic concept, which records changes as people move in and out of poverty; even though the poor are the most vulnerable, not all vulnerable people are poor (Mosser, 1998).
Poverty, vulnerable populations or populations at social risk, are terms that describe how households and individuals in Hidalgo live. The following section focuses on these inequalities and shows how social determinants such as income, unemployment, ethnicity and gender can cause and / or aggravate health issues, making this work pertinent in the reduction of such disparities among the populations.
Context of inequality in Hidalgo: social vulnerability
The urban growth process that has been taking place in Mexico since the mid-twentieth century has caused regional imbalances by giving large cities a more dominant role than rural areas. The characteristics of the cities allow people to take advantage of the infrastructure and access to urban services, meanwhile there is scarcity of resources and the lack of opportunities in the rest of the country (Bossier, 2013).
The state of Hidalgo is located in the central highlands of Mexico, and it is made up of 84 municipalities. Its territorial configuration is divided into two large regions: the region that falls within the Sierra Madre Oriental and the valley region. The first region is characterized by mountainous terrains at average heights of 2500 meters above sea level and climates ranging from tropical to cold temperate (mixed and deciduous forests). The second region is made up of inter-mountain valleys with a steppe climate.
Hidalgo has registered a slow and delayed urbanization process, which has resulted in spatial inequalities between urban and rural areas. This physically differentiated context is also perceived in the social sphere, the valley regions have had urban and industrial growth since the nineties with the expansion of the road network, the coverage of electrical infrastructure, telecommunications and promotion of iron and steel, fertilizers and raw materials (Garza, 2003), and its proximity to the Mexico City Metropolitan Area (ZMCM, Spanish acronym). Meanwhile, the mountainous regions at the north have remained stagnant and have the worst living conditions in the state (Garza, 2003).
Geographically, Hidalgo was built as a developing site due to the specific public policies related to the investment and creation of first level industrial infrastructure projects. The four large metropolitan areas of Hidalgo (Pachuca, Tizayuca, Tula and Tulancingo) belong to the megalopolis of Mexico City, which represents one of the densely populated regions of Mexico (López-Rangel, 2010). The proximity of large urban centers produces significant stress in emerged areas with rapid changes in land use, mainly with the growth of urban areas (Hernández-Flores et al., 2017). Due to their well-known geographic position, the metropolitan areas of Pachuca and Tulancingo increased road network during the last decade. The highway called "Arco Norte" along with federal highway 84 will constitute an improvement for services to people, trading and commuting (Casado-Izquierdo, 2012), especially in the central region of the country and Mexico City. However, the north and east of the state are totally isolated from this development due to the Sierra Madre Oriental, where the municipalities are characterized by their poor infrastructure, migration to the United States and high marginalization. With industrial development, population growth occurs, as the metropolitan area of Pachuca. In addition to the municipality of Mineral de la Reforma is located, which is one of the municipalities that shows a increased percentage of urbanization and the largest annual growth rate in Mexico (INEGI, 2020). However, regional public planning in Hidalgo (Roldán-Cruz, 2017) has resulted in government control to reorient urban and industrial growth with an overwhelming relationship with its physical environment. (Hernández-Flores et al., 2017).
Despite the urban growth seen in some cities in the country, Hidalgo’s growth is only observed in the capital Pachuca, and Tulancingo and Tula, which became a part of the city system in 1990 and 2000, respectively (Unikel, 1976; Sobrino, 2003). In the case of Pachuca, despite its proximity to the ZMCM, it shows a lack of development, because its industries are located in the outskirts of Mexico City, but its growth has not been driven toward the interior of the state.
According to INEGI (2015), 2.9 million people live in Hidalgo, and more than half of them live in urban centers. It is quite clear why the rural municipalities in the state are at such a. There is a distinctive social polarization between the two sectors: the clusters located to the south, with accelerated urban growth and provision of services; and those located in the mountainous region of the Sierra Oriental, to the north. There is a social gap and marginalization in the north due to physical distance, and also due to geographic conditions that restrict and segregate the settlements in this region and limit the availability of basic services.
According to CONEVAL (2018b), 49.4 percent of people in Hidalgo live in poverty and 9.3 percent of such people live in extreme poverty. There is a huge social gap that affects around 80.1 percent of the population in Hidalgo. Regarding housing conditions, 9.6 percent of homes in Hidalgo are poorly built and have limited space, 24.3 percent of these homes do not have adequate access to basic services, 5.9 percent do not have water indoors, 8.6 percent do not have access to proper indoor plumbing and 3.28 percent of the homes have dirt floors; 80 percent of homes do not have internet access.
Regarding education, there is significant degree of educational backwardness in the state: 10.3 percent of people 15 years and over have not finished high school and 6.7 percent of the population have no schooling at all.
Approximately 17 percent of the population does not have access to health care services. More than 68 percent of the population does not have access to Social Security, which provides an overview of the social disadvantage that almost two million people must face during the current health emergency.
Of the 84 municipalities in Hidalgo, 71 percent are above the average in terms of the number of people living in poverty and 52 percent of the people live in extreme poverty in these municipalities. The municipalities that lead the 2015 poverty values were: Xochiatipan (91.7%), Yahualica (87.5%), Nicolás Flores (84.4%), Huazalingo (84.2%) and Tlanchinol (84.0%).
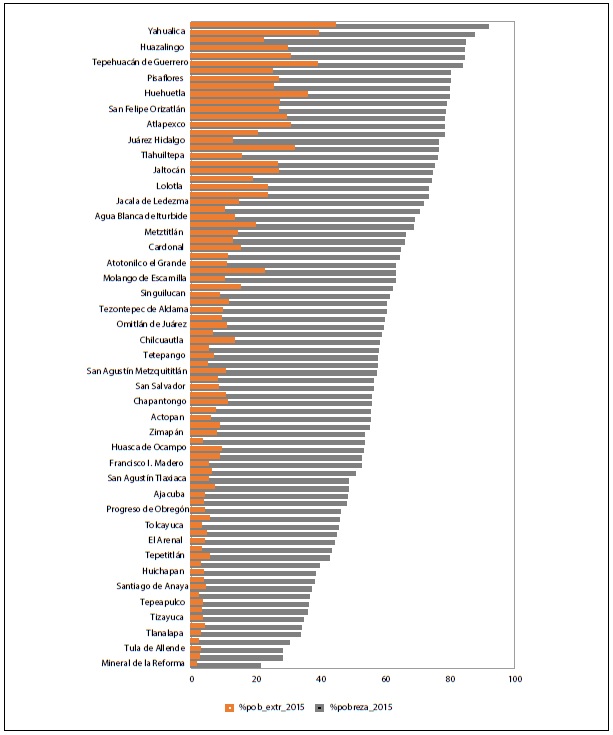
In terms of extreme poverty in 2015 (see Figure 1), the municipalities Xochiatipan, which showed an increase in the level of poverty and extreme poverty from 2010 to 2015, (44.1%), Yahualica (39.1%), Tepehuacán (38.7%), Huehuetla (35.7%) and Tlanchinol (30.2%) recorded the highest numbers. The lowest values of extreme poverty in 2015 were: Mineral de la Reforma (1.2%), Pachuca (1.9%), Epazoyucan (1.9%), Atotonilco de Tula (2.1%) and Tlanalapa (2.3%). In Xochiatipan, educational backwardness was observed in 33.1 percent of the municipalities in 2010 and increased to 39.1 percent in 2015. However, the lack of access to social security, which affected 83.67 percent of the population in 2010 and 70.1 percent in 2015, and the lack of access to basic housing services, 97.6 percent and 93.3 percent in 2010 and 2015 respectively stood out (CONEVAL, 2018b).
Source: Authors based on the information from CONEVAL (2018b).
Figure 1 Poverty and extreme poverty by municipality, Hidalgo 2015
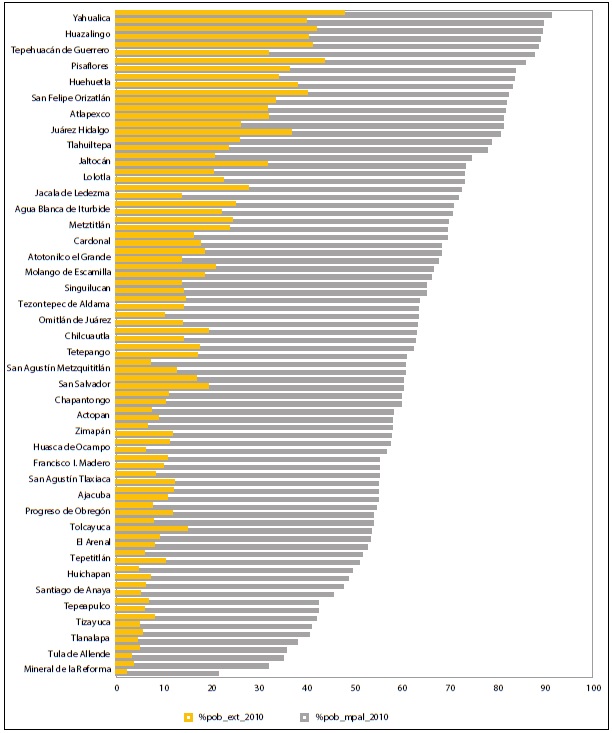
However, in the municipalities with the lowest poverty levels in 2010 (see Figure 2), Mineral de la Reforma (20.86%), Pachuca (31.76%), Atotonilco (34.7%), Atitalaquia (35.46%) and Epazoyucan (37.97%), the situation is very different. In Mineral de la Reforma and in the municipalities that topped the list of the lowest poverty levels at the municipal level, there was a very low level of educational backwardness (8.6%), and less people without quality living spaces (3.9%) and access to basic housing services (4.2%) in 2010 that the same trend was observed in the 2015.
Source: Authors based on the information from CONEVAL (2018b).
Figure 2 Poverty and extreme poverty by municipality, Hidalgo 2010
Figures 1 and 2 show the social inequality existing in the municipalities of Hidalgo. It can be observed in the data for 2010 and 2015. A positive trend is observed in 2010 and 2015, although the percentile increase is almost unnoticeable, and in some cases drops. The poverty level in some municipalities has increased over the 5-year period.
METHODOLOGY AND DATABASE
COVID-19 scenario in the municipalities in Hidalgo
The objective of this section is to make an assessment of the social vulnerability problem within the municipalities of Hidalgo. The main contribution is to focus on showing the inequality and social deterioration factors existing in these municipalities, and how this inequality affects each region.
Social vulnerability index
To perform an extensive measurement of social vulnerability, it is necessary to consider five dimensions: 1) Habitat, 2) Human capital, 3) Economic, 4) Social protection and 5) Social capital (Rodríguez, 2000). As a source of information, data from the 2015 Intercensal Survey (EIC, Spanish acronym) (INEGI, 2015) were used, and variables related to the module of unmet basic needs (UBN) were considered. Access to drinking water indoors, indoor plumbing, homes with dirt floors, roofs made up with waste material, access to appliances such as washing machines, Internet access, level of education, unemployed population, ethnicity, and demographic variables such as female population and percent of population age 60 and older; are some of the variables that were analyzed.
This study uses the analysis methodology that includes the construction of a social vulnerability index through the use of the principal components technique and its location in the state based on Geographic Information Systems (GIS).
The Principal Components Analysis (PCA) is used to analyze the information by calculating the proximity between cases and forming groups or clusters of data; one characteristic feature of this analysis is its exploratory nature (Alaminos, et al., 2015). The objective is the reduce the number of variables to a single indicator that expresses the conditions of social vulnerability from the aforementioned components: human, economic and social capital, and by characterizing the municipalities in Hidalgo according to their context of inequalities.
After performing the PCA, an indicator of Municipal Social Vulnerability (IVS, Spanish acronym for social vulnerability indicator) is obtained, and the variables used to construct it are shown in Table 1.
Table 1 Variables of the social vulnerability model in the municipalities of Hidalgo (n=84)
| Variable | Indicator | Source | Year |
| Vphaguafv | Private homes with access to drinking water outside the house | EIC | 2015 |
| Vph_1cto | One room private homes | EIC | 2015 |
| Vph_no_drenaj | Private homes lacking of basic services | EIC | 2015 |
| Vph_no_servsan | Private homes without sanitary services | EIC | 2015 |
| Vph_pisodti | Private homes with dirt floor | EIC | 2015 |
| mat_techosdes | Private homes with roofs made of waste material | EIC | 2015 |
| Vph_no_lav | Private homes lacking of washing machines | EIC | 2015 |
| Vph_no_inter | Private homes lacking from Internet access | EIC | 2015 |
| Pob_60ymas | Population aged 60 and older | EIC | 2015 |
| Pob_mujeres | Female population | EIC | 2015 |
| Pob_15sinesc | Population aged 15 years and older without schooling | EIC | 2015 |
| 15sec_inc | Population aged 15 years and older with incomplete secondary school | EIC | 2015 |
| Pob_sinder | Population without healthcare program | EIC | 2015 |
| Pob_desoc | Unemployed population | EIC | 2015 |
| HLI | Population aged 3 years and older speakers of an indigenous language | EIC | 2015 |
Source: Authors based on the information from INEGI (2015)
Table 2 shows the variables used to construct the IVS and their descriptive statistics. The information was taken from the EIC (INEGI, 2015). Vulnerability was classified into five ranges: Very high, High, Moderate, Low and Very Low through the natural breaks method.
Table 2 Descriptive statistics of the municipal social vulnerability model in Hidalgo (n=84)
| Variable | Average | Standard Deflection |
| Homes without water service | 535.05 | 648.51 |
| One room homes | 408.19 | 487.17 |
| Homes without sewer system | 778.44 | 792.64 |
| Homes without basic services | 368.77 | 345.55 |
| Homes without electricity | 126.65 | 85.04 |
| Homes with dirt floors | 295.69 | 320.74 |
| Homes with roofs made up with waste material | 75.45 | 140.90 |
| Homes without washing machines | 4191.52 | 3971.29 |
| Homes without Internet access | 7250.08 | 7041.22 |
| Population aged 60 and older | 3708.31 | 4005.85 |
| Female population | 17730.17 | 21653.72 |
| Population aged 15 years and older without schooling | 1640.17 | 1373.73 |
| Population aged 15 years and older with incomplete secondary school | 2561.58 | 3544.94 |
| Population without healthcare program | 5891.08 | 8853.67 |
| Unemployed population | 1291.94 | 1287.54 |
| Population speakers of an indigenous language | 2946.10 | 3235.80 |
Source: Authors based on the information from INEGI (2015)
Fatality ratio
In order to measure the proportion of deaths caused by the infectious disease SARS-CoV-2, the Case Fatality Ratio (CFR) was calculated using the World Health Organization´s methodology for estimating mortality (WHO, 2020). The analysis was performed at the cutoff of the date of this analysis. The CFR estimate during an ongoing epidemic provides a conditional estimation that is affected by the notification of new cases. The proportion of infected people who died out of the confirmed cases is obtained; it is a measure of the severity among the detected cases:
An analysis of mortality due to COVID-19 in the municipalities in Hidalgo was carried out to identify the possible relationships between the level of social vulnerability of the population in these municipalities and mortality (Araujo, 2015) due to COVID-19.
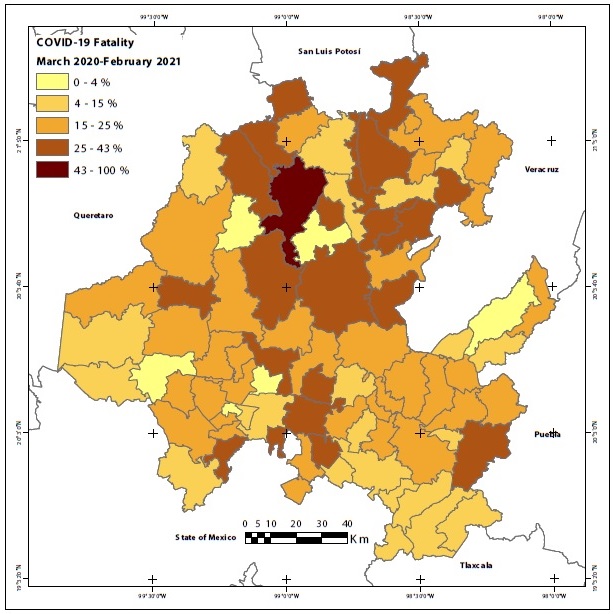
The following maps (Figure 3) show the evolution of COVID-19 fatality one year after the first case recorded in Hidalgo, from March 2020 to February 2021. In Hidalgo a regionalized behavior was observed. At the beginning of the period analyzed, fatality registered in Hidalgo were mostly in the municipality of Pachuca. Subsequently, the disease started to spread toward the northern region and there were very high levels of fatality, reaching its maximum level in December 2020. There was a decrease in fatalities in the next period, April to December, 2020, in the following municipalities: Zacualtipán, San Salvador, Acaxochitlán, Tlanalapa, Huehuetla, Lolotla, Xochiatipa, Tenango de Doria, Huautla, Jaltocan, Yahualica, Tlanchinol, Tlahuiltepa, Tianguistengo, Tepehuacán de Guerrero, Chapulhuacán y Huehuetla.
Source: Authors based on the information from INEGI (2010) and Government of Mexico (2021)
Figure 3 Spatial distribution of fatality in Hidalgo by municipality (March 2020-February 2021)
In the southern region, the municipality of Pachuca had the highest level of fatalities at the beginning of the study period. However, this rate fell until January 2021, when there was an upsurge in fatality levels in the northern region. April to August, 2020, the highest fatality rate was in the following municipalities: Tlanalapa, San Salvador, Tasquillo, Chilcuautla, Epazoyucan, Meztitlán, Omitlán de Juárez. From January to February, 2021, the highest fatality rate was in the following municipalities: Pachuca, Zapotlán, San Agustín, Atotonilco y Tula de Allende.
In unique cases, municipalities had reduced number of cases and the deaths of the confirmed cases, which explains the high levels of fatalities.
RESULTS AND DISCUSSION
Seventy-one percent of the municipalities in Hidalgo are below the average poverty level and 52 percent of these are in conditions of extreme poverty. This can be explained by significant population growth and the local governments’ inability to people with provide basic services.
To construct the social vulnerability index, socio-demographic variables were considered. According to the data analysis, the variables associated with the characteristics of the population played a major role in explaining social vulnerability in the municipalities in Hidalgo, which were grouped in the first component with most of the variability data (63.75%).
Access to health services, female population, percent of the population age 60 and older, ethnicity, percent of the population age 15 and older who have not completed high school, homes without Internet access, and unemployed population, were part of the group of variables that explained the social vulnerability by 80 percent (first component).
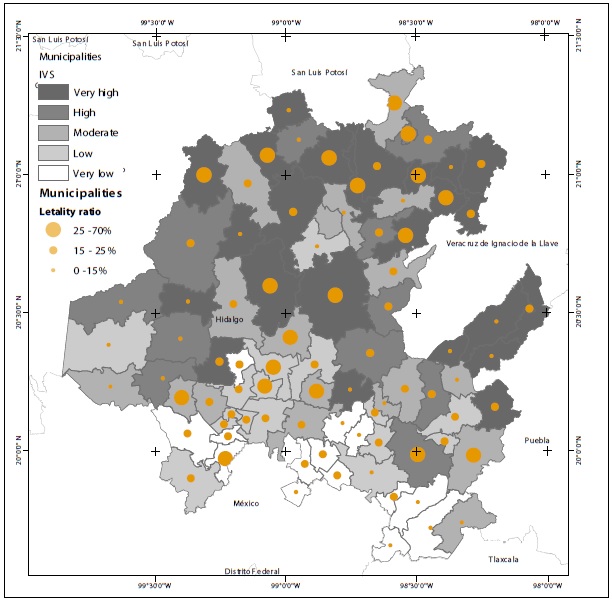
The regions with high rates of social vulnerability are located in the northern, eastern highlands, and western region (See Figure 4). These regions with high levels of social vulnerability are characterized by a lack of investment in infrastructure due to the local governments’ inability to provide basic public services. The northern region of Hidalgo has high levels of poverty, and is home to a people who earn low to very low incomes and whose homes have limited access to basic services.
Source: Authors based on the information from INEGI (2015).
Figure 4 Spatial distribution of the social vulnerability index in Hidalgo by municipality (2015)
More than 40 percent of the municipalities in Hidalgo had very high social vulnerability values. The 10 municipalities at the top of this list are Huehuetla, Huautla, La Misión, Yahualica, San Bartolo Tutotepec, Xochiatipan, Tianguistengo, Chapantongo, Pacula, Agua Blanca de Iturbide and Eloxochitlán. The municipalities with high vulnerability make up 26 percent of the total, including: Atotonilco el Grande, Metztitlán, Mineral del Monte, Villa de Tezontepec, Epazoyucan, Tepehuacán de Guerrero, Tlanalapa, Calnali, Singuilucan and Jaltocán.
The very high levels of social vulnerability in the above-mentioned municipalities explain the high percentage of fatality (30-70%) that was recorded in Pacula, La Misión, Tianguistengo, Yahualica, Tepetitlán and in the municipalities with high levels of vulnerability like Tepehuacán, San Felipe Orizatlán, among others (See Figure 4). The deficiencies of the population in these municipalities were related to inadequate housing conditions, low income and the result of residing in small towns that are isolated by the topography in the region. The relationship between the total population of the municipalities and the levels of very high and high vulnerability was inverse; as the population increased, the fatality rate decreased. This can be explained by the lack of maintenance and implementation of infrastructure and equipment in these municipalities, which increases the risk of a fatal outcome. Without considering the limited access to basic services such as drinking water and sanitation, which during a pandemic, directly affected the most vulnerable population.
CONCLUSIONS
The crisis due to the COVID-19 pandemic has mainly affected the most vulnerable population of the municipalities analyzed, who have limited or no access to social rights and no job security. It is estimated that the conditions caused by the pandemic will further increase the levels of income and labor poverty and it could limit the resilience to the impacts of poverty on the vulnerable population that has been affected.
The analysis of social vulnerability and the fatality ratio places the emphasis on the municipalities with people who are the most susceptible to fatal outcomes so that the focus of social policy actions would be to reduce the adverse effects of the pandemic in the less fortunate populations in the state.
The COVID-19 pandemic has highlighted the existing asymmetries in Hidalgo and the maps herein show the distribution of the most vulnerable municipalities.
The cartographic analysis in this study makes it possible to conclude that there are marked territorial inequalities in Hidalgo. Despite the assumption that in municipalities with high levels of social vulnerability such as the northern region, at the end of the period analyzed, the fatality rates would remain steadily high, surprisingly deaths due to COVID-19 have lowered in these regions. This can be explained by geographical factors such as topography, limited mobility and population dispersion, which limits grouping and social contact and has promoted the reduction of deaths due to COVID-19.
Although the pandemic has affected the most vulnerable groups, increasing extreme poverty and their own segregation conditions have caused less COVID-19 fatality in these groups. The foregoing gives way to future analyses to follow up on the phenomenon studied.
As for the southern region of the state, a contrary trend was observed. The case fatality rate was concentrated in three main regions in the most populous municipalities in Hidalgo, which are close to the Mexico City Metropolitan Area: Tula, Pachuca and Tulancingo. In these cases, although they have reduced social vulnerability, the maps showed an increase in deaths due to COVID-19 up to February 2021.
In view of the above, it can be concluded that the case fatality rate in the municipalities in Hidalgo has shown two distinct behaviors, based on the two major regions that have contrasting geographical conditions, mobility and population density, which have been determining factors in the number of COVID-19 deaths recorded in the two regions.

