


 nueva página del texto (beta)
 Inglés (pdf)
 Artículo en XML
 Referencias del artículo
 Enviar artículo por email
 Citado por SciELO
  Similares en
SciELO
Similares en
SciELO 
 Permalink
INTRODUCTION
Common weather factors that represent the longterm weather condition at a specific location are defined as climate (Michiels et al., 1992). Rainfall and air temperature are the most important climate elements, both of which tend to change over time. One of the effects of rising global air temperatures is the occurrence of extreme weather events such as droughts, floods, storms, and erratic changes in precipitation pattern and air temperature (Zhang et al., 2009). Precipitation is the most important climate variable, with the ability to improve yield of agricultural products, while contributing to severe and disastrous flood and drought events. In particular, soil vulnerability to erosion affects plant growth conditions and agricultural practices, changing land use management strategies. On the other hand, decreasing rainfall can lead to drought and environmental and ecological damage. Understanding the spatiotemporal variability of rainfall on annual, seasonal, monthly and daily time scales and within each region is considered a key factor in the planning and management of water resources.
Understanding the spatiotemporal rainfall variability plays a substantial role in human life on earth. Precise rainfall estimation should be performed to assess the potential of water resources, measurement of rainfall volume, frequency and duration. Similarly, observing the trend and predicting the risks caused by heavy rainfall is of utmost importance. Precipitation patterns are changing both in space and time around the world due to changes in the air moisture content, so estimating precipitation in different parts of the earth is very important. Understanding rainfall patterns allows planning irrigation, hydropower and other resource systems. Climate change leads to changes in the total amount of precipitation and extreme precipitation events (Cubasch et al., 2013). Extreme events such as drought due to days with low humidity and short-period extreme flooding occur most often due to drastic changes in precipitation intensity, amount and pattern (Li et al., 2010; Coscarelli and Caloiero, 2012; Yeşilırmak and Atatanır, 2016). Extreme rainfall events seriously affect the degree of soil erosion, agriculture, water supply, storm drainage patterns in urban areas, and hydropower supply (Caloiero, 2014). Thus, it is very important to monitor data on changing rainfall patterns to water scarcity, flood control and effective management of water resources.
Due to irregular rainfall and low rainfall values (below 800 mm per year) most of the region faces a chronic problem of lack of water, creating obstacles to the development of agricultural and livestock activities. The absence of efficient water storage systems (a resource that is often concentrated in the hands of few) further intensifies social effects. Cycles of severe droughts and floods often reach the region at intervals from a few years to decades, helping to worse even more the fragile living conditions of the semiarid population, particularly small producers and poor communities (Girão, 2012)
Temporal and spatial rainfall variability is a striking feature of the climate of northeastern Brazil, particularly in the semiarid portion, where spatial and temporal rainfall irregularity is an important factor, if not more, than seasonal rainfall totals themselves, especially for rainfed agriculture, which depends on maintaining soil moisture during the cultivation season. Northeastern Brazil has marked inter-annual variability, particularly in relation to rainfall and the availability of water resources, with extremely dry and other rainy years. According to Kayano and Andreoli (2009), this region is one of the main in South America, where the signs of intraseasonal variability are most evident.
The most important rainfall-causing system in northeastern Brazil is the Inter-tropical Convergence Zone (ITCZ). ITCZ presents the convergence of the North and South trade winds in the Atlantic with upward movement, low pressures, cloudiness and heavy rainfall and preferably follows regions where the sea surface temperature (TSM) is higher.
The Tropical Atlantic Ocean plays a key role in weather and climate variability in eastern Andean regions. Particularly over Brazil, the semiarid region is among the most significantly influenced by atmospheric and oceanic circulations of the Tropical Atlantic (Namias, 1972; Hastenrath and Heller, 1977; Moura and Shukla, 1981; Hastenrath, 1984; Mechoso et al., 1990; Hastenrath and Greischar, 1993; Alves et al., 1997; Rao et al., 1993; Noble and Shukla, 1996; Uvo et al., 1998; Giannini et al., 2004). There is strong observational and theoretical evidence resulting from general atmospheric circulation models that oceanic and atmospheric conditions over the Tropical Atlantic basin influence inter-annual climate variability over tropical America east of the Andes. The predominant spatial pattern of the annual cycle and the interannual variability of TSM and surface winds over the Atlantic have a more pronounced north/south structure than the east/west structure. The north/ south structure of TSM anomalies observed in the Atlantic are known as Tropical Atlantic dipole or gradient. This dipole pattern in the Tropical Atlantic allows the occurrence of southern gradients of TSM anomalies, which greatly affect the latitude position of the ITCZ, modulating the seasonal rainfall distribution over the Equatorial Atlantic, from the northern part of northeastern Brazil to central Amazon (Marengo and Hastenrath, 1993; Noble and Shukla 1996; Uvo et al., 1998; Marengo, 2004). In years when TSM over the South Tropical Atlantic (between the equator line and 15ºS) is higher than the long-term average during March-April-May and the North Tropical Atlantic (between 12ºN and 20ºN) is less heated than average, there is the formation of a southern gradient of TSM anomalies in the north/south direction. In this situation, there is a concomitant sea level pressure (SLP) lower that the South Atlantic average and higher than the North Atlantic average; the weaker-than-average southeast trade winds and the stronger-than-average northeast trade winds. The low surface pressure axis and confluence of trade winds shifted further south relative to its mean positioning and above average total rainfall over the northern region of Northeastern Brazil (Hastenrath and Heller, 1977).
Precipitation analysis can be performed through concentrated precipitation using the Precipitation Concentration Index (CI) (Martin-Vide, 2004). Several studies on precipitation variability have been carried out worldwide using various statistical procedures. A significant decrease in the number of rainy days and significant increase in rainfall intensity have been identified in many places around the world, such as China (Ren et al., 2000; Gong and Ho, 2002; Zhai et al., 2005) and America (Karl et al., 1996). With respect to the Mediterranean area, several studies have been conducted to investigate trends in large-scale annual and seasonal precipitation (Kutiel et al., 1996; Piervitali et al., 1998; Xoplaki et al., 2006) and for whole nations or regions (Amanatidis et al., 1993; Feidas et al., 2007). Rainfall records were surveyed in northern and central Italy (Montanari et al., 1996; De Michele et al., 1998; Brunetti et al., 2006), southern Italy and in particularly in the Calabria region (Coscarelli et al., 2004; Ferrari and Terranova, 2004; Buttafuoco et al., 2011).
Rainfall amounts on heavy rainy days can exert great control over rainfall totals. The study of rainy days can provide information on the frequency and intensity of rainfall events under different weather conditions. Olascoaga (1950), showed that 50% of precipitation in different climatic provinces of Argentina accounted for less than 20% of the number of concentrated rainy days and 75% of precipitation accounted for less than 30% of the number of heavy rainy days. Li, et al., 2010) estimated annual rainfall from the amount of 25% of rainy days for the Kaidudo River basin, southern Xinjiang, China.
Extreme precipitation can be quantified by analyzing the frequency of rainfall series and precipitation indexes. To quantify the heterogeneity of daily precipitation in one year, Martin-Vide (2004) developed a concentration index (CI). This index determines the relative impact of the different classes of daily precipitation and evaluates the weight of the largest daily event on the total precipitation value to quantify the monthly precipitation heterogeneity in one year.
In order to quantify monthly precipitation and precipitation heterogeneity in one year, Oliver (1980) and De Luis et al., (1997) developed the Concentrated Precipitation Index (PCI). Thus the Precipitation Concentration Index was proposed by Oliver (1980) in order to define the temporal precipitation variability during the year.
De Luis et al., (2011) reported that this index allows understanding the behavior of rainfall concentration in a space and since rainfall directly influences groundwater recharge and flow, spatial knowledge and concentration become indispensable.
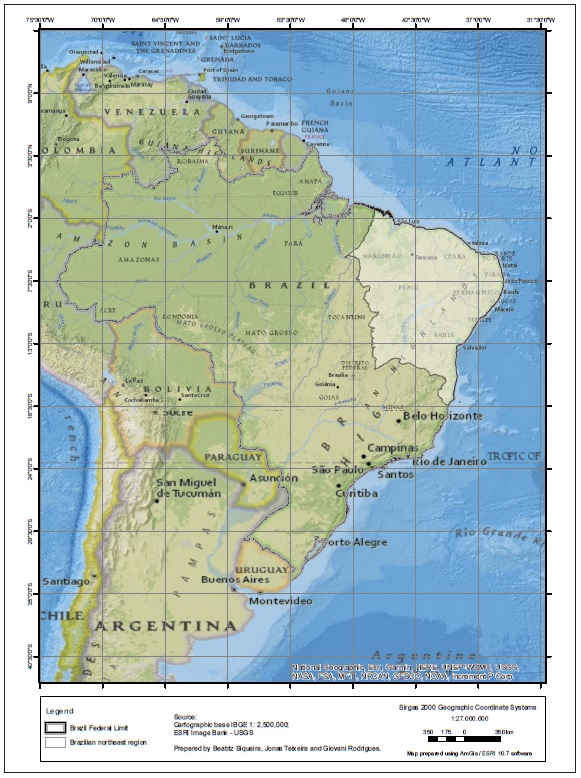
The aim of this work was to analyze rainfall in the Northeastern region of Brazil (Figure 1) using annual total precipitation and indexes to estimate its variability over the analysis period.
MATERIAL AND METHOD
Grid point data were used in the NetCDF format. NetCDF files have descriptive information about data they contain (called metadata). They can store different types of numeric variables and characters.
In addition, the format is efficient, allowing the user to access a small subset of a large database, to view the same file simultaneously by more than one reader and attach data to a NetCDF file without having to copy its database or redefine its structure. This type of data helps to better understand the variability of spatial precipitation. According to Liebmann and Allured (2005), even in the absence of topography, the rapid spatial and temporal precipitation variability makes the diagnosis of the largescale regional component extremely challenging, i.e., an accurate precipitation description is a first order requirement for climate studies and model validation. The authors report that the fields provided are daily precipitation totals and counts that give the number of stations included in each grid point for each day. This dataset is public and the file format is NetCDF, selected for cross-platform compatibility and inclusion of grid coordinates and other useful metadata, available on the Earth System Research Laboratory (ESRL) website ([s.d.]).
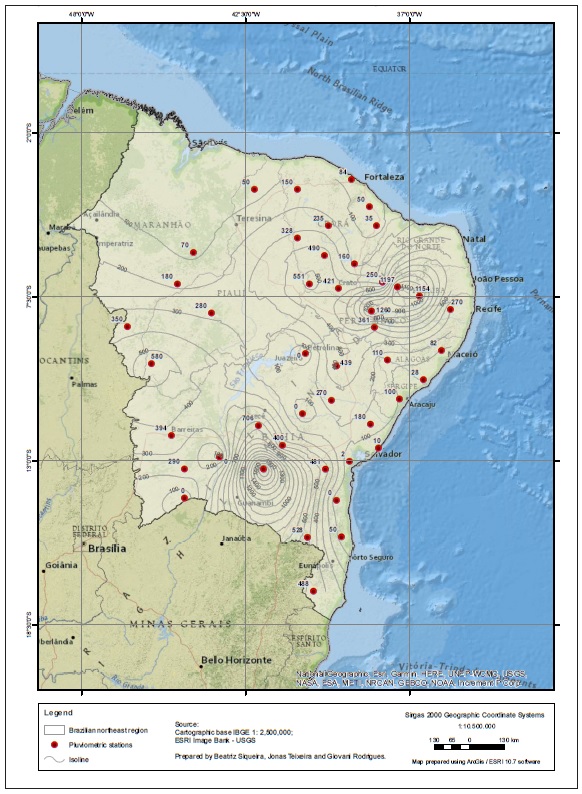
The analysis period was from 1966 to 2014 and 82 rainfall series were used, spatially distributed in the study area, Figure 2.
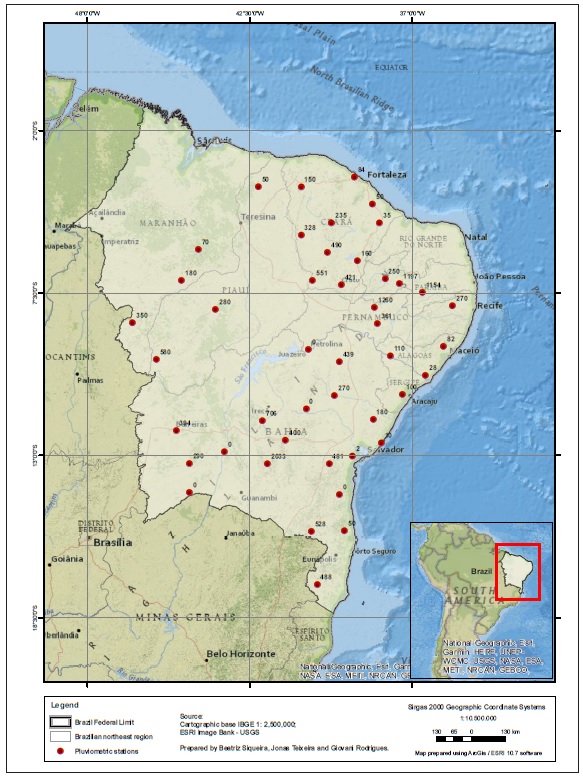
Figure 2 Location of rainfall series and respective altimetry in Northeastern region within South America.
The frequency distribution of daily precipitation is generally adjustable through a negative exponential distribution (Brooks and Carruthers, 1953; Martin-Vide, 2004). There are more days of low rainfall than those with high rainfall. These few rainy days, but with large amounts of daily rainfall, have a decisive effect on annual water input.
In order to evaluate the impact of daily precipitation concentration, the contributions of accumulated days of precipitation (X) in relation to the accumulated amount of precipitation (Y) were analyzed. The analysis of precipitation with daily resolution was performed using the Precipitation Concentration Index (CI) (Martin-Vide, 2004), which evaluates the contribution of days of greater precipitation to the total amount. It is important to analyze the accumulated amount of precipitation (Y) against the accumulated days of precipitation (X) on which it occurred. These percentages are related to positive exponential curves, called normalized precipitation curves (Jolliffe and Hope, 1996). Riehl (1949) and Olascoaga (1950) have shown that such functions can be expressed as follows:
The above percentages can generate polygonal line, called concentration curve or Lorenz curve, widely used in many areas (Wheeler et al., 2004). Martin-Vide (2004) improved this method by replacing polygonal lines with exponential curves, equation (1). The area S surrounded by the quadrant bisector and the Lorenz curve can be expressed as:
Where α and b are constants and can be estimated by the least square method as follows:
Where N is the number of classes with nonzero frequency.
From this value, the Daily Precipitation Concentration Index (CI) is defined as:
CI is a decimal value ranging from 0 to 1. Daily precipitation amounts are better distributed among different rainfall classes and the closer to 0 the CI value and more concentrated in a few classes the closer to 1. CI value equal to zero represents the ideal situation, in which the total rainfall would be evenly distributed among different classes.
Precipitation irregularity was obtained through the temporary irregularity index. This index, proposed by Martin-Vide (2003), is called precipitation irregularity index (S1).
Where P i is the precipitation for year i; P i+1 precipitation for year i +1; n number of years.
This index oscillates between zero and infinity, and values close to zero indicate rainfall regularity, very high values of this index denote greater rainfall irregularity, Table 1.
Table 1 Rainfall irregularity classification through the irregularity index (S1).
| S1 rating | S1 |
| Very low | < 0,20 |
| Low | 0,20-0,24 |
| Moderate | 0,25-0,29 |
| Moderate high | 0,30-0,34 |
| High | 0,35-0,39 |
| Very high | > 0,40 |
Organization: Authors, 2020.
The Concentrated Precipitation Index (PCI) is an indicator of the spatial and temporal precipitation distribution, traditionally applied on annual scales. When this value increases, it means higher precipitation concentration. In addition, the index comes from another index, (Fournier index), used in the analysis of natural systems, such as soil erosion (De Luis et al., 2011).
PCI not only defines the temporal rainfall variability but is also of great interest in soil erosion studies, since it has a more active dynamic effect the higher its concentration over time.
Changes in PCI values appear to be complex and may be related to global and synoptic characteristics of the atmosphere and to local factors that affect precipitation trends (De Luis et al., 2011).
De Luis et al., (2011) reported that this index allows understanding the behavior of rainfall concentration in a space and since rainfall directly influences groundwater recharge and flow, spatial knowledge and concentration become indispensable.
The modified index is expressed by:
Where pi is the amount of rainfall of the ith month, calculated for each of the rain gauges and for each year during the study period. As described by Oliver (1980), PCI values <10 indicate uniform monthly precipitation distribution (low precipitation concentration), while values between 11 and 15 indicate moderate precipitation concentration, 20 > PCI > 16 indicates seasonality in precipitation distribution and PCI> 20 indicates high precipitation concentration (strong seasonality), Table 2.
DISCUSSION OF RESULTS
The application of CI requires reliable data, especially the smallest amounts of rainfall, that is, those of very low intensity. Otherwise, the CI value is significantly distorted, which is based on the distribution of absolute frequencies in classes of one millimeter. It is therefore necessary to “purify” data by comparing them with the nearest rainfall series, avoiding those that do not include these intensities and therefore do not conform to a negative exponential distribution.
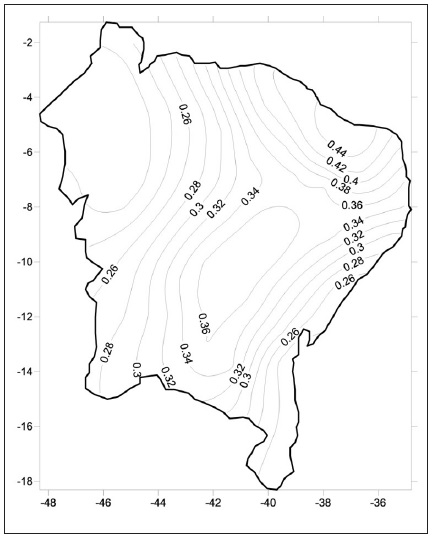
Changes in precipitation concentration are more clearly observed by obtaining the index values, which are presented in Figure 3. According to the spatial CI distribution, it could be observed that the value of 0.63 is largely exceeded from the study area, which indicates a high precipitation concentration. This generally assumes that rainy days contribute 77% of annual rainfall.
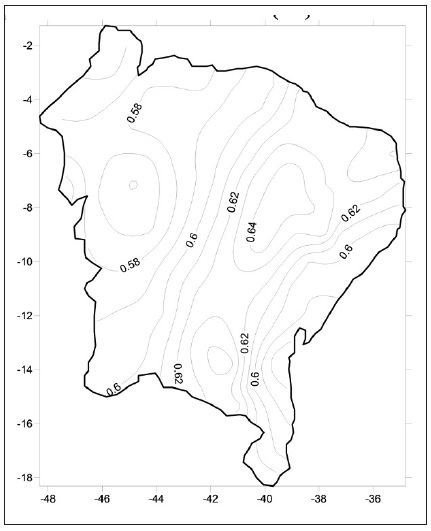
The values found for the study area range from 0.55 to 0.68. More than 46 of the 82 rainfall series (56%) have CI greater than 0.60, indicating that the region has marked rainfall concentration.
CI values have been estimated for all rainfall series and range from a minimum of 0.55 to a maximum of 0.65. The study area can be divided into two parts, most of which have rain concentration, as values are above 0.60. The highest CI values extend from north to south in the central part of the study area. Figure 3 shows that the relief influences rainfall and distribution over the region with the highest CI values south of northeastern Brazil, where altitude values are over 700 m, in addition to the east of the study area, with altitude exceeding 2,000 m. Also in the central area of northeastern Brazil, there is the Drought Polygon, where rainfall is concentrated within a few months (4 months on average) and this concentration reflects CI values above 0.62.
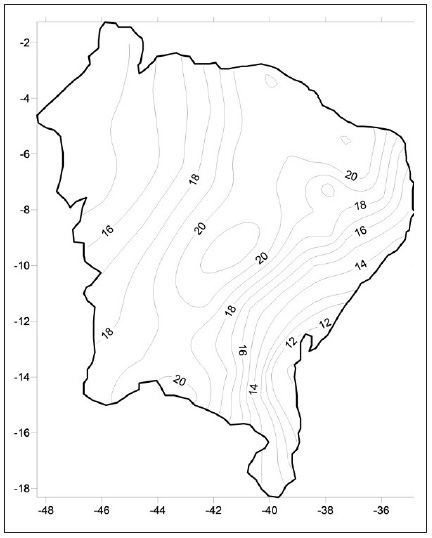
The temporal rainfall distribution has been studied through the PCI. Figure 4 shows the spatial distribution of PCI values calculated from a precipitation dataset. These values range from minimum of 11.3 to value greater than 23.2, i.e., from moderately seasonal to strongly seasonal, so the PCI distribution is not uniform across the region, Figure 4.
Organization: Authors, 2020.
Figure 4 Spatial distribution of the concentrated precipitation index (PCI).
According to Table 1, the northwest of the Northeastern region has moderate rainfall irregularity, as well as the southeast of this area, but the central portion has high irregularity and the northeast of the study area, irregularity is very high (> 40). This irregularity is probably associated with the occurrence of El Niño and La Niña and Tropical Atlantic Oscillation patterns that markedly interfere with rainfall variability in this region, Figure 5.
Another aspect that explains the irregularity of precipitation in the study area is the orography (Figure 6).
Organization: Author, 2020.
Figure 6 Spatial distribution and elevation data of pluviometric stations.
The Borborema Plateau is an important condition, since the concentration of precipitation on the leeward side, even if present, is lower than on the windward side, where the index marks 0.64. Towards the interior of the continent, towards the Plateaus and Plates of the Parnaíba Basin, towards the West, the daily concentration of precipitation decreases, as does the altimetry of the region.
With regard to the monthly concentration of precipitation, the PCI expresses marked monthly variability in some points of Northeast Brazil, which coincide with those of the daily concentration, where the PCI is equal to 20. These are the areas of the region covered, respectively, by the Plateaus and Plates of the Parnaíba Basin, Sertaneja Depression of the São Francisco and Borborema Plateau. The monthly concentration is decreasing towards the Plains and Coastal Plains, with PCI between 12 and 18, indicating, according to Oliver’s classification (1980), seasonality in the distribution of rains.
Further south of the continent, there is also daily concentration and marked monthly variability in rainfall concentration. With CI equal to 0.62 and PCI equal to 20. This area of the Northeast region of Brazil is covered by the mountain and Eastern higland Sudeste, with emphasis on Diamantina stoned.
In general, the daily and monthly concentration of precipitation occurs, more sharply, at the intersections between plateaus and depressions in the Northeast region of Brazil, between higher altitudes and other more modest ones. In flat areas, such as those on the coast, daily precipitation is concentrated, unlike monthly precipitation, which denotes seasonality in its concentration. In this sense, the variability of monthly precipitation has more to do with altimetry than the daily concentration of precipitation, which is more evident throughout the region, except towards the West.
The existence or not of a trend was based on significance levels shown in Tables 2 and 3. The statistical significance degree of results is important, since the higher the significance degree, the more faithful or reliable it can be.
Table 3 Calculations of Z values (Z test) for total precipitation in each rainfall series, as well as the significance levels.
| n | Code | Station names | Lat. | Long. | Period | N | Z | Sign. |
| 1 | 338001 | Fortaleza | 3,45 | 38,34 | 1919-2018 | 99 | 1,28 | |
| 2 | 338008 | S. G. do Amarante | 3,34 | 38,58 | 1927-2018 | 91 | 1,22 | |
| 3 | 339004 | Pentecoste | 3,46 | 39,16 | 1952-2018 | 66 | 0,21 | |
| 4 | 339028 | São Luis do Curu | 3,40 | 39,14 | 1920-2018 | 99 | -1,21 | |
| 5 | 340005 | Forquilha | 3,48 | 40,15 | 1920-2018 | 97 | -0,97 | |
| 6 | 340014 | Carire | 3,57 | 40,28 | 1914-2018 | 99 | -0,66 | |
| 7 | 340015 | Frecheirnha | 3,46 | 40,49 | 1934-2018 | 83 | -1,83 | (+) |
| 8 | 340018 | Ibiapina | 3,55 | 40,52 | 1912-2018 | 99 | 1,60 | |
| 9 | 340023 | Mucambo | 3,54 | 40,46 | 1934-2018 | 84 | -1,50 | |
| 10 | 340030 | Tianguá | 3,43 | 40,58 | 1920-2018 | 99 | 0,24 | |
| 11 | 340031 | Ubajara | 3,51 | 40,55 | 1920-2018 | 99 | -0,56 | |
| 12 | 340041 | Meruoca | 3,27 | 40,28 | 1920-2018 | 99 | -2,06 | * |
| 13 | 437006 | Jaguaruana | 4,49 | 37,46 | 1920-2018 | 99 | 0,32 | |
| 14 | 438021 | Chorozinho | 4,18 | 38,29 | 1932-2018 | 86 | 2,56 | * |
| 15 | 438022 | Cascavel | 4,29 | 38,21 | 1932-2018 | 86 | 0,01 | |
| 16 | 438051 | Acarapé | 4,13 | 38,42 | 1920-2018 | 98 | 0,81 | |
| 17 | 439003 | Paramonti | 4,04 | 39,15 | 1935-2018 | 82 | 0,13 | |
| 18 | 439018 | Aratuba | 4,25 | 39,03 | 1935-2012 | 83 | -3,47 | *** |
| 19 | 440000 | Reriutuba | 4,09 | 40,34 | 1927-2018 | 91 | 0,55 | |
| 20 | 440007 | Tamboril | 4,49 | 40,19 | 1920-2018 | 98 | 0,89 | |
| 21 | 440017 | Nova Russas | 4,43 | 40,34 | 1920-2018 | 98 | -0,90 | |
| 22 | 440023 | Guaraciaba do Norte | 4,10 | 40,45 | 1920-2018 | 98 | -1,29 | |
| 23 | 538009 | Limoeiro do Norte | 5,07 | 38,06 | 1920-2018 | 98 | -0,59 | |
| 24 | 538010 | São João do Jaguaribe | 5,16 | 38,16 | 1920-2018 | 98 | -0,99 | |
| 25 | 539023 | Solonópole | 5,42 | 39,01 | 1920-2018 | 98 | -0,22 | |
| 26 | 540003 | Novo Oriente | 5,32 | 40,46 | 1920-2018 | 84 | 1,95 | (+) |
| 27 | 638008 | Umari | 6,37 | 38,42 | 1920-2018 | 98 | -1,12 | |
| 28 | 638011 | Pereiro | 6,03 | 38,28 | 1920-2018 | 98 | -2,91 | ** |
| 29 | 638014 | Icó | 6,24 | 38,51 | 1920-2018 | 98 | -0,81 | |
| 30 | 639006 | Cariús | 6,37 | 39,19 | 1936-2018 | 82 | 0,26 | |
| 31 | 639013 | Catarina | 6,07 | 39,52 | 1932-2018 | 86 | 0,05 | |
| 32 | 639033 | Saboeiro | 6,31 | 39,54 | 1920-2018 | 91 | -1,56 | |
| 33 | 639034 | Várzea Alegre | 6,48 | 39,18 | 1920-2018 | 98 | 0,27 | |
| 34 | 640002 | Tauá | 6,01 | 40,16 | 1920-2018 | 98 | 1,95 | (+) |
| 35 | 640015 | Parambu | 6,13 | 40,42 | 1932-2018 | 86 | 1,44 | |
| 36 | 640019 | Aiuba | 6,34 | 40,07 | 1932-2018 | 86 | 2,35 | * |
| 37 | 738006 | Brejo Santo | 7,29 | 38,58 | 1920-2018 | 98 | -0,60 | |
| 38 | 739006 | Crato | 7,13 | 39,24 | 1920-2018 | 98 | 0,26 | |
| 39 | 739010 | Porteiras | 7,31 | 39,07 | 1920-2018 | 98 | -2,63 | ** |
| 40 | 740006 | Campos Sales | 7,04 | 40,22 | 1920-2018 | 98 | -3,32 | *** |
| 41 | 740009 | Potengi | 7,06 | 40,01 | 1936-2018 | 82 | 0,24 | |
| 42 | 737006 | Piancó | 7,12 | 37,55 | 1920-2018 | 98 | -0,60 | |
| 43 | 737023 | Afogados da Ingazeira | 7,44 | 37,38 | 1920-2018 | 98 | 2,44 | * |
| 44 | 737027 | Flores | 7,52 | 37,58 | 1920-2018 | 98 | -2,29 | * |
| 45 | 838000 | Floresta | 8,32 | 38,11 | 1935-2018 | 83 | 0,53 | |
| 46 | 838004 | Belém do S. Francisco | 8,45 | 38,57 | 1946-2018 | 72 | 1,70 | (+) |
| 47 | 840015 | Santa M. da B. Vista | 8,59 | 40,16 | 1941-2018 | 77 | -6,73 | *** |
| 48 | 939014 | Uauá | 9,49 | 39,28 | 1920-2018 | 98 | -1,88 | (+) |
| 49 | 940024 | Juazeiro | 9,24 | 40,30 | 1934-2018 | 83 | -0,38 | |
| 50 | 937013 | Delmiro Gouveia | 9,23 | 37,59 | 1937-2018 | 81 | -0,36 | |
| 51 | 937023 | Piranhas | 9,37 | 37,45 | 1935-2018 | 83 | 0,03 | |
| 52 | 1036005 | Penedo | 10,17 | 36,33 | 1935-2018 | 83 | -0,99 | |
| 53 | 1036007 | Piaçubuçu | 10,24 | 36,25 | 1929-2018 | 89 | -0,55 | |
| 54 | 1037007 | Itaporanga d’Ajuda | 10,56 | 37,20 | 1949-2018 | 69 | -0,58 | |
| 55 | 1039019 | Queimadas | 10,58 | 39,37 | 1943-2018 | 74 | -0,05 | |
| 56 | 1137027 | Jandaíra | 11,32 | 37,33 | 1914-2018 | 98 | 5,09 | *** |
| 57 | 1138002 | Inhambupe | 11,46 | 38,20 | 1936-2018 | 82 | 2,14 | * |
| 58 | 1140000 | Miguel Calmon | 11,25 | 40,36 | 1936-2018 | 82 | -4,68 | *** |
| 59 | 1142014 | Barra da Mendes | 11,49 | 42,04 | 1938-2018 | 80 | 2,14 | * |
| 60 | 1240012 | Itaeté | 12,59 | 40,57 | 1934-2018 | 84 | -2,10 | * |
| 61 | 1241017 | Lençóis | 12,29 | 41,17 | 1942-2018 | 76 | -1,19 | |
| 62 | 1243000 | Sítio do Mato | 12,52 | 43,22 | 1912-2018 | 99 | 0,44 | |
| 63 | 1244011 | Barreiras | 12,09 | 45,00 | 1937-2018 | 81 | 2,14 | * |
| 64 | 1339034 | Nazaré | 13,01 | 39,01 | 1943-2018 | 75 | -1,63 | |
| 65 | 1339041 | Santa Inês | 13,17 | 39,49 | 1944-2018 | 74 | -1,84 | (+) |
| 66 | 1344002 | S. Maria da Vitória | 13,16 | 44,33 | 1946-2018 | 69 | 0,41 | |
| 67 | 1439006 | Gongogi | 14,19 | 39,28 | 1950-2018 | 68 | -2,75 | ** |
| 68 | 1539006 | Itapebi | 15,57 | 39,31 | 1944-2018 | 74 | -2,15 | * |
| 69 | 1539010 | Mascote | 15,33 | 39,18 | 1944-2018 | 74 | -3,00 | ** |
| 70 | 1739006 | Nova Viçosa | 17,48 | 39,39 | 1942-2018 | 76 | -1,92 | (+) |
| 71 | 1740005 | Medeiros Neto | 17,22 | 40,13 | 1953-2018 | 65 | -0,18 |
*** 99.9%, ** 99%, *95% and + 90% to detect whether or not there was a tendency in the Mann Kendall test (1975).
Organization: Authors, 2020.
Table 3 shows trends using the sequential MK test, used to analyze total annual precipitation. From the total of 82 series analyzed, 26 showed positive or negative trends, corresponding to 32% of series used. In this total of 26 series, 14% showed negative trend, i.e., a decrease in rainfall in the study area. However, percentages indicate that one cannot generalize trends (positive or negative) in northeastern Brazil.
The sequential MK test is considered more suitable for detecting possible changes related to the rainfall pattern. According to Goossens and Berger (1986), the MK test is considered more judicious at level of analysis, being the most recommended for climatological studies due to its ability of detection and approximate localization of the starting point at which a certain trend begins.
From 1973 to 1983, the Northeastern region of Brazil was affected by long periods of rainfall scarcity, continuing at random between the years 1997, 1998, 2003, 2004, 2005, as well as the period from 2012 to 2016. Thus, it is noteworthy that the pattern observed does not necessarily reflect a change in climate order. Moreover, Marengo (2007) points out that very dry or very rainy periods in the northeastern semiarid alternate randomly, under the strong influence of atmospheric systems resulting from the thermodynamic pattern of the tropical Pacific and Atlantic oceans.
The application of the Mann-Kendall test resulted in annual CI and PCI values for 71 rainfall series, with 18 series showing significant trends (this reveals a trend towards a more uniform monthly rainfall distribution throughout the year) with confidence level over 90% for PCI and 36 series showed significant trends for CI (precipitation concentration in 51% of the analyzed series), Table 4.
Table 4 Calculations of Z values (Z test) for CI and PCI in each rainfall series, as well as significance levels.
| CI | PCI | |||||||||
| n | Code | Station names | Lat. | Long. | Period | N | Z | Sign. | Z | Sign. |
| 1 | 338001 | Fortaleza | 3,45 | 38,34 | 1919-2018 | 99 | 2,27 | * | -2,09 | * |
| 2 | 338008 | S. G. do Amarante | 3,34 | 38,58 | 1927-2018 | 91 | -0,17 | 1,69 | (+) | |
| 3 | 339004 | Pentecoste | 3,46 | 39,16 | 1952-2018 | 66 | 2,57 | * | -1,09 | |
| 4 | 339028 | São Luis do Curu | 3,40 | 39,14 | 1920-2018 | 99 | 0,65 | -0,71 | ||
| 5 | 340005 | Forquilha | 3,48 | 40,15 | 1920-2018 | 97 | -2,95 | ** | 0,36 | |
| 6 | 340014 | Carire | 3,57 | 40,28 | 1914-2018 | 99 | 0,67 | -0,85 | ||
| 7 | 340015 | Frecheirnha | 3,46 | 40,49 | 1934-2018 | 83 | 0,44 | -1,87 | (+) | |
| 8 | 340018 | Ibiapina | 3,55 | 40,52 | 1912-2018 | 99 | 0,41 | -0,01 | ||
| 9 | 340023 | Mucambo | 3,54 | 40,46 | 1934-2018 | 84 | 0,03 | -2,29 | * | |
| 10 | 340030 | Tianguá | 3,43 | 40,58 | 1920-2018 | 99 | -2,25 | * | -1,90 | (+) |
| 11 | 340031 | Ubajara | 3,51 | 40,55 | 1920-2018 | 99 | -2,58 | ** | -1,50 | |
| 12 | 340041 | Meruoca | 3,27 | 40,28 | 1920-2018 | 99 | 0,34 | 1,10 | ||
| 13 | 437006 | Jaguaruana | 4,49 | 37,46 | 1920-2018 | 99 | -0,14 | 0,98 | ||
| 14 | 438021 | Chorozinho | 4,18 | 38,29 | 1932-2018 | 86 | -0,35 | -2,54 | * | |
| 15 | 438022 | Cascavel | 4,29 | 38,21 | 1932-2018 | 86 | -0,48 | -0,23 | ||
| 16 | 438051 | Acarapé | 4,13 | 38,42 | 1920-2018 | 98 | 1,60 | -0,22 | ||
| 17 | 439003 | Paramonti | 4,04 | 39,15 | 1935-2018 | 82 | -0,17 | 0,05 | ||
| 18 | 439018 | Aratuba | 4,25 | 39,03 | 1935-2012 | 83 | -1,97 | * | -0,25 | |
| 19 | 440000 | Reriutuba | 4,09 | 40,34 | 1927-2018 | 91 | 1,63 | -2,42 | * | |
| 20 | 440007 | Tamboril | 4,49 | 40,19 | 1920-2018 | 98 | -1,23 | -1,00 | ||
| 21 | 440017 | Nova Russas | 4,43 | 40,34 | 1920-2018 | 98 | -0,44 | 0,16 | ||
| 22 | 440023 | Guaraciaba do Norte | 4,10 | 40,45 | 1920-2018 | 98 | 0,03 | -1,93 | (+) | |
| 23 | 538009 | Limoeiro do Norte | 5,07 | 38,06 | 1920-2018 | 98 | -1,75 | (+) | -1,18 | |
| 24 | 538010 | São João do Jaguaribe | 5,16 | 38,16 | 1920-2018 | 98 | -0,55 | -0,74 | ||
| 25 | 539023 | Solonópole | 5,42 | 39,01 | 1920-2018 | 98 | -1,81 | (+) | -0,55 | |
| 26 | 540003 | Novo Oriente | 5,32 | 40,46 | 1920-2018 | 84 | -0,06 | -0,62 | ||
| 27 | 638008 | Umari | 6,37 | 38,42 | 1920-2018 | 98 | -3,16 | ** | 0,07 | |
| 28 | 638011 | Pereiro | 6,03 | 38,28 | 1920-2018 | 98 | -0,54 | -1,92 | (+) | |
| 29 | 638014 | Icó | 6,24 | 38,51 | 1920-2018 | 98 | 1,19 | -0,65 | ||
| 30 | 639006 | Cariús | 6,37 | 39,19 | 1936-2018 | 82 | 0,42 | -1,23 | ||
| 31 | 639013 | Catarina | 6,07 | 39,52 | 1932-2018 | 86 | -1,26 | -2,30 | * | |
| 32 | 639033 | Saboeiro | 6,31 | 39,54 | 1920-2018 | 91 | -4,99 | *** | -0,51 | |
| 33 | 639034 | Várzea Alegre | 6,48 | 39,18 | 1920-2018 | 98 | -3,97 | *** | -0,79 | |
| 34 | 640002 | Tauá | 6,01 | 40,16 | 1920-2018 | 98 | 1,01 | 0,74 | ||
| 35 | 640015 | Parambu | 6,13 | 40,42 | 1932-2018 | 86 | -0,51 | 1,14 | ||
| 36 | 640019 | Aiuba | 6,34 | 40,07 | 1932-2018 | 86 | 0,72 | 0,47 | ||
| 37 | 738006 | Brejo Santo | 7,29 | 38,58 | 1920-2018 | 98 | -3,72 | *** | 0,28 | |
| 38 | 739006 | Crato | 7,13 | 39,24 | 1920-2018 | 98 | 1,40 | -0,17 | ||
| 39 | 739010 | Porteiras | 7,31 | 39,07 | 1920-2018 | 98 | -0,15 | 0,92 | ||
| 40 | 740006 | Campos Sales | 7,04 | 40,22 | 1920-2018 | 98 | -2,06 | * | -0,47 | |
| 41 | 740009 | Potengi | 7,06 | 40,01 | 1936-2018 | 82 | -1,94 | (+) | 0,99 | |
| 42 | 737006 | Piancó | 7,12 | 37,55 | 1920-2018 | 98 | -0,36 | -1,68 | (+) | |
| 43 | 737023 | Afogados da Ingazeira | 7,44 | 37,38 | 1920-2018 | 98 | -2,68 | ** | -0,74 | |
| 44 | 737027 | Flores | 7,52 | 37,58 | 1920-2018 | 98 | 2,61 | ** | -1,48 | |
| 45 | 838000 | Floresta | 8,32 | 38,11 | 1935-2018 | 83 | -2,05 | * | -0,32 | |
| 146 | 838004 | Belém do S. Francisco | 8,45 | 38,57 | 1946-2018 | 72 | 2,39 | * | -1,21 | *** |
| 47 | 840015 | Santa M. da B. Vista | 8,59 | 40,16 | 1941-2018 | 77 | 2,96 | ** | 4,19 | |
| 48 | 939014 | Uauá | 9,49 | 39,28 | 1920-2018 | 98 | -1,99 | * | 2,61 | ** |
| 49 | 940024 | Juazeiro | 9,24 | 40,30 | 1934-2018 | 83 | 4,02 | *** | 1,69 | (+) |
| 50 | 937013 | Delmiro Gouveia | 9,23 | 37,59 | 1937-2018 | 81 | 1,23 | 0,35 | ||
| 51 | 937023 | Piranhas | 9,37 | 37,45 | 1935-2018 | 83 | 1,01 | 0,93 | ||
| 52 | 103605 | Penedo | 10,17 | 36,33 | 1935-2018 | 83 | 4,72 | *** | -1,18 | |
| 53 | 103607 | Piaçubuçu | 10,24 | 36,25 | 1929-2018 | 89 | 1,89 | (+) | 1,50 | |
| 54 | 103707 | Itaporanga d’Ajuda | 10,56 | 37,20 | 1949-2018 | 69 | 2,12 | * | -0,47 | |
| 55 | 103909 | Queimadas | 10,58 | 39,37 | 1943-2018 | 74 | 2,97 | ** | -0,28 | |
| 56 | 113707 | Jandaíra | 11,32 | 37,33 | 1914-2018 | 98 | 6,02 | *** | 0,36 | |
| 57 | 113802 | Inhambupe | 11,46 | 38,20 | 1936-2018 | 82 | 2,11 | * | -1,54 | |
| 58 | 114000 | Miguel Calmon | 11,25 | 40,36 | 1936-2018 | 82 | 2,49 | * | 4,91 | *** |
| 59 | 114204 | Barra da Mendes | 11,49 | 42,04 | 1938-2018 | 80 | 0,22 | -3,51 | *** | |
| 60 | 124002 | Itaeté | 12,59 | 40,57 | 1934-2018 | 84 | -1,73 | (+) | 1,29 | |
| 61 | 124107 | Lençóis | 12,29 | 41,17 | 1942-2018 | 76 | -5,83 | *** | 0,89 | |
| 62 | 124300 | Sítio do Mato | 12,52 | 43,22 | 1912-2018 | 99 | -1,43 | 2,18 | * | |
| 63 | 124401 | Barreiras | 12,09 | 45,00 | 1937-2018 | 81 | 5,54 | *** | -1,49 | |
| 64 | 133904 | Nazaré | 13,01 | 39,01 | 1943-2018 | 75 | -0,79 | -1,41 | ||
| 65 | 133901 | Santa Inês | 13,17 | 39,49 | 1944-2018 | 74 | -1,09 | -0,01 | ||
| 66 | 134402 | S. Maria da Vitória | 13,16 | 44,33 | 1946-2018 | 69 | 2,33 | * | -1,64 | |
| 67 | 143906 | Gongogi | 14,19 | 39,28 | 1950-2018 | 68 | -1,68 | (+) | 1,07 | |
| 68 | 153906 | Itapebi | 15,57 | 39,31 | 1944-2018 | 74 | 4,89 | *** | 0,39 | |
| 69 | 153900 | Mascote | 15,33 | 39,18 | 1944-2018 | 74 | 0,08 | 1,11 | ||
| 70 | 173906 | Nova Viçosa | 17,48 | 39,39 | 1942-2018 | 76 | 2,68 | ** | 2,10 | * |
| 71 | 174005 | Medeiros Neto | 17,22 | 40,13 | 1953-2018 | 65 | 0,35 | 0,37 |
*** 99.9%, ** 99%, *95% and + 90% to detect whether or not there was a tendency in the Mann Kendall test.
Organization: Authors, 2020.
CONCLUSIONS
The analysis of the distribution of rainy days throughout the year is extremely important due to its high impact on phenomena such as floods, droughts, soil erosion and slope stability, but also on water management. In this work, a complete study of rainfall distribution in the Northeastern region was performed using a homogeneous database of daily measurements. Three parameters were applied: the Concentration Index (CI) to assess the distribution of rainy days, the Concentration Precipitation Index (PCI) to assess rainfall seasonality and the rainfall irregularity index. The results obtained with CI showed that there are areas where the parameter assumes values higher than 0.60, denoting rainfall concentration in this study area. There is daily rainfall concentration in much of this region, reflecting that few rainy days are leading to high percentage of annual rainfall.
The analysis of daily precipitation in the study area allows ensuring that one of the precipitation characteristics in northeastern Brazil is the high rainfall irregularity and concentration. High CI values demonstrate this and indicate that on some rainy days, a very significant percentage of all annual precipitation accumulates. The origin of this precipitation is linked to orography and the dominant climatic dynamics in this region, influenced by polar masses to the south, sea breezes on the coast and dynamics associated with the Intertropical Convergence Zone to the north. This rainfall irregularity is not the same throughout the study area.
The occurrence or not of large amounts of rainfall every day can change the character (dry or wet) of any month, season or year. This leads to considerable uncertainty in mean rainfall contributions, which in turn leads to environmental and social factors.
Thus, it was concluded that in the Northeastern region, the essential features of climate in different regions are characterized by narrow climatic zones close to the coast, under the combined influence of the sea. The soil relief, the latitude and the diversity of climates in this place lead to a very different rainfall distribution.
This region is also characterized by higher PCI values, suggesting higher seasonality of rainfall distribution throughout the year. With regard to soil and humans, the consequences of these results are greater vulnerability to both soil erosion and the risks of desertification in the study area.
Trend analysis using the Mann Kendall test indicates that many rainfall series have negative trend (nearly half of the analyzed series), but few have a statistically significant trend, which would actually represent a change in the pattern.

