


 nueva página del texto (beta)
 Inglés (pdf)
 Artículo en XML
 Referencias del artículo
 Enviar artículo por email
 Citado por SciELO
  Similares en
SciELO
Similares en
SciELO 
 Permalink
INTRODUCTION
The coronavirus disease 2019 (Covid-19) has significantly impacted everyday life worldwide (Hopkins, 2020; Sohrabi et al., 2020; Xu et al. 2020). Reason for transmission of COVID-19 is not yet clearly understood (Ghosh et al., 2020).
Covid-19 is a respiratory epidemic caused by the coronavirus Family (2019-nCoV). As it is a virus with a high contagion power (Andersen et al. 2020; Li et al. 2020; Yongjiana et al. 2020), and devastating action (Xi et al., 2020; Zhu et al., 2020), science has focused on investigating its characteristics (Lian et at. 2020; Rodriguez-Morales et al. 2020; Wang et al. 2020).
Based on recomendations provided by the World Health Organization (WHO, 2020a; WHOb, 2020), spontaneous quarantine was established in Brazil (i.e., citizens engaged in quarantine by their own initiave) since no formal lockdown had been adopted for most of the country, except specific states of Brazil such as Maranhão or Fortaleza.
Research has already tested the effect of weather aspects (Gutiérrez-Hernández & García, 2020; Saadat, Rawtani & Hussain, 2020; Tobias et al. 2020; Tosepu et al., 2020) and temperature (Bannister-Tyrrell et. al 2020; Ma et al., 2020; Shahzad et al., 2020) related to the speed of propagation of the virus (Al-Rousan & Al-Najjar, 2020; Bariotakis et.al, 2020; Bukhari & Jameel, 2020; Dantas et. al. 2020; Le et al. 2020; Liu et al. 2020). Surprisingly, there is still no consensus as to whether lower temperatures favor the spread of the virus in tropical countries, or whether higher temperatures are capable of decimating the vírus (Altamimi & Ahmed, 2019; Igbal et al. 2020)
According to Chan et.al. (2011), Alvarez-Ramirez and Meraz (2020), Araújo and Naimi (2020), Bashir et. al. (2020), Wang et. al. (2020) and Zhu and Xie (2020), the role played by temperature and humidity in the speed and in the spread of the vírus remains unclear. Motivated by the need to address this gap in current knowledge about different elements of the propagation of Covid-19, this research aims to answer the following research question: Does the relative humidity of the air influence the speed at which the virus spreads? To answer these research question, the current study has examined data collected in two representatives Brazilian regions: Amazonas (the capital is Manaus), considered one of the Brazilian cities with the highest average relative humidity; and Brasília, the capital of Brazil.
Brazil has over 500 municipalities, with Brasília and Manus being the 3rd and the 7th most populated (Brazilian Institute of Geography and Statistics, 2020). Brasília it is one of the Brazilian cities in which drought and low air humidity are more common during most of the year (National Institute of Meteorology (2020a). Between may and october, it has a characteristic desert climate, with low humidity and higher temperatures during the day. Differently, Manaus is wet and humid for most of the year (National Institute of Meteorology, 2020b). Additionally, Manaus concentrates the service given to indigenous populations in the Amazon, and is one of the most affected regions by forest fires during the summer months. As a consequence, respiratory problems, especially in children, are very common between may and september.
As cited earlier, many studies have observed that there are optimal temperature conditions that benefit the spreading of the coronavirus (e.g. Ma et al., 2020). We consider the discussion by Prata, Rodrigues and Bermejo (2020), signaling that the interaction between warmth and humidity is another interesting factor to investigate in tropical climate zones. Since Brazil has continental dimensions, it was decided to stratify data from two Brazilian capitals that differed in some weather conditions. Both cities are similar in most relevant parameters, except the average relative of the air and amount of rainfall.
MATERIALS AND METHODS
Study area
This study included 2 cities, Brasília and Manaus, two state capitals of Brazil. The Federal District is constituted by the capital of Brazil, Brasilia, and by some satellite cities located around Brasilia.
According to data from the Brazilian Institute of Geography and Statistics, the Federal District has an estimated population of 3,015,268 people. In the last demographic census, in 2010, Brasília had approximately 560 thousand people.
Manaus, located in the North of Brazil, is the capital of the state of Amazonas. According to BIGS data, Amazonas has an estimated population of 4,144,597 people. Much of this population is indigenous. Manaus, capital of the state, had a population in 2010 of approximately 1.802.014 people.
This paper is focused on these two Brazilian capital cities because of the difference, in terms of humidity, between them. Figure 1 shows a map with the location of the cities of the study and presents as the basis of the map the types of climate of the spaces where these cities are located.

Figura 1 Types of climate in Brasília (DF) and Manaus (AM). Source: Brazilian Institute of Geography and Statistics IBGE (cnae.ibge.gov.br).
Manaus, with 11.401 km², is the most populous city in Amazonas, in the North Region and in the entire Brazilian Amazon. It is considered the most influential city in the so-called Western Amazon. It is the city that has a significant impact on the performance of activities related to trade in the region, as well as industry, research and technology activities throughout the region. It is considered a regional metropolis. The climate of Manaus is considered to be a humid tropical monsoon, with an average annual temperature of 27°C and relatively high humidity, with annual rainfall around 2,300 millimeters (mm). The proximity to the Amazon rainforest usually avoids extreme heat spikes and makes the city humid.
Brasília is the federal capital of Brazil and the seat of government of the Federal District. The capital is located in the Midwest region of the country, on the central plateau. Brasília is the house of the executive, legislative and judiciary powers. It has the largest listed area in the world, with approximately 112.5 square kilometers. According to data from the National Institute of Meteorology, the climate in Brasilia is tropical with a dry season, with average monthly temperatures always above 18 ° C and annual rainfall of approximately 1.480 mm (mm). During the dry season (April to September), it is common for the relative humidity levels to be often below 30%, well below the ideal considered by the World Health Organization (WHO, 2005), of 60%.
Data collection
The study population is the daily number of cumulative confirmed cases of Covid-19 in the 2 state capital cities, as officially reported by the Ministry of Health of Brazil (Brazilian Ministry of Health, 2020a) from April 14 to June 3, 2020. Data regarding the number of infected by Covid-19, the number of new cases and the cumulative number of deaths were extracted through the ministry’s official website (Brazilian Social Isolation Index, 2020). Meteorological data (humidity, minimum temperature, maximum temperature and amount of rainfall) were collected from the National Institute of Meteorology authority (National Institute of Meteorology, 2020b), in Brazil.
Data related to the percentage of social isolation in the cities of Brasília and Manaus were collected from the Brazilian map of Covid-19 (Brazilian Ministry of Health, 2020b), through the daily index of social isolation. This index is updated daily, and is used officially by Brazilian governors, in order to monitor the level of social isolation in the municipalities of which they govern. All data were collected daily, during the 51 days of extraction of dates and longitudinal analysis that were contemplated during this research.
Statistical analysis
A descriptive analysis was performed, with numerical variables described using means, standard deviations, and distributions. Student’s t test was used to compare two independent samples (data from Manaus and Brasília). A linear regression model (LRM) was used to calculate the relationships between meteorological and geographic data (low temperatures, high temperatures, humidity and daily amount of rainfall), the percentage of social isolation by city and daily data updated by the Ministry of Health of the government of Brazil on the situation of Covid-19 (number of new cases and number of accumulated deaths) in these two cities (Brasília and Manaus).
RESULTS AND DISCUSSION
Descriptive analysis
Table 1 shows, comparatively, the daily cumulative meteorological evolution by the indicators of temperature (low or high), amount of rainfall and humidity in the period between april 14 and june 3, 2020. The data are collected daily (Brazilian Institute of Geography and Statistics, 2020), comparing indicators of Brasília and Manaus. It is observed (National Institute of Meteorology, 2020a) that Brasília started to suffer the effects of the dry period, whereas Manaus was characterized as a rainy period, in which temperatures were higher than Brasília.
Table 1 Daily cumulative meteorological evolution in Brasília/DF and Manaus/AM.
| Brasília | Manaus | |||||||
| hightemp | lowtemp | Rh | Pi | hightemp | lowtemp | Rh | Pi | |
| 14 April 2020 | 26.9 | 18.9 | 55 | 0 | 30.6 | 23.4 | 67 | 16.2 |
| 15 April 2020 | 22.9 | 17.5 | 95 | 0.1 | 31.2 | 24.5 | 66 | 0 |
| 16 April 2020 | 21.2 | 17.8 | 87 | 31 | 31.4 | 25.8 | 67 | 0 |
| 17 April 2020 | 26.7 | 17.7 | 67 | 4.7 | 32 | 24.8 | 64 | 0.8 |
| 18 April 2020 | 25.1 | 18.9 | 71 | 7.5 | 26.5 | 23.6 | 78 | 3 |
| 19 April 2020 | 26.1 | 18.9 | 66 | 0 | 32 | 23.9 | 60 | 0.1 |
| 20 April 2020 | 24.5 | 19 | 67 | 0 | 31.2 | 25.2 | 91 | 0 |
| 21 April 2020 | 24.1 | 17.8 | 87 | 2.1 | 33 | 24.2 | 60 | 27.2 |
| 22 April 2020 | 23.7 | 17.8 | 91 | 8 | 31.1 | 25.6 | 72 | 0 |
| 23 April 2020 | 23.3 | 18.9 | 88 | 22.7 | 32.3 | 25.4 | 84 | 0 |
| 24 April 2020 | 25.5 | 19 | 75 | 30.2 | 32.8 | 25.2 | 70 | 1.1 |
| 25 April 2020 | 25 | 16.9 | 59 | 0 | 26.8 | 23.2 | 96 | 17.2 |
| 26 April 2020 | 24.8 | 14.7 | 54 | 0 | 32.3 | 23.4 | 61 | 160.8 |
| 27 April 2020 | 25.3 | 16.2 | 50 | 0 | 32.4 | 25.5 | 66 | 0 |
| 28 April 2020 | 25.1 | 15.6 | 52 | 0 | 31.1 | 23.9 | 74 | 24.8 |
| 29 April 2020 | 25.4 | 13.4 | 45 | 0 | 33.1 | 24.5 | 59 | 0.5 |
| 30 April 2020 | 25.7 | 14 | 49 | 0 | 32.1 | 26.2 | 65 | 0 |
| 01 May 2020 | 26.5 | 13.9 | 45 | 0 | 33.1 | 25.7 | 62 | 12.8 |
| 02 May 2020 | 21.3 | 13.4 | 39 | 0 | 32.1 | 25.9 | 95 | 1.1 |
| 03 May 2020 | 27.7 | 13.1 | 35 | 0 | 32.8 | 24.9 | 63 | 3.9 |
| 04 May 2020 | 27.2 | 13.2 | 33 | 0 | 32.1 | 24.2 | 65 | 4.9 |
| 05 May 2020 | 28.5 | 14 | 39 | 0 | 31.7 | 25.6 | 78 | 0 |
| 06 May 2020 | 27.5 | 15.5 | 41 | 0 | 26 | 23.4 | 83 | 1.6 |
| 07 May 2020 | 23.6 | 17.2 | 69 | 0 | 31.7 | 24 | 73 | 26.2 |
| 08 May 2020 | 24.1 | 17.1 | 64 | 0.2 | 30.8 | 23.7 | 64 | 3.8 |
| 09 May 2020 | 21.8 | 16 | 66 | 0 | 31.9 | 24.9 | 56 | 0.1 |
| 10 May 2020 | 24.9 | 14.8 | 53 | 0 | 32.8 | 25.2 | 72 | 9.4 |
| 11 May 2020 | 25.2 | 12.8 | 41 | 0 | 32.8 | 25.3 | 61 | 24.4 |
| 12 May 2020 | 24.9 | 13.9 | 50 | 0 | 32.8 | 24.8 | 63 | 32.4 |
| 13 May 2020 | 26.6 | 14.5 | 56 | 0 | 31.1 | 24.8 | 79 | 0.2 |
| 14 May 2020 | 25.9 | 15 | 71 | 0 | 29.8 | 24.3 | 94 | 1.4 |
| 15 May 2020 | 25.5 | 16.9 | 61 | 5.9 | 33.2 | 24.9 | 58 | 29.4 |
| 16 May 2020 | 26.3 | 17.6 | 78 | 1.5 | 33 | 25.6 | 61 | 4.2 |
| 17 May 2020 | 24.3 | 15.8 | 68 | 18.8 | 32.1 | 25.8 | 79 | 1.1 |
| 18 May 2020 | 25.2 | 16.1 | 61 | 0 | 33.3 | 25.6 | 84 | 0 |
| 19 May 2020 | 23.1 | 16 | 60 | 0 | 29.5 | 25.2 | 80 | 30.6 |
| 20 May 2020 | 22.1 | 16.7 | 70 | 0 | 32.7 | 25 | 64 | 21.2 |
| 21 May 2020 | 26.1 | 14.6 | 48 | 0 | 33.5 | 25.4 | 60 | 0 |
| 22 May 2020 | 26.1 | 15.3 | 57 | 0 | 33 | 25.4 | 63 | 0 |
| 23 May 2020 | 27.7 | 16.6 | 47 | 0 | 32.1 | 25.4 | 68 | 6 |
| 24 May 2020 | 26.5 | 17.6 | 53 | 0.3 | 29.9 | 24.4 | 72 | 72.3 |
| 25 May 2020 | 26 | 17.6 | 58 | 0.2 | 30.8 | 24.8 | 68 | 0 |
| 26 May 2020 | 25.3 | 14.1 | 44 | 0 | 31.2 | 24.9 | 68 | 0 |
| 27 May 2020 | 26.8 | 9.3 | 31 | 0 | 32.4 | 25.9 | 58 | 0 |
| 28 May 2020 | 26.3 | 10.1 | 39 | 0 | 32.6 | 25.8 | 60 | 0 |
| 29 May 2020 | 24.1 | 10.5 | 39 | 0 | 33 | 25.9 | 62 | 0 |
| 30 May 2020 | 23.3 | 10.3 | 44 | 0 | ** | ** | ** | 0 |
| 31 May 2020 | 25.1 | 9.4 | 41 | 0 | ** | ** | ** | 0 |
| 01 June 2020 | 26 | 12.7 | 40 | 0 | 28.7 | 23.2 | 92 | 0.2 |
| 02 June 2020 | 26.2 | 13.3 | 43 | 0 | 31.3 | 23.8 | 66 | 23 |
| 03 June 2020 | 27.9 | 14.4 | 41 | 0 | 32.3 | 25.4 | 66 | 0 |
| Minimum | 25.0 | 14.0 | 31.0 | 0.0 | 26.0 | 24.0 | 56.0 | 0.0 |
| Maximum | 26.0 | 19.0 | 95.0 | 31.0 | 33.0 | 25.0 | 96.0 | 23.0 |
| Average | 25.7 | 16.1 | 56.5 | 1.0 | 31.7 | 24.5 | 70.1 | 1.5 |
| St. deviation | 0.58 | 2.12 | 16.11 | 5.09 | 2.56 | 0.71 | 10.77 | 5.01 |
| Median | 26.0 | 16.0 | 54.0 | 0.0 | 33.0 | 24.5 | 66.0 | 0.0 |
Note. *high temp = high temperature (°C); low temp = low temperature (°C); rh = relative humidity of the air (%); pi = amount of rainfall (mm); ** = not informed
Table 2 shows the daily cumulative the confirmed cases of Covid-19, new cases, confirmed deaths, new deaths and the percentage of social isolation from april 14 to june 3, 2020. The data about the social isolation (Brazilian Social Isolation Index, 2020) too were collected daily, comparing indicators of Brasília and Manaus.
Table 2 Daily cumulative indicators about Covid-19 in Manaus/AM and Brasília/DF.
| Brasília | Manaus | |||||||||
| Cf | Nc | Cd | Nd | Si | Cf | Nc | Cd | Nd | Si | |
| 14 April 2020 | 651 | 13 | 17 | 2 | 46,8 | 1295 | 189 | 81 | 19 | 52,4 |
| 15 April 2020 | 682 | 31 | 17 | 0 | 47,5 | 1350 | 55 | 92 | 11 | 52,7 |
| 16 April 2020 | 716 | 34 | 20 | 3 | 45,7 | 1459 | 109 | 107 | 15 | 49,0 |
| 17 April 2020 | 746 | 30 | 20 | 0 | 43,5 | 1531 | 72 | 127 | 20 | 50,1 |
| 18 April 2020 | 762 | 16 | 24 | 4 | 47,8 | 1593 | 62 | 134 | 7 | 53,7 |
| 19 April 2020 | 827 | 65 | 24 | 0 | 54,2 | 1664 | 71 | 156 | 22 | 60,2 |
| 20 April 2020 | 872 | 45 | 24 | 0 | 46,3 | 1772 | 108 | 156 | 0 | 52,5 |
| 21 April 2020 | 881 | 9 | 24 | 0 | 53,6 | 1809 | 37 | 163 | 7 | 56,3 |
| 22 April 2020 | 946 | 65 | 25 | 1 | 45,0 | 1958 | 149 | 172 | 9 | 50,4 |
| 23 April 2020 | 963 | 17 | 25 | 0 | 45,8 | 2286 | 328 | 193 | 21 | 51,2 |
| 24 April 2020 | 989 | 26 | 26 | 1 | 43,3 | 2481 | 195 | 207 | 14 | 50,7 |
| 25 April 2020 | 1013 | 24 | 26 | 0 | 46,1 | 2678 | 197 | 233 | 26 | 56,7 |
| 26 April 2020 | 1066 | 53 | 27 | 1 | 52,8 | 2722 | 44 | 246 | 13 | 57,8 |
| 27 April 2020 | 1146 | 80 | 27 | 0 | 44,5 | 2738 | 16 | 256 | 10 | 50,3 |
| 28 April 2020 | 1213 | 67 | 28 | 1 | 44,1 | 2899 | 161 | 274 | 18 | 50,3 |
| 29 April 2020 | 1275 | 62 | 28 | 0 | 43,0 | 3091 | 192 | 288 | 14 | 48,4 |
| 30 April 2020 | 1356 | 81 | 30 | 2 | 42,1 | 3273 | 182 | 312 | 24 | 47,9 |
| 01 May 2020 | 1466 | 110 | 30 | 0 | 49,3 | 3491 | 218 | 357 | 45 | 52,9 |
| 02 May 2020 | 1566 | 100 | 31 | 1 | 44,4 | 3658 | 167 | 368 | 11 | 50,7 |
| 03 May 2020 | 1649 | 83 | 33 | 2 | 49,6 | 4072 | 414 | 396 | 28 | 54,0 |
| 04 May 2020 | 1768 | 119 | 33 | 0 | 43,7 | 4344 | 272 | 418 | 22 | 48,3 |
| 05 May 2020 | 1818 | 50 | 33 | 0 | 42,4 | 4804 | 460 | 459 | 41 | 47,4 |
| 06 May 2020 | 1906 | 88 | 34 | 1 | 42,2 | 5474 | 670 | 532 | 73 | 49,2 |
| 07 May 2020 | 2258 | 352 | 35 | 1 | 42,9 | 5897 | 423 | 563 | 31 | 48,0 |
| 08 May 2020 | 2442 | 184 | 37 | 2 | 40,1 | 6034 | 137 | 604 | 41 | 46,8 |
| 09 May 2020 | 2576 | 134 | 39 | 2 | 42,5 | 6743 | 709 | 660 | 56 | 48,5 |
| 10 May 2020 | 2682 | 106 | 42 | 3 | 45,4 | 7198 | 455 | 680 | 20 | 50,0 |
| 11 May 2020 | 2783 | 101 | 44 | 2 | 42,9 | 7264 | 66 | 691 | 11 | 49,0 |
| 12 May 2020 | 2979 | 196 | 46 | 2 | 42,8 | 7877 | 613 | 726 | 35 | 48,7 |
| 13 May 2020 | 3192 | 213 | 48 | 2 | 42,1 | 8630 | 753 | 757 | 31 | 49,1 |
| 14 May 2020 | 3416 | 224 | 51 | 3 | 41,9 | 9410 | 780 | 809 | 52 | 47,9 |
| 15 May 2020 | 3787 | 371 | 55 | 4 | 41,2 | 9713 | 303 | 888 | 79 | 46,4 |
| 16 May 2020 | 4140 | 353 | 56 | 1 | 44,7 | 10297 | 584 | 920 | 32 | 49,1 |
| 17 May 2020 | 4368 | 228 | 59 | 3 | 51,8 | 10407 | 110 | 949 | 29 | 55,1 |
| 18 May 2020 | 4619 | 251 | 66 | 7 | 42,5 | 10660 | 253 | 951 | 2 | 48,1 |
| 19 May 2020 | 4853 | 234 | 72 | 6 | 42,1 | 11051 | 391 | 999 | 48 | 46,9 |
| 20 May 2020 | 5161 | 308 | 77 | 5 | 41,2 | 11643 | 592 | 1057 | 58 | 45,3 |
| 21 May 2020 | 5542 | 381 | 84 | 7 | 41,2 | 12317 | 674 | 1094 | 37 | 45,6 |
| 22 May 2020 | 5948 | 406 | 90 | 6 | 39,9 | 12967 | 650 | 1127 | 33 | 44,3 |
| 23 May 2020 | 6251 | 303 | 95 | 5 | 43,3 | 13624 | 657 | 1176 | 49 | 48,6 |
| 24 May 2020 | 6638 | 387 | 104 | 9 | 51,4 | 13881 | 257 | 1182 | 6 | 51,9 |
| 25 May 2020 | 6930 | 292 | 114 | 10 | 42,1 | 13979 | 98 | 1190 | 8 | 44,7 |
| 26 May 2020 | 7210 | 280 | 124 | 10 | 41,1 | 14402 | 423 | 1248 | 58 | 44,3 |
| 27 May 2020 | 7761 | 551 | 133 | 9 | 40,5 | 14800 | 398 | 1272 | 24 | 43,9 |
| 28 May 2020 | 8300 | 539 | 142 | 9 | 40,8 | 15769 | 969 | 1314 | 42 | 43,9 |
| 29 May 2020 | 8722 | 422 | 154 | 12 | 39,2 | 17492 | 1723 | 1349 | 35 | 42,2 |
| 30 May 2020 | 9474 | 752 | 162 | 8 | 42,3 | 18139 | 647 | 1366 | 17 | 44,3 |
| 31 May 2020 | 9780 | 306 | 170 | 8 | 49,5 | 18293 | 154 | 1366 | 0 | 50,7 |
| 01 June 2020 | 10510 | 730 | 171 | 1 | 40,8 | 18367 | 74 | 1371 | 5 | 43,8 |
| 02 June 2020 | 11256 | 746 | 177 | 6 | 40,4 | 18981 | 614 | 1390 | 19 | 41,7 |
| 03 June 2020 | 12251 | 231 | 179 | 2 | 39,5 | * | * | * | * | 40,4 |
| Minimum | 651.0 | 9.0 | 17.0 | 0.0 | 39.2 | 1295.0 | 16.0 | 81.0 | 0.0 | 40.4 |
| Maximum | 12251.0 | 752.0 | 179.0 | 12.0 | 54.2 | 18981.0 | 1723.0 | 1390.0 | 79.0 | 60.2 |
| Average | 3766.8 | 212.7 | 63.4 | 3.2 | 44.3 | 7765.5 | 357.5 | 668.5 | 26.6 | 49.1 |
| St. deviation | 3231.9 | 196.6 | 49.9 | 3.3 | 3.8 | 5618.4 | 316.3 | 445.4 | 18.7 | 4.2 |
| Median | 2576.0 | 134.0 | 39.0 | 2.0 | 43.0 | 6388.5 | 255.0 | 632.0 | 22.0 | 49.0 |
Note. cf = confirmed cases (absolute frequency); nc = new cases (absolute frequency); cd = confirmed deaths (absolute frequency); nd = new deaths (absolute frequency); si = percentage of social isolation (%); *not informed.
Data about the number of recovered and the number of cases being monitored were not available when the information was extracted from the Brazilian government databases. It should be noted that the average percentage of social isolation was around 45% on average. The number of new infections and deaths has been growing exponentially over the days. The rapid spread of the virus justified the need to adopt quarantine (social isolation) as the main strategy of prevention.
Figure 2 regards the frequency of confirmed cases over 51 days. The red and blue lines on the graph on the right show a steep increase in the number of confirmed cases over 51 days. The red line on the graph on the left shows a linear decrease in the number of confirmed cases as the level of social isolation increases. The blue line on the graph on the left shows a quadratic trend where the number of confirmed cases is at its highest value for extreme low and extreme high levels of social isolation.

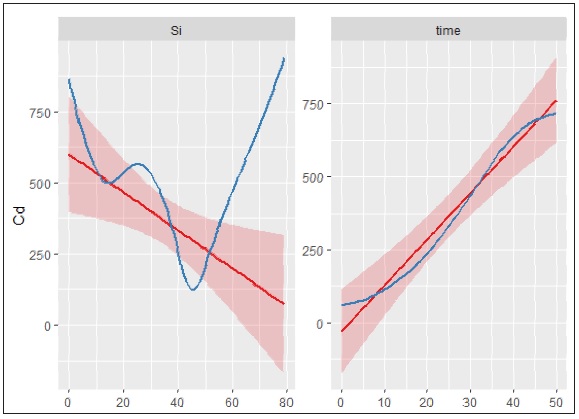
Figure 3 regards the frequency of confirmed deaths over 51 days. The red and blue lines on the graph on the right show a steep increase in the number of confirmed deaths over 51 days. The red line on the graph on the left shows a linear decrease in the number of confirmed deaths as the level of social isolation increases. The blue line on the graph on the left shows a quadratic trend where the number of confirmed deaths is at its highest value for extreme low and extreme high levels of social isolation.
According to the data showed in Table 3, the lowest average temperature in Brasília was 15.34° C, while in Manaus it was 24.85°C. The highest average temperature in Brasília was 25.23° C and in Manaus 31.59° C. The average of the humidity was, in general, higher more in Manaus than Brasília. The average of the humidity relative of the air in Brasília was 58.53%, and 70.14% in Manaus. Data are showed in Tables 3 and 4 .
Table 3 Statistics descriptives of date from Brasília/DF.
| Variables | Mean | Standard error | Number of observations |
| Population | 3015268.00 | .000 | 51 |
| Accumuled cases | 3766.78 | 3231.937 | 51 |
| New cases | 212.73 | 196.596 | 51 |
| Confirmed deaths | 63.37 | 49.863 | 51 |
| Percentage of social isolation (%) | 44.310 | 3.7932 | 51 |
| Low Temperature (°C) | 15.339 | 2.5828 | 51 |
| High Temperature (°C) | 25.233 | 1.6764 | 51 |
| Humidity (%) | 58.53 | 16.111 | 51 |
| Amount of rainfall (mm) | 2.612 | 7.1804 | 51 |
Table 4 Statistics descriptives of date from Manaus/AM.
| Variables | Mean | Standard error | Number of observations |
| Population | 2182763.00 | .000 | 51 |
| Accumuled cases | 7.765.54 | 5618.418 | 50 |
| New cases | 357.50 | 316.311 | 50 |
| Confirmed deaths | 668.52 | 445.364 | 50 |
| Percentage of social isolation (%) | 49.065 | 4.1677 | 51 |
| Low Temperature (°C) | 24.845 | .8334 | 49 |
| High Temperature (°C) | 31.592 | 1.6970 | 49 |
| Humidity (%) | 70.14 | 10.766 | 49 |
| Amount of rainfall (mm) | 11.018 | 25.4144 | 51 |
In order to compare the indicators raised between the two cities, we decided to run comparative tests between them. As the data refer to specific indicators for each city, without any dependence or complementarity between them, the t test was used to compare independent samples. Table 5 shows the Student’s t test was used to compare two independent samples (data from Manaus and Brasília).
Table 5 Analysis of variance with test t comparing data from Manaus and Brasília.
| 95% confidence interval of the difference |
||||||
| F | Sig. | t | df | Lower | Upper | |
| percentage of social isolation | .123 | .725 | 6.026 | 100 | 3.19 | 6.32 |
| temperature minimum | 40.425 | .000 | 24.559 | 98 | 8.74 | 10.27 |
| temperature maximum | .128 | .721 | 18.847 | 98 | 5.69 | 7.03 |
| humidity | 8.141 | .005 | 4.947 | 98 | 8.15 | 19.07 |
| amount of rainfall | 10.941 | .001 | 2.273 | 100 | 1.07 | 15.74 |
| confirmed cases | 23.439 | .000 | 4.395 | 99 | 2193.47 | 5804.04 |
| conffirmed deaths | 152.743 | .000 | 9.643 | 99 | 480.63 | 729.66 |
There was difference statistically significant between indicators related to low temperature, humidity, amount of rainfall, confirmed cases of Covid-19 and confirmed deaths of Covid-19.
Only high temperature did’not show a statistically significant difference between Brasília and Manaus.
According to discussion provided by Gutiérrez-Hernández and García (2020) and Iqbal et al. (2020), our results suggest that there is possible relationship between the weather and the number of deaths related to Covid-19. In Table 6 we present the averages obtained for Brasília and Manaus, with the t test, as well as the size of the ‘Cohen’s d effect’ for independent samples.
Table 6 Averages with test t and Cohen´s d effect size.
| Manaus | Brasília | ||||||
| N | Mean | Standard error | N | Mean | Standard error | Cohen’s d | |
| Percentage of social isolation | 51 | 49.065 | 4.1677 | 51 | 44.310 | 3.7932 | .05972 |
| Temperature minimum | 49 | 24.845 | .8334 | 51 | 15.339 | 2.5828 | .27538 |
| Temperature maximum | 49 | 31.592 | 1.6970 | 51 | 25.233 | 1.6764 | .01911 |
| Humidity | 49 | 70.14 | 10.766 | 51 | 56.53 | 16.111 | .05043 |
| Amount of rainfall | 51 | 11.018 | 25.4144 | 51 | 2.612 | 7.1804 | .02579 |
| Confirmed cases | 50 | 7765.54 | 5618.418 | 51 | 3766.78 | 3231.937 | .04530 |
| Conffirmed deaths | 50 | 668.52 | 445.364 | 51 | 63.37 | 49.863 | .12319 |
We then decided to check the indicators of correlation between the variables analised. We want to identify their degree of relationship between the two cities analyzed. We decided to present Pearson’s correlation, indicating that there is linearity between the indicators. Pearson´s indicators Table 6. Averages with test t and Cohen´s d effect size. were stronger than Spearman´s. Table 7 shows the Pearson’s correlation coefficients among the variables.
Table 7 Pearson’s correlation coefficients among the variables.
| Cd | Si | Mintemp | Maxtemp | Rh | Pi | Cf | Nc | Pp | |
| Cd | 1 | ||||||||
| Si | .050 | 1 | |||||||
| Mintemp | .640** | .528** | 1 | ||||||
| Maxtemp | .643** | .416** | .823** | 1 | |||||
| Rh | .248* | .411** | .609** | .176 | 1 | ||||
| Pi | .110 | .327** | .213* | .180 | .141 | 1 | |||
| Cf | .877** | -.234* | .266** | .389** | -.028 | .009 | 1 | ||
| Nc | .539** | -.268** | .168 | .288** | -.080 | -.096 | .653** 1 | ||
| Pp | -.696** | -.516** | -.927** | -.885** | -.447** | -.222* | -.404** -.2 | 68** | 1 |
Note. cd = confirmed deaths; si = percentage of social isolation; min temp = low temperature; max temp = high temperature; rh = humidity; pi = amount of rainfall cf = confirmed cases; nc = ne cases; pp = population; **p<.001; *p<.005.
The higher temperatures were correlated significantly with new cases of Covid-19 (r=.288). Low temperatures were correlated positively with confirmed deaths by Covid-19 (r=.640). New cases are correlated negatively with the percentage of social isolation (r=, -.268). These findings are similar to others findings (Bashir et al., 2020; Liu et.al., 2020).
The data sugests that the lower the percentage of isolation, the greater the tendency to be infected by Covid-19. Whereas causality assumptions can not be made with the scores of correlations, these results suggest that some indicators could explain the number of confirmed deaths from Covid-19 in both Brazilian cities
To further address the research question outlined in the introduction of this study, a linear regression model was tested. The dependent variable was defined as the ‘number of accumulated deaths’ and all other indicators (meteorological, geographical and social) were tested as independent variables. The goal was to identify whether some of the indicators measured could be predictors of the number of deaths accumulated over the 51 days of observation and information collection in Brasília and Manaus. The data are shown in Table 8.
Table 8 Regression coefficients for the model.
| B | Standard error | Β | T | Sig. | |
| Constant | -286.691 | 472.233 | - | -.607 | .545 |
| Si | -23.978 | 7.916 | -.254** | -3.029 | .003 |
| Lowtemp | 45.165 | 16.722 | .532** | 2.701 | .008 |
| Hightemp | 24.166 | 19.614 | .200 | 1.232 | .221 |
| Rh | .271 | 3.268 | .009 | .083 | .934 |
| Pi | 1.709 | 1.508 | .075 | 1.133 | .260 |
| Nc | .535 | .117 | .332*** | 4.584* | .000 |
Note: r = .763; r2 = .646; r2 adjusted= .623 **p < 0.01; Note. Dependent variable: cd (confirmed deaths of Covid-19); si = percentage of social isolation; min temp = low temperature; max temp = high temperature; rh = humidity; pi = amount of rainfall; nc = new cases.
The only statistically significant predictors of the cumulative number of Covid-19 deaths were the percentage of social isolation (β = -.254) and the daily record of new cases of the vírus (β = .332). The R-squared of was 0.646, the adjusted R-squared was .623. No wheater indicator contributed significantly to the prediction of the number of accumulated deaths resulting from Covid-19 in Brasília and Manaus.
It is noted, on the other hand, that the negative Beta in the percentage of social isolation suggests that it is a predictor of the number of accumulated deaths resulting from Covid-19 in Brasília and Manaus. This corroborates, according to the recommendations of WHO (2020a) and WHO (2020b), the importance of adopting the strategy of preventing to the contagion adopting social isolation.
It is noteworthy remember that in none of these cities, Manaus and Brasília, the lockdown strategy was yet adopted. Findings suggest, according to Shahzad et. al. (2020), Tosepu et. al. (2020), Wang et. al. (2020) and Zhu and Xie (2020), that wheather factors have a reasonable contribution to explaining the behavior of the Covid-19, at least for this model tested. Although the correlations suggested that there was an influence between wheather indicators with the number of deaths by Covid-19, none of these indicators contributed significantly as a predictor in the tested model. Obviously, new research needs to be done in order to test these predictive relationships in other Brazilian cities that have less or more humidity relative of the air.
CONCLUSIONS AND RECOMENDATIONS
We conducted this research considering two theoretical premises: the first one, about the importance of trying to understand the behavior of Covid-19 in two Brazilian cities whose percentage of relative humidity was very diferente between them; and the second, considering the lack of a study of Covid-19 in tropical climate countries.
To achieve our purpose, we explored linear relationships between wheather indicators (low temperatures, high temperatures, humidity and amount of rainfall), social indicators (rate of social isolation) and indicators related to the contagy and spread of dissemination of Covid-19 (number of new cases, number of confirmed cases and number accumulated deaths) over 51 days of observation and recording of secondary information.
We built a generalized linear model to better understand the behavior of the growth curve of Covid-19 and the role of each factor to explain trends. The linear model predicted R-square adjusted was a reasonable 0.623., indicating that the model explains approximately 62% of Covid-19 confirmed cases in Manaus and Brasília.
Of course, there are other factors that may contribute to explain the increase in the number of Covid-19 cases in Brasília and Manaus. Can air quality influence the speed at which the virus spreads? Can air pollution influence the speed of propagation of Covid-19? In metropolitan regions is the speed of spread of the virus greater than in regions of more isolated forests?
The effectiveness of public policies in each state, for example, can also be an antecedent variable. Social isolation, use of masks and social distance are the main strategy to prevent the vírus in Brazil. In regions where commercial activities have already resumed, is the speed of propagation and contamination of the virus greater?
The T test showed that there are differences in the behavior of the data due to being in Brasília or Manaus. Therefore, specificities between these two regions need to be tested again. The spread of Covid-19 in Brazil is very fast, so the results of this study will be useful in efforts to prevent the spread of Covid-19 disease.
DECLARATION OF CONFLICTS OF INTEREST
The authors declared that they have no conflict of interests.
FUNDING
This research did not receive any specific grant from funding agencies in the public, commercial, or not-for-profit sectors.

