


Servicios Personalizados
Revista
Articulo
 texto en
  Inglés (pdf)
 Artículo en XML
 Referencias del artículo
 Enviar artículo por email
Indicadores
-
 Citado por SciELO
 -
 Accesos
Links relacionados
-
 Similares en
SciELO
Similares en
SciELO
Compartir

 Permalink
Investigaciones geográficas
versión On-line ISSN 2448-7279versión impresa ISSN 0188-4611
Invest. Geog no.104 Ciudad de México abr. 2021 Epub 20-Sep-2021
https://doi.org/10.14350/rig.60140
Articles
An Index of Vulnerability to COVID-19 in Mexico
1
 http://orcid.org/0000-0002-9441-3716
2
http://orcid.org/0000-0003-3525-7642
1
http://orcid.org/0000-0001-7868-8667
1
http://orcid.org/0000-0003-4481-6768
1
http://orcid.org/0000-0003-4948-1557
1
http://orcid.org/0000-0003-0794-1201
3
http://orcid.org/0000-0001-9936-8427
1
http://orcid.org/0000-0002-4146-9193
5
http://orcid.org/0000-0002-2467-5673
6
http://orcid.org/0000-0002-0355-0337
1
http://orcid.org/0000-0001-6370-1304
4
http://orcid.org/0000-0002-0255-8206
1
http://orcid.org/0000-0001-9354-2893
1Instituto de Geografía, Universidad Nacional Autónoma de México. Correo-e: msuarez@igg.unam.mx, carlosgp@igg.unam.mx, enrique_saguz@hotmail.com, nruiz@igg.unam.mx, irasema@igg.unam.mx, anarosa@igg.unam.mx, mela_jg@igg.unam.mx, orooro@igg.unam.mx, aperalta@igg.unam.mx, garnica@igg.unam.mx.
2Instituto de Geofísica, Universidad Nacional Autónoma de México. Correo-e: carlos.valdes@unam.mx.
3Facultad de Medicina, Universidad Nacional Autónoma de México. Correo-e: mlopezcervantes@unam.mx.
4Facultad de Ciencias, Universidad Nacional Autónoma de México. Correo-e: act.arturo.b@ciencias.unam.mx.
5Coordinación de la Investigación Científica, Universidad Nacional Autónoma de México. Correo-e: wlee@astro.unam.mx.
6Instituto de Investigaciones en Matemáticas Aplicadas y en Sistemas, Universidad Nacional Autónoma de México. Correo-e: hector.benitez@iimas.unam.mx.
We developed a municipal-level index of vulnerability to COVID-19 for Mexico. The index combines three dimensions of vulnerability: demography, health, and socio-economic conditions. Each dimension is, in turn, described by various indicators related to the type of vulnerability and exposure they reflect. By applying the index to the country’s 2 457 municipalities, we can examine the spatial distribution of both the factors that foster greater susceptibility to damage, and the adverse consequences for people. The resulting information facilitates science-based decision-making.
The vulnerability index values are categorized into four levels: Medium, High, Very High and Critical. A medium vulnerability level occurs mainly in large urban centers having the best healthcare infrastructure and the highest economic capacity; 63.2% of the population in Mexico live in medium vulnerability municipalities. A high vulnerability occurs in municipalities containing mid-sized urban areas, with a proportion of indigenous language speakers and a marginalization level slightly lower than the national average, and poor healthcare infrastructure; 17.6% of the population in Mexico live in these municipalities. A very high vulnerability is found in municipalities where 11.7% of the population lives. These municipalities contain small urban areas, have a marginalization level, and a proportion of indigenous language speakers above the national average, very poor healthcare infrastructure, greater overcrowding than in the first two categories, households with few communication means, and precarious economic production in. A critical vulnerability occurs in municipalities that concentrate 7.5% of the population in Mexico. These are primarily rural municipalities with a high proportion of people over 60 years old, a significant proportion of indigenous language speakers, critically insufficient healthcare services, a marginalization level well above the national average, the highest level of overcrowding, the lowest access to communication means, and a very precarious economy.
Based on these results, recommendations are made for measures that must be taken at the territorial level in order to mitigate the potential impact of COVID-19 on Mexican society.
Key words: pandemic; COVID-19; exposure; vulnerability; municipalities; public policy
Se elaboró un índice de vulnerabilidad ante el COVID-19 para México a escala municipal (2,457 municipios) que permite identificar la distribución espacial de los diferentes factores que generan mayor susceptibilidad al daño o las consecuencias adversas que pueden tener las personas. El índice integra tres dimensiones de vulnerabilidad: demográfica, de salud y socioeconómica. A su vez, cada dimensión integra una serie de indicadores relacionados con el tipo de vulnerabilidad y exposición que expresan. La información resultante contribuye a la toma de decisiones sustentada en bases científicas.
El índice de vulnerabilidad está clasificado en cuatro grados: Medio, Alto, Muy Alto y Crítico. El grado medio de vulnerabilidad se encuentra principalmente en los grandes centros urbanos que cuentan con la mayor infraestructura de salud, y la mayor capacidad económica. 63.2% de la población vive en municipios con vulnerabilidad media. El grado alto de vulnerabilidad se presenta en municipios con localidades urbanas de tamaño medio, y con una proporción de población hablante de lengua indígena ligeramente menor a la media nacional. La infraestructura de salud es escasa. Su marginación se encuentra ligeramente debajo del promedio nacional; 17.6% de la población nacional reside en estos municipios. El grado muy alto de vulnerabilidad se observa en municipios que concentran 11.7% de la población nacional. Se trata de municipios de marginación por encima del promedio nacional con áreas urbanas pequeñas. El porcentaje de población hablante de lengua indígena se encuentra por arriba del promedio nacional. La infraestructura de salud es muy escasa, con una tasa de hacinamiento mayor a las primeras dos categorías. Los hogares cuentan con pocos medios de comunicación, y la producción económica es precaria.
El grado crítico de vulnerabilidad se presenta en municipios que concentran al 7.5% de la población del país. Se trata de municipios primordialmente rurales con el porcentaje más alto de personas mayores de 60 años y una importante proporción de población hablante de lengua indígena. Los servicios de salud son críticamente escasos. Su marginación está muy por encima de la media nacional, muestran el mayor nivel de hacinamiento, el menor acceso a medios de comunicación y una economía muy precaria. Con base en los resultados se hace una serie de recomendaciones de las medidas que deben realizarse a nivel territorial con la finalidad de mitigar el potencial impacto del COVID-19 en la sociedad mexicana.
Palabras clave: pandemia; COVID-19; exposición; vulnerabilidad; municipios; política pública
INTRODUCTION
This article describes the formulation of an index of vulnerability to COVID-19 for Mexico; the index combines demographic, socio-economic and health indicators at the municipal level.
In Mexico, patient zero was recorded on 27 February 2020. As the epidemic evolved, the federal, state and municipal governments imposed social distancing measures, including the closure of non-essential businesses, in order to slow down the infection spread and reduce the burden on an already saturated public healthcare system. Although these measures allowed providing better care for critically-ill patients, there is significant economic vulnerability in various sectors of the population, particularly in the most vulnerable ones - those most susceptible to suffer serious negative impacts on various life aspects.
It is important to recognize that the epidemic has different effects in different places and that these will vary with the social, economic and health characteristics of the population. These, in turn, exhibit a particular spatial dynamics and are, therefore, better understood if analyzed from a geographic point of view. Analyzing the geographic distribution of these phenomena is part of the decision-making process for interventions in the public health, economic and social development fields. From the geographic point of view, a major goal is elucidating the spatial dynamics of vulnerability, that is, the spatiality of those characteristics that determine the probability of damage in sectors that are identifiable by both their social characteristics and their location.
Although all people may eventually become infected, some social groups are more vulnerable than others as a result of various characteristics, which this index aims at elucidating. For instance, old age or preexistent diseases predispose a negative evolution of the disease, making people with such characteristics more prone to suffer negative impacts on various life aspects as a result of the epidemic. Deficiencies in some human development components make the population more vulnerable and find greater difficulty, in socio-economic and/ or psychosocial terms, to cope with them even in the absence of infection. On the other hand, limited access to healthcare infrastructure, particularly to the highly specialized one, as well as poor quality healthcare infrastructure, exacerbate vulnerability due to the inability to get proper medical care. At the same time, aspects such as high population density in cities increase vulnerability therein by facilitating a higher contagion rate.
To construct a municipal-level index of vulnerability to COVID-19, we first convened virtual workshops with an expert panel on health, vulnerability, and risk. The panel weighed a wide range of candidate variables and indicators, discussed their data availability and spatial characteristics, and identified the methods most suitable for constructing an index of the desired characteristics. Given the need to have the index available as soon as possible, it was necessary to adopt a robust and transparent method that facilitates the swift processing of critical variables, while also being sufficiently flexible to allow future adjustments to fit the index to specific scenarios. An index with these characteristics would allow examining the joint spatial distribution of the various factors that determine susceptibility to damage as well as of the adverse consequences for people. Such information would facilitate science-based decision-making by the relevant government entities.
The index combines three dimensions relevant to the configuration of vulnerability: demography (ECLAC, 2002; Garay and Montes de Oca, 2011; Sánchez-González and Egea-Jimenez, 2011), health (National Institute of Public Health, Mexico, 2007; Ciudad Juárez-Ramírez et al., 2014) and socio-economic conditions (Kaztman, 1999; King et al., 2009). Each of these dimensions is described in terms of various indicators. The indicators were selected based on a review of publicly available information from the relevant fields of knowledge; they measure those aspects that critically determine the vulnerability to the effects of the pandemic. In this process, some elements that were specific to particular social groups or regions of the country were excluded, as these would have prevented their application at country-wide level. Those variables that, due to their complexity, would have required a long processing time were also excluded.
TERMINOLOGY AND METHODOLOGICAL FRAMEWORK
(a) Terminology
We adopted the terminology set by the United Nations Office for Disaster Risk Reduction (UNISDR, 2017):
Risk is defined as “the potential loss of life, injury or destroyed or damaged assets which could occur to a system, a society or a community in a specific period of time, determined probabilistically as a function of hazard, exposure, vulnerability and capacity” (p.14).
Hazards are the processes, phenomena or human activities that may cause loss of life, injury or other health impacts, property damage, social and economic disruption or environmental degradation. In the case of COVID-19, the SARS-CoV-2 virus is a biological hazard.
Exposure refers to the situation of people, infrastructure, housing, production capabilities and other tangible human assets located in areas exposed to COVID-19 infection.
The vulnerability of inhabitants (or groups of inhabitants) to COVID-19 is determined by their morbidity characteristics, as well as by the social, cultural and economic conditions that influence their capacity to anticipate, cope with, endure and recover from the adverse effects of coronavirus (Blaikie et al., 1994; UNISDR, 2017).
Capacity is the combination of all the strengths, attributes and resources available within an organization, community or society to manage and reduce the impact of a threat. As for the impact of COVID-19 on the population, the most important feature is the capacity of the healthcare system at different territorial levels.
Thus, the risk of COVID-19 is a combination of the threat, vulnerability, exposure and the capacity of society to respond, both individually and collectively, to the SARS-CoV-2.
(b) Brief description of the methodological framework
Vulnerability indices are built to display the social, cultural, economic and demographic characteristics of the population in a spatial unit (e.g., a city block, neighborhood, census tract, locality, municipality), which becomes the unit of analysis. Vulnerability indices are generally used for two main purposes (Díaz-Muñoz and Díaz-Castle, 2001):
To display structural disadvantage conditions that exacerbate some aspects of the susceptibility to damage. Vulnerability indices are synthetic measures that summarize the extent of disadvantages that determine the damage. That is why they are useful to communicate what the society can and should address.
To measure and predict likely future damages under different exposure scenarios to specific threats, in this case, infection by SARS-CoV-2 (coronavirus 2 of severe acute respiratory syndrome).
There are three general strategies to construct vulnerability indices (Tate, 2012). Additive strategies (including hierarchical additive and weighted additive strategies) (Bollin and hidajat 2006; Dwyer et al., 2004 (Garcia et al., 2006), factorial strategies (Cutter, et al., 2003; Borja-Vega et al., 2013; Cutter and Morath, 2013), and matrix strategies (crossing relative and absolute values) (Barrenechea et al., 2000; Natenzon, 2015).
Indices constructed using additive strategies are utilized to identify the social dimension of greatest interest; communicate what elements of society show the lowest or most precarious values; and directly show what factors add to and what others subtract from a given process. Strategies based on the principal components method calculate the variance accounted for by each variable in a vulnerability model. The matrix strategy helps to weigh the absolute values as well as the extent of the disadvantages or “deficiency mass”. We selected a hierarchical additive strategy in which the components are summed up following a hierarchical structure made up of subsets of indicators the relative weights of which add up to 1. All the indicators are normalized and expressed on 5-point ordinal scales that allow evaluating the heterogeneity in vulnerability and exposure across municipalities, as shown by indicators. Normalized values are summed up to yield the values for each vulnerability subset (vector). The hierarchical additive strategy allows keeping the components of vulnerability separate in different, clearly identifiable sets or vectors. In this way, the components of disadvantage can be revealed without being masked by their integration into the index. On the other hand, the hierarchical grouping of components allows allocating equal - as in this case - or differential weights to each of them, when possible.
Constructing the Index
(i) Calculating the Vulnerability Index for the m-th Municipality
The vulnerability index was constructed from three dimensions, described mostly in terms of relative variables and one absolute variable (total population size).
Vulnerability Dimensions
The demographic dimension comprises variables describing population characteristics that might lead to increased vulnerability, given the features of the SARS-CoV-2 infection. This dimension also includes socio-cultural aspects of the population that restrain access to information resources that might help to prevent contagion, as well as factors related to access to healthcare services once people has become infected.
The health dimension comprises variables related to the health status of the population, healthcare infrastructure and medical staff available in the municipalities in relation to population size. Municipalities where comorbidities associated with COVID-19 complications (i.e., hypertension, diabetes, obesity, pneumonia and bronchopneumonia) are more frequent, as well as those with a lower coverage and specialization of the healthcare infrastructure and medical staff, were deemed more vulnerable.
The socio-economic dimension comprises variables that describe the well-being of the population in the municipality in terms of basic needs, rights and economic capacity. This dimension also includes the probability of exposure to the virus, given the settlement characteristics that influence mobility, and the employment structure.
The score for each dimension was computed by dividing the range of each individual component variable into quintiles and assigning a rank, with rank 1 representing the lowest vulnerability and 5 the highest. The score of each dimension is then computed as the average rank of its component variables.
The vulnerability index is the sum of the scores of the three dimensions divided by three. As an index value actually constitutes an ordinal variable, the numerical values thus calculated cannot be interpreted directly, but only in relative terms. To facilitate their interpretation and cartographic representation, index values are categorized into four classes (quartiles) representing increasing levels of vulnerability: Medium, High, Very High, and Critical.
The vulnerability index is computed with the following equation:
Where
IV m |
is the vulnerability index for the m-th municipality. |
D mi |
is the i-th dimension of vulnerability in the m-th municipality. |
n i |
is the number of variables comprised in the i-th dimension of vulnerability |
Q mij (X) |
is the rank corresponding to the value observed in the m-th municipality for the j-th variable of the i-th dimension of vulnerability |
X mij |
is the value recorded in the m-th municipality for the j-th variable of the i-th dimension of vulnerability |
Pα |
is the percentile α of the observed variable (X) and α {0,100} |
(ii) Selection and Evaluation of Indicators
Table 1 shows the indicators selected for each of the vulnerability dimensions
Table 1 Vulnerability Dimensions and their Indicators.
| Dimension | Indicators | Computation Method | Vulnerability (V) or Exposure (E) criteria |
Data Sourcec |
| Socio-economic dimension | 1. Total population in the municipality (as of 2015) | Population size by municipality | (E) The greater the population size, the greater the degree of exposure | Encuesta intercensal, INEGI, 2015 |
| 2. Population older than 60 years (percentage as of 2015) | Population older than 60 years/Population size by municipality * 100 | (V) The greater the proportion of population older than 60 years, the greater the vulnerability | Encuesta intercensal, INEGI, 2015 | |
| 3. Indigenous language speaker population (percentage as of 2015) | Indigenous language speaker population/ Population size by municipality * 100 | (V) the greater the proportion of indigenous language speaker population, the greater the vulnerability due to discrimination | Encuesta intercensal, INEGI, 2015 | |
| 4. Population that only speaks an indigenous language (percentage as of 2015) | Population older than 5 years that does not speak Spanish/ Population size by municipality * 100 | (V) The greater the proportion of population older than 5 years that does not speak Spanish, the greater the vulnerability | Encuesta intercensal, INEGI, 2015 | |
| Healt dimension | 5. Hospital beds (number per thousand inhabitants as of 2018) | Total number of hospital beds in the municipality/ Population size by municipality *1000 | (V) The more hospital beds per thousand inhabitants, the greater the hospital care capacity and the lower the vulnerability | Cubos dinámicos SS, 2018 and Encuesta intercensal, INEGI, 2015 |
| 6. Hospital beds in intensive care units (number per thousand inhabitants as of 2018) | Total number of hospital beds in ICU in the municipality/Population size by municipality *1000 | (V) The more hospital beds in ICU per thousand inhabitants, the greater the hospital care capacity and the lower the vulnerability | Cubos dinámicos SS, 2018 and Encuesta intercensal, INEGI, 2015 | |
| 7. General practitioners and medical specialists (number per thousand inhabitants as of 2018) | Total number of medical doctors (general practitioners and medical specialists) in the municipality/Population size by municipality *1000 | (V) The more general practitioners and medical specialists per thousand inhabitants, the greater the capacity for medical care provision and the lower the vulnerability | Cubos dinámicos SS, 2018 and Encuesta intercensal, INEGI, 2015 | |
| 8. Nursing staff in the municipality (number per thousand inhabitants as of 2018) | Total number of nursing staff in the municipality/ Population size by municipality * 1000 | (V) The more nursing staff per thousand inhabitants, the greater the hospital care capacity and the lower the vulnerability | Cubos dinámicos SS, 2018 and Encuesta intercensal, INEGI, 2015 | |
| 9. Major comorbidities (hypertension, diabetes, obesity, pneumonia and bronchopneumonia) (number per thousand inhabitants as of 2018) | Sum of cases for the five comorbidities/Population size by municipality*1000 | (V) The higher the comorbidity, the greater the vulnerability | Anuario de morbilidad and Encuesta intercensal, INEGI, 2015 | |
| Socio-economic dimension | 10. Municipal marginality index 2015 | Municipal marginalization index (CONAPO): Index based on a principal components analysis of the following variables: Illiterate population, population with incomplete elementary education, households with no sanitation, electricity or water supply, households with dirt floor, housing with shared rooms, population in localities with fewer than 5000 inhabitants, population with income lower than two minimum wages. | (V) The higher marginality, the greater the vulnerability | CONAPO, based on data from Censo 2010 |
| 11. Urban population (population living in localities with more than 15,000 inhabitants, as of 2015) | Population in localities with more than 15000 inhabitants/Population size by municipality * 100 | (E) The greater the degree of urbanization, the greater the exposure | Encuesta intercensal, INEGI, 2015 | |
| 12. Population without health insurance, 2015 | Population without access to healthcare services in the municipality/Population size by municipality * 100 | (V) The greater the number of people without access to healthcare services, the higher the vulnerability | Encuesta intercensal, INEGI, 2015 | |
| 13. Population living in single-room households, 2015 | Total number of people living in single-room households/Population of the municipality *100 | (V) (E) Vulnerability and exposure by overcrowding, different from marginality index. It denotes the impossibility to isolate vulnerable people in the household to prevent contagion, or to isolate a person infected with COVID-19 to prevent exposure of the rest of the household members. | Microdatos de la Encuesta intercensal, INEGI, 2015 | |
| 14. Communication receiving devices (radio, television, cellular phone, and internet) per household, 2015 | Number of communication devices available in the household/Total number of households *100 | (V) the lower the capability to receive information, the greater the vulnerability | Microdatos de la Encuesta intercensal, INEGI, 2015 | |
| 15. People working in small businesses (fewer than five employees) in non-essential activities, 2018 | Number of people who work in business with fewer than five employees/ Number of workers in the municipality. As the number of workers data are given per stratum, the weighted average for the midpoint of each category was used. For the category “251 and more”, a 300 value was used | (V) The more people that cannot keep working during the pandemic the greater the economic vulnerability for not earning income.* | DENUE 2018 | |
| 16. Occupied population working in essential activities, 2018 | Number of people working in essential activities/ Number of workers in the municipality. As the number of workers data are given per stratum, the weighted average for the midpoint of each category was used. For the category “251 and more” a 300 value was used | (E) The greater the number of people working in essential activities, the greater the exposure to SARS- COV2.* | DENUE 2018 | |
| 17. Total gross per capita production, 2019 | Municipal Gross Production/Population size by municipality | (V) the lower the gross per capita production, the greater the vulnerability. | Censos económicos 2014 and Encuesta intercensal 2015 |
* According to Mexico’s federal government, essential activities include: Financial sector; tax collection (SAT office including all of its permanent operations); fuel sales and distribution, petrol and gas; production and distribution of drinking water; food and non-alcoholic beverage industry; restaurants; perishable staple foods; grocery stores; supermarkets; convenience stores; agro-industry; chemical industry; hardware stores; courier services; guards and private security services; day-care centers; nursing homes for elderly people; shelters and care centers for victims of violence against women and their children; funeral and cremation services; storage and cold chain storage of essential raw materials; telecommunications and media; logistics (airports, ports, railroads, bus stations, post services); hospitals and clinics
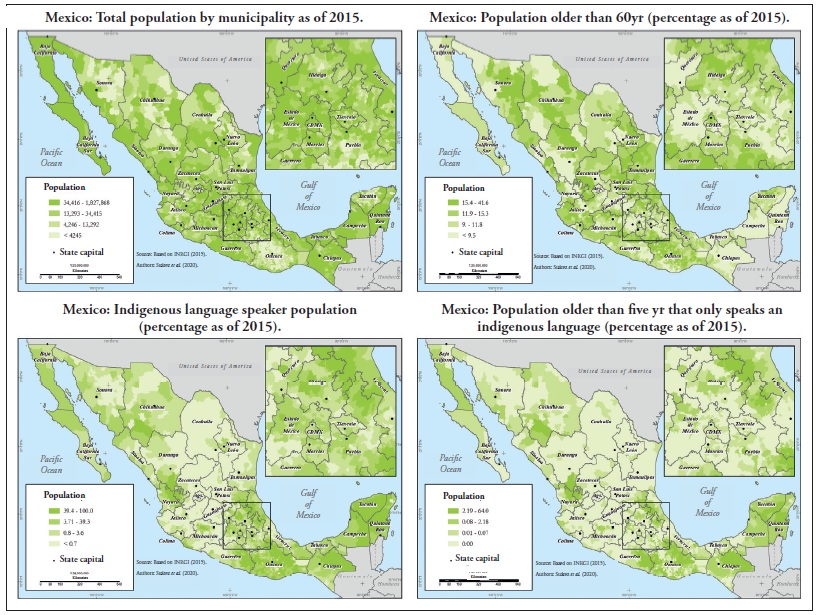
(iii) Demographic Dimension
Total population is the total population size in each municipality. Municipalities with larger populations have a higher number of cases; this variable is used to weight other sociodemographic variables.
Values for this indicator are the population size, as of 2015, in the 2,457 municipalities of the country (INEGI, 2015). The municipality of Santa Magdalena Jicotlán, in the State of Oaxaca, had the smallest population, with 87 inhabitants; the maximum was 1,827,868 inhabitants for the Iztapalapa district, in Mexico City; the country average was 48,630 inhabitants per municipality.
Population older than 60 years. The information available on the infectious characteristics of SARSCoV-2 (Lai et al., 2020) shows that people older than 60 years are more likely to have complications in case of infection.
This indicator was computed by dividing the total number of persons older than 60 years by the total population in the municipality and multiplying by 100. This indicator identifies the fraction of the population whose age makes them vulnerable to COVID-19. In some cases, this fraction amounts to almost half of the population in the municipality. The municipality of García, in the State of Nuevo León, had the smallest population older than 60 years, with 2.5%; the maximum was 42% in the municipality of Cosoltepec, in the State of Oaxaca. The average fraction over all the municipalities was 13%.
Indigenous language speakers. Indigenous peoples are more vulnerable due to the systematic discrimination that they are subject to in the provision of healthcare services (Leyva-Flores et al., 2013, Hurtado-Saa Rosas-Vargas Valdes-Cobos, and, 2012; Horbath and Grace 2012).
This indicator was computed by dividing the total number of indigenous speakers by the total population in the municipality and multiplying by 100. The highest percentage of indigenous language speakers, 100%, was found in the municipality of Tehuipango, in the State of Veracruz; there are no indigenous language speakers in 59 municipalities. The average for all municipalities was 25%.
Population that only speaks an indigenous language This group has a greater vulnerability due to the lack of an intercultural approach in the healthcare programs targeting indigenous populations, particularly the monolingual population. This hampers their access to information and limits the attention paid to this sector in healthcare facilities (Monroy 2017; Figueroa 2009).
This indicator was computed by dividing the total number of monolingual people older than 5 years by the total population in the municipality and multiplying by 100. The highest percentage of indigenous monolingual people older than 5 yr, 64%, was found in the municipality of Chalchihuitán, in the State of Chiapas; there are no indigenous monolingual population in 1,327 municipalities. The average for all municipalities was 1.9%.
(iv) Health Dimension
Hospital beds and hospital beds in intensive care units (ICU) These two indicators were computed on a per-thousand-inhabitants basis and denote the (general and specialized) capacity of healthcare facilities in the country. To make them consistent with the desired characteristics of the vulnerability index, the scale of these variables was reversed, so that as the number of beds decreases, the indicator value increases.
The first indicator was computed by dividing the total number of hospital beds in the municipality by the total population in the municipality and multiplying by 1000. There are 1,761 municipalities in the country that have no hospital beds; the maximum number was recorded in the municipality of San Bartolo Coyotepec, State of Oaxaca, where there are 33.2 beds per 1000 inhabitants; the average municipal rate was 0.28.
The second indicator was computed by dividing the number of beds in intensive care units in the municipality by the total population in the municipality and multiplying by 1000. There are 2,308 municipalities in the country with no intensive care beds; the maximum number was recorded in the municipality of San Bartolo Coyotepec, State of Oaxaca, where there are 1.2 intensive care beds per 1000 inhabitants; the average municipal rate was 0.005.
Number of general practitioners, medical specialists, and nursing staff. These indicators were computed on a per-thousand-inhabitants basis. They denote the number of medical staff available to assist patients. The scale of these variables is reversed, so that as their values decrease, the value of the indicators increases.
The first indicator was computed by dividing the total number of medical doctors (general practitioners and medical specialists) available in the municipality by the total population in the municipality and multiplying by 1000. There are 202 municipalities in the country with no medical staff; the maximum number was recorded in the municipality of San Jorge Nuchita, State of Oaxaca, where there are of 35.7 doctors per 1000 inhabitants; the average municipal rate was 0.97.
The second indicator was computed by dividing the number of nursing staff available in the municipality by the total population in the municipality and multiplying by 1000. There are 39 municipalities in the country with no nursing staff; the maximum number was recorded in the municipality of San Bartolo Coyotepec, State of Oaxaca, where there are 64.4 nursing staff per 1000 inhabitants; the average municipal rate was 1.7.
Major comorbidities associated with complications to COVID-19. This indicator represents the total number of persons with the following comorbidities: hypertension, diabetes, obesity, pneumonia and bronchopneumonia, expressed on a per-thousand-inhabitants basis. As the number of persons with comorbidities that can lead to complications of COVID-19 increases, the municipalities are more vulnerable. Since only state-wide level data are available for this indicator, we assumed that all the municipalities in a state have the same morbidity rates.
To compute this indicator, the morbidity of the five main conditions with the highest comorbidity with COVID-19 were added up and then divided by the total population in the municipality.
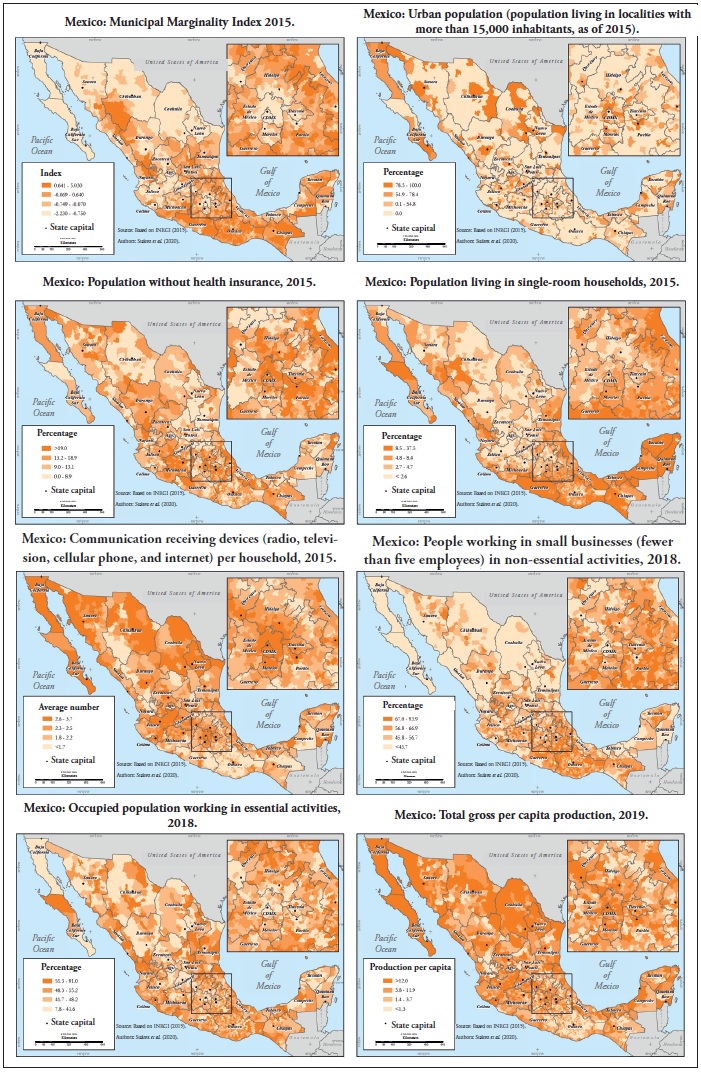
(v) Socioeconomic Dimension
Municipal marginality index. We used the indicator developed by the National Population Council, which measures the shortages in the population in terms of deficit indicators. The index comprises education level, housing characteristics (availability of water, electricity, drainage, dirt floor), crowding conditions, population dispersion, and economic income.
Data for this indicator were taken directly from those published by the National Population Council of Mexico (CONAPO, 2015). The lowest value for the marginality index was -2.23 and was found in the Benito Juarez district, in Mexico City; the maximum value, 5.03, was recorded in the municipality of Batopilas, State of Chihuahua; by definition, the municipal average is 0.
Population living in single-room households This is a measure of overcrowding. It denotes the impossibility to isolate, in the household, persons infected with the SARS-CoV-2 virus, as well as the concentration of persons within the household, which would facilitate contagion. This is the reason why it has been recommended to also keep a safe distance even between family members living in the same household (SSA, 2020; IMSS, 2020).
This indicator was computed by dividing the total number of persons living in single-room households by the total population in the municipality and multiplying by 100. There are 19 municipalities in the country where no people live in singleroom households; the highest percentage, 37.5%, was found in the municipality of Cuautepec, State of Guerrero; the municipal average was 6.6%.
Population living in localities with more than 15.000 inhabitants. This indicator denotes the level of urbanization in the municipality. Country-wide data on the distribution of COVID-19 cases show that, during the early stages of the epidemics, the most highly urbanized municipalities showed the higher infection rates.
This indicator was computed by dividing the number of persons in localities with more than 15,000 inhabitants by the total population in the municipality and multiplying by 100. There are 1,952 municipalities in the country with 0% of urban population; the highest percentage, 99%, was found in 18 municipalities. The municipal average was 13.6%.
Percentage of people who work in small businesses (fewer than 5 employees) in non-essential activities. This indicator denotes economic vulnerability. The greater the number of persons who work in nonessential economic sectors, the greater the number of persons who are out of work during the epidemic and that may not, therefore, earn any income.
This indicator was computed by dividing the number of persons who work in businesses with less than five employees in non-essential activities by the total occupied population in the municipality and multiplying by 100. The lowest percentage of population working in small businesses in nonessential activities was 8.1% in the municipality of Arteaga, State of Coahuila; the highest percentage, 94%, was found in the municipality of Zapotitlán Palmas, State of Oaxaca. The municipal average was 55.3%.
Occupied population working in essential activities. People who work in essential activities must keep on working, and cannot quarantine, which involves a higher exposure to the virus.
This indicator was computed by dividing the occupied population working in activities deemed as essential by the total occupied population in the municipality and multiplying by 100. The lowest percentage of population working in essential activities was 7.8% in the municipality of Santa María Ixcatlán, State of Oaxaca; the highest percentage, 90%, was found in the municipality of Dzilam de Bravo, State of Yucatán. The municipal average was 48.5%.
Population with no access to healthcare services. This indicator denotes the number of persons who will face greater difficulty to get medical attention in the event of becoming infected and developing health complications. Under a high-demand scenario, even the population with health insurance will see its access to healthcare services reduced, despite having such access guaranteed (Galindo and Suarez, 2018); the population lacking health insurance would be even more vulnerable. Besides, lack of health insurance is an excellent indicator of the size of the population working in the informal sector. This factor increases vulnerability, as this segment of the population largely depends on day-to-day income. This is particularly critical in the street-trading sector, which has been halted to a large extent by the health contingency.
This indicator was computed by dividing the total number of persons with no health insurance by the total population in the municipality and multiplying by 100. There are 35 municipalities in the country where no-one lacks health insurance; the highest percentage, 100%, was found in the municipality of Nogales, State of Veracruz. The municipal average was 19%.
Gross per capita production. This is an indicator of economic well-being in the municipality. Population in municipalities with lower gross per capita production are deemed more vulnerable, as this value reflects the competitiveness in the territory (Nephew, 2005) and, indirectly, the investment and recovery capacity. For analysis, the scale of this variable was reversed so that higher values denote lower vulnerability.
This indicator was computed by dividing the total gross production of the municipality by its total population. There are three municipalities in Mexico where the total gross production was zero pesos; the highest value, 4,402 pesos, was found in the municipality of Atitalaquia, State of Hidalgo. The municipal average was 29.6.
Communication devices per household. This is an indicator of the possibility of receiving messages broadcasted through mass media; a greater access to various media allows a greater possibility of receiving timely essential information to take selfprotection actions. The indicator includes radio and television sets, ownership of mobile phone and Internet access. For our analysis, the scale of this variable was reversed, so that higher values denote lower vulnerability.
The indicator was computed by counting the number of communication devices available in the household, divided by the total number of households in the municipality to obtain the average availability.
There were 12 municipalities (mostly in the States of Oaxaca and Chihuahua) with 0.0% communication devices per household; the maximum value, 3.6%, was recorded in the Benito Juarez district, in Mexico City; the municipal average was 2.1%.
RESULTS AND DISCUSSION
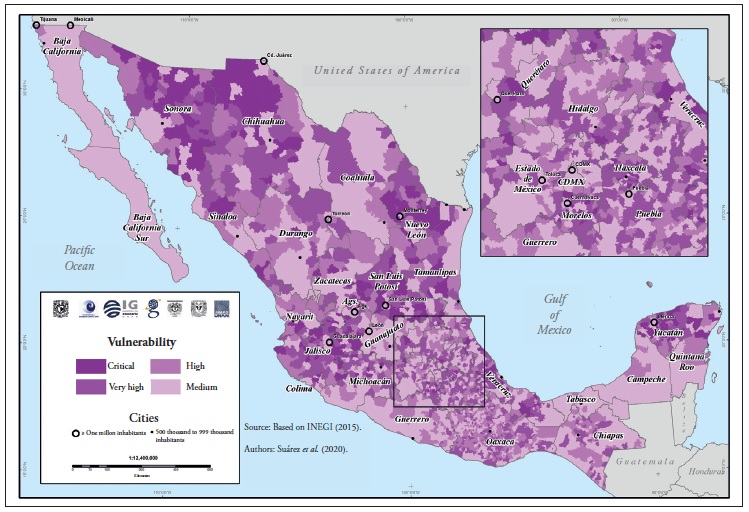
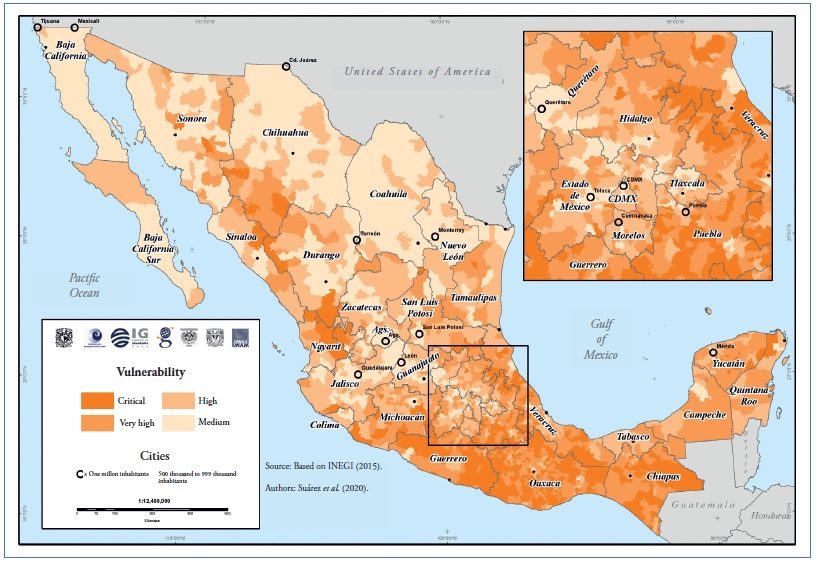
(a) Index of Vulnerability to COVID-19 and its Dimensions
Values of the index of vulnerability to COVID-19 are categorized into four levels of vulnerability: Medium, High, Very High, and Critical.
A critical vulnerability occurs in those municipalities that show very high or critical vulnerability values in all three dimensions, as a result of having high values in many of the indicators describing them. These are usually rural, highly marginalized, sparsely populated municipalities where access to healthcare services is very low. A very high vulnerability is found in municipalities showing either high and very high values in all dimensions, or critical levels in some dimensions and high in others. Many of these are municipalities either rural or with only small urban areas, with high marginalization, poor accessibility, and very low access to healthcare systems.
A high vulnerability is associated with municipalities showing high values in all dimensions, or very high levels in some dimensions and high or medium levels in others. Many of these municipalities have urban populations and, in some cases, are located on the periphery of metropolitan areas; the marginalization level is medium and access to healthcare systems is low, although they might be near municipalities where such services are available.
A medium vulnerability implies having healthcare services readily available, the lowest marginalization, and high urbanization. These are the least vulnerable municipalities, although this does not imply that the population therein is not vulnerable, or that there are no specific groups that need to be looked after.
Vulnerability Dimensions1
Figures 1, 2 and 3 show, for reference, the geographic distribution of all the variables analyzed. Figures 4, 5 and 6 show the geographic distribution of the three dimensions that make up the vulnerability index. The large population centers are particularly noticeable in the demographic dimension (Figure 4); those municipalities where migration of working-age people is significant also stand out, due to the values of the population-over60yr indicator. High marginalization and high proportion of indigenous communities coincide in several municipalities in states like Oaxaca, Chiapas, and Guerrero, as well as in the Sierra Tarahumara region.
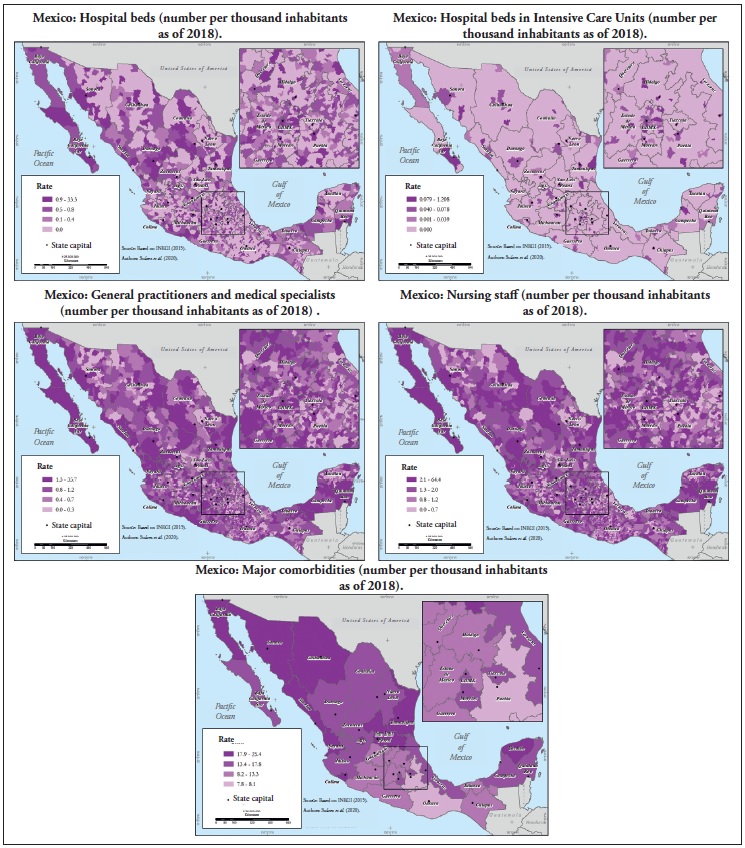
The health dimension (Figure 5) shows a geographic distribution markedly different from the others. This dimension contributes to the vulnerability of marginalized areas in some municipalities in the State of Oaxaca, but it is particularly important in the northern states of Sonora and Chihuahua, as well as in the Yucatan peninsula, where hospital beds and ICU beds are scarce, and comorbidities are high. The States of San Luis Potosí, Nuevo León and Tamaulipas show extensive vulnerable areas based on the number of beds and medical and nursing staff. Municipalities with high vulnerability in this dimension appear scattered in the central part of the country; in these cases, vulnerability is mainly due to low access to hospital beds.
The socioeconomic dimension (Figure 6) shows a clearly recognizable territorial pattern. The parts of the country with high socioeconomic vulnerability are located to the south, in the States of Oaxaca, Chiapas and Guerrero; along the Sierra Madre Oriental on the border between Puebla and Veracruz; and in north Mexico, in the southern part of the State of Durango and north of Sinaloa, on the Sierra Madre Occidental.
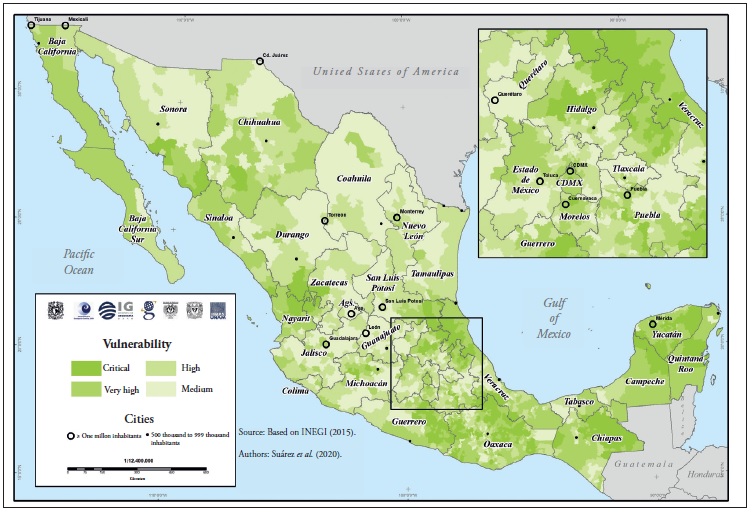
Vulnerability Index
Figure 7 shows the vulnerability to COVID-19 in four categories: Medium, High, Very High and Critical. Municipalities with medium vulnerability are home to 63.2% of the population in Mexico, 17.6% in municipalities with high vulnerability, 11.7% in municipalities with very high vulnerability- Table 3 shows the average values for each of lity, and 7.5% in municipalities where vulnerability the variables that make up the vulnerability diacritical. The population in municipalities with mensions. Except for two variables, the behavior very high and critical vulnerability amounts to 24 is as expected, i.e., the vulnerability level for each million people (Table 2). variable increases in parallel with the overall index figure; however, the morbidity variable shows the opposite pattern. This may be due to two factors: on the one hand, to the spatial aggregation of the data, as data for this variable were only available at state-wide level; on the other, shortcomings in the data, i.e., as municipalities become less urban, healthcare services become more deficient. Nevertheless, there were only small differences in vulnerability levels.
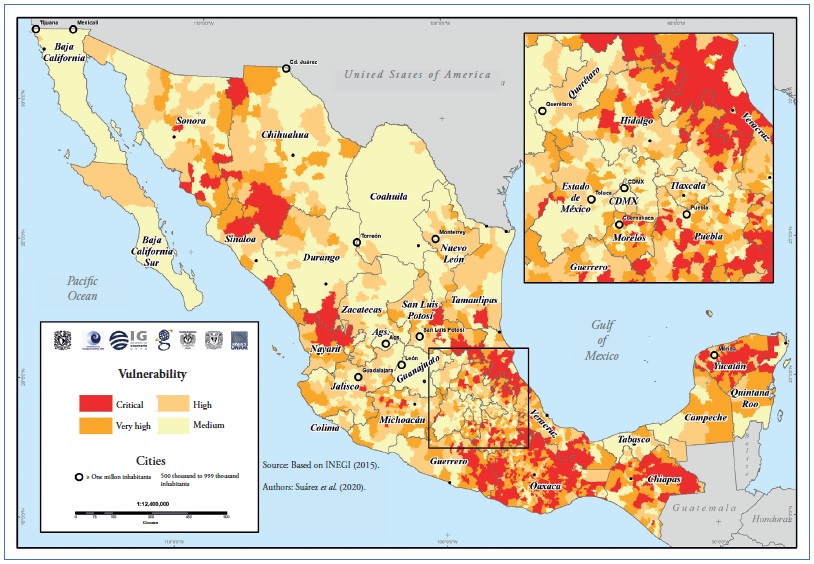
Table 2 Total population in municipalities with different levels of vulnerability.
| Vulnerability level | |||||
| Medium | High | Very high | Critical | Total | |
| Total population | 75,526,131 | 21,090,957 | 13,958,485 | 8,955,180 | 119,530,753 |
| % of population | 63.20 | 17.60 | 11.70 | 7.50 | 100 |
Table 3 Municipal averages of variables per vulnerability level.
| Dimension | Variable | Vulnerability level | |||
| Medium | High | Very high | Critical | ||
| Demografy | Total population | 121,816 | 34,073 | 22,845 | 14,753 |
| Population older than 60 yr (%) | 11.6 | 13.1 | 13.6 | 13.3 | |
| Indigenous language speaker population (%) | 3.1 | 7.3 | 22.1 | 67.5 | |
| Monolingual population (%) | 0 | 0.1 | 1.2 | 6.5 | |
| Healt | Hospital beds (Number per 1000 inhabitants) | 0.7 | 0.2 | 0.1 | 0.1 |
| Hospital beds in intensive care units (Number per 1000 inhabitants) | 0.0200 | 0.0010 | 0.0008 | 0 | |
| Total relative morbidity | 14.1 | 13.8 | 12.3 | 11.2 | |
| Medical staff (Number per 1000 inhabitants) | 1.7 | 0.9 | 0.7 | 0.6 | |
| Nursing staff (Number per 1000 inhabitants) | 2.9 | 1.6 | 1.3 | 1.1 | |
| Socioeconomic | Marginalization index | -0.8 | -0.3 | 0.2 | 1 |
| Population living in single-room households (%) | 4.4 | 5.2 | 7.4 | 9.6 | |
| Urban population (%) | 31.8 | 12.9 | 7.4 | 2.4 | |
| Population working in small businesses in non-essential activities (%) | 45.8 | 53.4 | 59.1 | 63.6 | |
| Occupied population working in essential activities (%) | 44.3 | 49 | 50.9 | 50.1 | |
| Population without health insurance (%) | 17.1 | 22.8 | 18.5 | 17.9 | |
| Gross per capita production | 86.5 | 18.8 | 9.2 | 2.9 | |
| Average number of communication devices in households | 2.6 | 2.3 | 2 | 1.6 | |
Health insurance shows a quadratic distribution, with less informality in municipalities with medium and critical vulnerability, and greater in those with high and very high vulnerability. This might be due to an interaction between the variables related to population structure and employment.
The map in Figure 7 shows that a large part of the states of Guerrero, Oaxaca, Chiapas, and Yucatan, followed by the Huasteca Veracruzana and the Huasteca Potosina regions, have critical vulnerability. The same occurs in the southern part of the State of Chihuahua in the Sierra Tarahumara region, and in the northern part of the State of Nayarit and south of Durango.
(b) The Vulnerability Index and the Epidemic in Mexico
This section shows the relationship between vulnerability level and the municipal-level contagion patterns observed in the country as of April 25, 2020.
The Mexican Ministry of Health published a map showing the distribution of COVID-19 cases per municipality on the third week of April. This map includes a traffic-light scheme to identify municipalities with confirmed cases (red), adjacent municipalities where no cases have been reported (yellow), and municipalities where no contagion have been reported and are not adjacent to municipalities with confirmed cases (green). Table 4 shows the results of overlaying this scheme and the vulnerability index levels as presented here.
Table 4 Relationship between the vulnerability level of municipalities and the distribution of COVID-19 cases therein and in adjacent municipalities.*
| Municipalities | Average number of contagions |
|||
| Vulnerability | With contagions | No contagions | ||
| Adjacent to municipalities with contagions |
Non-adjacent to municipalities with contagions |
|||
| Medium | 46% | 21% | 10% | 18 |
| High | 26% | 27% | 20% | 3 |
| Very high | 18% | 27% | 29% | 2 |
| Critical | 10% | 25% | 41% | 1 |
* Source: Own calculations and data from the map showing the distribution of COVID 19 cases per municipality and adjacent municipalities (Secretaría de Salud, 2020).
Almost half of the municipalities where cases have been confirmed have medium vulnerability; 7% of the municipalities with confirmed infections have critical vulnerability. This is largely explained by the high urbanization level of municipalities where most infections were recorded in the early stages of the epidemic in Mexico; there, exposure increased due to factors related to the large number of interactions and physical closeness between individuals. It should be noted that these municipalities concentrate most of the healthcare infrastructure and the index reflects these conditions as vectors of low vulnerability. On the other hand, a large part of the municipalities no contagions have high or very high vulnerability; identifying these municipalities is crucial to take the administrative and social actions needed to prevent contagion in these areas. Although these municipalities have a poor road infrastructure and are relatively isolated, which reduces exposure and probability of spread, and delays the appearance of cases, these do not preclude the risk.
On the other hand, the average number of confirmed cases per municipalities with different levels of vulnerability shows that the municipalities with the highest number of cases are those with medium vulnerability, and there are few cases in municipalities with high, very high, and critical vulnerability (Table 4).
Our data show that, as of today, the epidemic in Mexico is concentrated in urban municipalities with low vulnerability; however, the spread of the virus towards municipalities with higher vulnerability might create unmanageable conditions in terms of local healthcare infrastructure and economic impact on communities. An important aspect to bear in mind is that the epidemiological surveillance model adopted by the Mexican Ministry of Health, the Sentinel model, is based on samples of suspected cases reported by healthcare units, which has no spatial representation. Therefore, the spatiality of the cases estimated with the Sentinel model cannot be determined. For this reason, although no confirmed cases have been reported from municipalities with high, very high, and critical vulnerability, this is no guarantee that there are no contagions in those municipalities.
CONCLUSIONS AND RECOMMENDATIONS
Conclusions
We are all vulnerable to COVID-19; however, the distribution and combination of various demographic, health, and socioeconomic factors across the national territory make the vulnerability of the population to vary considerably between municipalities. The design and evaluation of a vulnerability index such as the one presented in this article helps to identify the contrasts between municipalities, as well as the factors (grouped in three different dimensions) that influence such a spatially differentiated behavior.
Out of the total population considered in these analyses (119,530,753 inhabitants), 75.5 million (63.20%) live in municipalities with medium vulnerability; 21 million in municipalities with high vulnerability (17.60%), 13.9 million (11.70%) in municipalities with very high vulnerability, and 8.9 million in municipalities with critical vulnerability (7.50%). This analysis indicates that immediate actions should be taken at the territorial level to mitigate the potential impact of COVID-19 on the Mexican society.
To note, although we used the most updated data available for the variables included in these analyses, the vulnerability of the population is dynamic and strongly influenced by changing factors that increase exposure to the SARS-CoV-2 virus. In addition to demographic, health, and socioeconomic characteristics, the mobility of the population, the close interactions involved in economic activities such as trade and provision of services, and the mobility for job-related reasons, all become significant factors for potential contagion.
An evident aspect of our study is that the largest number of vectors that increase the vulnerability to the impacts of the COVID-19 epidemic occurs in the most highly marginalized municipalities of the country, which concentrate conditions such as household precariousness, high proportion of indigenous population, fewer goods in the household, higher overcrowding, poor healthcare infrastructure, mostly informal economic activity, and lower economic production. It is the sum of these factors that makes these municipalities areas with potentially critical issues; although the indicators of exposure yield low values therein, the other vulnerability vectors show high, very high, and critical values. In general, there are no confirmed infections in these municipalities yet; nonetheless, the epidemic will likely have strong negative effects on their local economies, given the contingency measures adopted.
On the other hand, the municipalities where infection cases have already been reported, have medium vulnerability as they are large urban centers. It should be pointed out that their vulnerability condition does not preclude the eventual saturation of the healthcare services therein.
Finally, this index is an effort to approach the three dimensions that are deemed crucial for understanding the effects of the pandemic in Mexico. However, this effort has been limited by the data available and their spatial characteristics; these must be improved and their predictive capacity under specific scenarios compared. The methods used allow updating the variables if needed, as well as including additional variables that better reflect the different aspects of the epidemic, once country-wide data disaggregated at the municipal level become available. Aspects such as migratory intensity, mobility for work reasons, indicators of violence, and more detailed data on morbidity may help to further refine the vulnerability index and improve its applicability in decision-making.
Recommendations
1. Increase and maintain the contagion prevention measures in municipalities with very high and critical vulnerability, even if no cases have been reported therein yet, since the epidemic might have serious effects in those municipalities.
2. Carefully evaluate the anticipated lifting of contagion mitigation measures in municipalities with very high and critical vulnerability without having first controlled the epidemic in other municipalities, particularly in those with more socioeconomic linkages.
3. Formulate an economic protection plan that specifically targets the most vulnerable municipalities to help them resist the contingency and recover afterwards.
In addition:
4. The ongoing situation has revealed important deficiencies in the health data available in Mexico. It is therefore important to implement platforms that supply geo-referenced information disaggregated at the municipal level and even at the locality or neighborhood level in the case of large urban areas.
5. Our analyses show that the most vulnerable population has less access to the media. It is therefore important to ensure an effective and inclusive communication of the COVID-19 risks; communications that reach the entire population, particularly the vulnerable groups. To achieve this, printed, visual, audio and other means have to be used, both in Spanish and in the various indigenous languages that are spoken in the country.
6. Internal and external migrants, as well as their communities of origin, are among the groups most vulnerable to COVID-19. It is therefore necessary to implement inclusive social programs to protect their health and mitigate the potential impact of COVID-19. To achieve this goal, COVID-19 testing and surveillance capabilities must be developed and strengthened in areas of high migratory flow; inform the population about the locations where COVID-19 detection tests are carried out across the country, including migratory stations; improve communications and information flow for migrants with a multilingual perspective; improve sanitation and hygiene facilities in Modal Transfer Centers (CETRAM: bus terminals, taxi stations, public transport stops) that guarantee access to water, soap, and disinfectant gel; and restrict formal and informal activities in CETRAMs.
All the data used to construct the indicator maps as well as the intermediate result maps are available in:
REFERENCES
Barrenechea, J., Gentile, E., González, S. y Natenzon, C. (2000). Una propuesta metodológica para el estudio de la vulnerabilidad social en el marco de la teoría social del riesgo. En Buenos Aires: Facultad de Ciencias Sociales, Universidad Autónoma de Buenos Aires. http://test6.pirna.com.ar/files/pirna/PONBarrenechea-Gentile-Gonzalez-Natenzon-Una%20propuesta%20metodologica%20para%20el%20 estudio%20de%20la%20vulnerabilidad.pdf. [ Links ]
Bollin, C., y Hidajat, R. (2006). Community-based disaster risk index: Pilot implementation in Indonesia. En J. Birkmann (Ed.), Measuring vulnerability to natural hazards: towards disaster resilient societies (pp. 271-289). Tokio; Nueva York: United Nations University. [ Links ]
Borja-Vega, C. y de la Fuente, A. (2013). Municipal Vulnerability to Climate Change and Climate Related Events in Mexico. The World Bank. DOI: 10.1596/1813-9450-6417 http://documents.worldbank.org/curated/en/327691468281941794/pdf/wps6417.pdf [ Links ]
CEPAL. (2002). Vulnerabilidad sociodemográfica. Viejos y nuevos riesgos para comunidades, hogares y personas. LC/R.2086. https://repositorio.cepal.org/bitstream/handle/11362/13051/S2002632_es.pdf [ Links ]
CONAPO. (2015). Índice de Marginación 2015. México: Consejo Nacional de Población, Secretaría de Gobernación. [ Links ]
Cutter, S. L., Boruff, B. J. y Shirley, W. L. (2003). Social Vulnerability to Environmental Hazards. Social Science Quarterly 84 (2), 242-61. DOI: 10.1111/15406237.8402002. [ Links ]
Cutter, S. L., Ismail-Zadeh, A., Alcántara-Ayala, I., Altan, O., Baker, D. N., Briceño, S., Gupta, H., Holloway, A., Johnston, D., McBean, G. A., Ogawa, Y., Paton, D., Porio, E., Silbereisen, R.K., Takeuchi, K., Valsecchi, G.B., Vogel, C., Wu, G. (2015). Global risks: Pool knowledge to stem losses from disasters, Nature 522 (7556), 277-279. DOI: 10.1038/522277a [ Links ]
Cutter, S.L. y Morath, D.P. (2013). The evolution of the social vulnerability index. En J. Birkmann (ed.) Measuring vulnerability to natural hazards: towards disaster resilient societies (2nd ed.). Tokio: United Nations University Press. [ Links ]
Díaz-Muñoz, M. Á., y Díaz-Castillo, C. (2001). El análisis de la vulnerabilidad en la cartografía de riesgos tecnológicos: Algunas cuestiones conceptuales y metodológicias. Serie Geográfica, 10, 27-41. [ Links ]
Dwyer, A., Zoppou, C., Nielsen, O., Day, S. y Roberts, S. (2004). Quantifying Social Vulnerability: A Methodology for Identifying Those at Risk to Natural Hazards. Canberra, Australia: Geoscience Australia. [ Links ]
Figueroa, M. (2009). Estrategias para superar las barreras idiomáticas entre el personal de salud-usuario de servicios de salud pública en España, Estados Unidos y México. Comunicación y sociedad, 12, 149-75. [ Links ]
Galindo-Pérez, C. y Suárez-Lastra, M. (2018). Servicios de salud del ISSSTE en la Zona Metropolitana de la Ciudad de México ¿Qué pasaría si nos enfermáramos todos? Gestión y Política Pública. 27(2), 475-499. [ Links ]
Garay, S., y Montes de Oca, V. (2011). La vejez en México. Una mirada general sobre la situación socioeconómica y familiar de los hombres y mujeres adultos mayores. Perspectivas Sociales, 13(1), 143-165. [ Links ]
García, N., Marín, R., y Méndez, K. (2006). Vulnerabilidad social. En L. Flores Corona, Guía básica para elaboración de atlas estatales y municipales de peligros y riesgos: Evaluación de la vulnerabilidad física y social (pp. 75-154). Secretaría de Gobernación: Centro Nacional de Prevención de Desastres. [ Links ]
Horbath, J. E. y Gracia, A. (2012). Rezago social y discriminación de la política social hacia los grupos indígenas en Sonora. Revista de relaciones internacionales, estrategia y seguridad, 7(1), 173-89. DOI: 10.18359/ries.95. [ Links ]
Hurtado-Saa, T., Rosas-Vargas, R. y Valdés-Cobos, A. (2012). Servicios de salud, discriminación y condición étnica/racial: un estudio de caso de la problemática en México y Colombia. Ra Ximhai, 9(1), 135-51. DOI: 10.35197/rx.09.01.e.2013.12.th [ Links ]
Instituto Nacional de Salud Pública (México). (2007). Atención a la salud de grupos vulnerables: Hacia una síntesis de la literatura: resumen ejecutivo. México: Instituto Nacional de Salud Pública. [ Links ]
Juárez-Ramírez, C., Márquez-Serrano, M., Salgado, N., Pelcastre-Villafuerte, B. E., Ruelas-González, M. G., y Reyes-Morales, H. (2014). La desigualdad en salud de grupos vulnerables de México: Adultos mayores, indígenas y migrantes. Revista Panamericana de Salud Pública, 35(4), 284-290. [ Links ]
Kaztman, R. (1999). Activos y estructuras de oportunidades: Estudios sobre las raíces de la vulnerabilidad social en Uruguay. CEPAL. Oficina de Montevideo. https://repositorio.cepal.org/handle/11362/28651 [ Links ]
Lai, C.-C., Shih, T.-P., Ko, W.-C., Tang, H.-J. y Hsueh, P.-R. (2020). Severe Acute Respiratory Syndrome Coronavirus 2 (SARS-CoV-2) and Coronavirus Disease-2019 (COVID-19): The Epidemic and the Challenges. International Journal of Antimicrobial Agents, 55(3), 105924. Doi: 10.1016/j.ijantimicag.2020.105924. [ Links ]
Leyva-Flores, R., Infante-Xibille, C., Gutiérrez, J. P., & Quintino-Pérez, F. (2013). Inequidad persistente en salud y acceso a los servicios para los pueblos indígenas de México, 2006-2012. Salud Pública de México, 55, S123-S128. DOI: 10.21149/spm.v55s2.5107 [ Links ]
Monroy, J. F. (2017). La evaluación de los indicadores de interculturalidad en los programas de salud dirigidos a la población indígena y la importancia de la comunicación intercultural. Revista de Evaluación de Programas y Políticas Públicas, 1(8), 71. DOI: 10.5944/reppp.8.2017.15952. [ Links ]
Natenzon, C. (2015). Vulnerabilidad social, amenaza y riesgo frente al cambio climático. En Tercera Comunicación Nacional de la República Argentina a la Convención Marco de las Naciones Unidas sobre Cambio Climático (pp. 1-79). Buenos Aires: Jefatura de Gabinete de Ministros, Presidencia de la Nación, Secretaría de Ambiente y Desarrollo Sustentable de la Nación, Banco Mundial. [ Links ]
Rey, G., Fouillet, A., Bessemoulin, P., Frayssinet, P., Dufour, A., Jougla, E., y Hémon, D. (2009). Heat exposure and socio-economic vulnerability as synergistic factors in heat-wave-related mortality. European Journal of Epidemiology, 24(9), 495-502. DOI: 10.1007/s10654-009-9374-3 [ Links ]
Sánchez-González, D., y Egea-Jiménez, C. (2011). Enfoque de vulnerabilidad social para investigar las desventajas socioambientales: Su aplicación en el estudio de los adultos mayores. Papeles de población, 17, 151-185. [ Links ]
SSa. (2020). Jornada Nacional de Sana Distancia. México: Secretaría de Salud, Gobierno de México. [ Links ]
Sobrino, J. (2005). Competitividad territorial: ámbitos e indicadores de análisis. Economía, Sociedad y Territorio, núm. esp., 123-83. [ Links ]
Tate, E. (2012). Social Vulnerability Indices: A Comparative Assessment Using Uncertainty and Sensitivity Analysis. Natural Hazards, 63(2), 325-47. Doi: 10.1007/s11069-012-0152-2. [ Links ]
UNISDR (United Nations International Strategy for Disaster Reduction). (2017). Report of the open-ended intergovernmental expert working group on indicators and terminology relating to disaster risk reduction. Geneva: UNISDR. [ Links ]
REFERENCES
Dirección General de Epidemiología. (2018). Anuario de Morbilidad 1984-2018. Secretaría de Salud. [ Links ]
Dirección General de Información en Salud. (2018). Cubos dinámicos. Secretaría de Salud. [ Links ]
INEGI. (2015). Encuesta Intercensal (2015). Instituto Nacional de Estadística y Geografía. [ Links ]
INEGI. (2018). Directorio Estadístico Nacional de Unidades Económicas. Instituto Nacional de Geografía y Estadística. [ Links ]
INEGI. (2014). Censos Económicos 2014. Instituto Nacional de Estadística y Geografía. [ Links ]
IMSS. (2020). Para disminuir la propagación del COVID-19, el IMSS promueve las medidas de sana distancia. Instituto Mexicano del Seguro Social - Gobierno de México. [ Links ]
Received: April 20, 2020; Accepted: April 22, 2020; Published: May 13, 2020
 Este es un artículo publicado en acceso abierto bajo una licencia Creative Commons
