


 nueva página del texto (beta)
 Inglés (pdf)
 Artículo en XML
 Referencias del artículo
 Enviar artículo por email
 Citado por SciELO
  Similares en
SciELO
Similares en
SciELO 
 Permalink
INTRODUCTION
Glacial and proglacial systems are changing rapidly due to continuous climate change (Carrivick and Russel, 2013). Evaluating the ice-marginal evolution and the spatial variability of glaciers may contribute to understanding the impacts, the trends and rates of climate change (Bauder et al. 2007; Slaymaker, 2009). Glaciers are one of the most sensitive indicators of climate change, responding to variations in temperature and precipitation, among other factors (Burlando et al. 2002; Jouvet et al. 2009; Khadka et al. 2014; Benn and Evans, 2010). Glaciers retreat impacts the environmental in different ways: global sea level rise (Pachauri et al. 2014); increase of fresh water in the oceans; expansion of ice-free areas; changes on morphology in proglacial zones; interference in the hydrology of glacier-fed channels; change of relief configuration (Dyurgerov and Meier, 2005); and a progressive increase in the number and volume of the icemarginal lakes (Carrivick and Tweed, 2013).
By using temperature melt index models under an atmospheric warming scenario, the ice-free areas could expand 17,000km² by the end of the century, an increase of approximately 25%. Most of this expansion will occur in the Antarctic Peninsula (Lee et al. 2017). For King George Island, Knap, Oerlemans and Cadee (1996) predicted a 36% decrease in ice volume over the next 100 years under +1K condition and complete disappearance of the entire ice cap at the +5K scenario. Rückamp et al. (2011) predicted the total disappearance of the Collins glacier, Fildes Peninsula, in the next 200 years if the 1998-2009 trend of the mean air temperature warming remains. As it is an area that presents variations in glacier thickness (Simões et al. 2015), this area was chosen for the study, in addition to being an accessible area for fieldwork.
Right after glacier shrinkage, the landscape undergoes a process of hydrological and sedimentological imbalance, defined as a paraglacial adjustment period (Ballantyne, 2002; Slaymaker, 2009; Benn and Evans, 2010). In a short time scale, the area may experience paraglacial changes in sediment supply, such as the activation and development of multiple glaciofluvial channels, erosion and deposition processes initiated on the slopes, besides vegetation colonization (Ballantyne, 2002; Moreau et al. 2008; Carrivick and Heckmann, 2017).
The aim of this study is to investigate changes in glacial, proglacial and paraglacial systems in response to the Collins glacier retreat, in scenery between the Little Ice Age (LIA- 650 years ago) - and 2070.
CHARACTERIZATION OF THE AREA
The Fildes Peninsula, part of King George Island (latitudes 62°08’ and 62°14› S and longitudes 59°02› and 58°51› W) (Figure 01), is one of the first areas to be ice-free on the South Shetland archipelago after the Last Glacial Maximum. The Collins glacier (Figure 1) is located in the northern sector of the Fildes Peninsula and it is a small ice dome centered with 15 km² of area, approximately, 270 m maximum elevation, and currently has a land terminus (Simões et al. 2015).
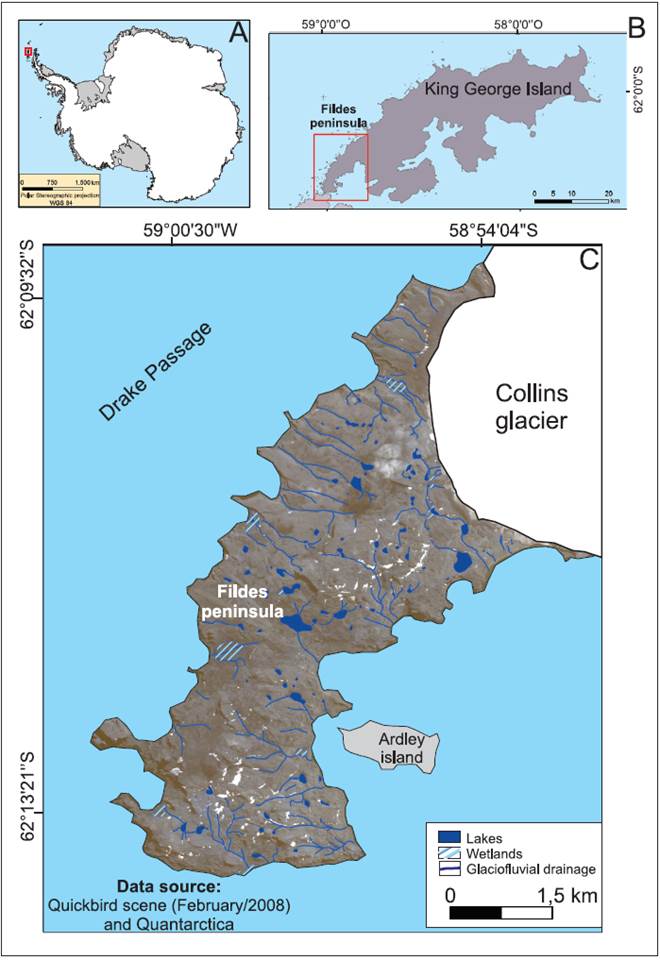
Source: Antarctica Digital Database and Quickbird scene (February /2008).
Figure 1 Location of Fildes Peninsula: (A) Antarctica; (B) King George Island, red polygon identifies the area in (C) Fildes Peninsula and Collins glacier.
The climate is characterized by the frequent succession of a low-pressure system moving westward around the circumpolar zone (Turner and Leonard, 1996). The island has a relatively warm maritime climate during the winter, so the monthly mean air temperatures has a small yearly amplitude (Smith, Stammerjohn and Baker, 1996). The average annual air temperature in King George Island is about -2.8°C. During the winter, air temperature can vary between -15.5°C and -1.0°C, and during the summer it may vary from -1.3°C to 2.7°C, based on the historical meteorological data from Arctowski and Bellingshausen stations for the period between 1947 and 1995 (Ferron et al. 2004).
Currently, we observed the following geomorphological processes in the Fildes Peninsula area: ablation and erosion, nivation, solifluxion and cryoturbation (Simas et al. 2008). According to Michel et al. (2014), the Fildes Peninsula soils are well developed for Antarctic standards, with dominant cryosols related both to cryoturbation and to active layer processes. Periglacial processes dominate above 50 m of altitude, where patterned soils are common. In King George Island (KGI) the vegetation is composed of poorly developed tundra and consists almost exclusively of cryptogams, lichens and mosses, with two species of Deschampsia antartica e Colobanthus quitensis (Olech, 2001).
Glaciers of the KGI have shown a rapid dynamic response to environmental changes since 1950 (Simões and Bremer, 1995; Bremer, 1998; Park et al. 1998; Simões et al. 1999; Braun and Gossmann, 2002; Rosa, et al. 2009; Rückamp et al. 2011). In the case of Collins glacier, Simões et al. (2015) and Vieira et al. (2015) indicate the retreat in the last 30 years as response to the increase of mean annual air temperatures and the resulting liquid precipitation. Days with mean air temperature above 0°C in KGI have also increased in the last 30 years (Vieira et al. 2015). This further increased the snow and ice melting of the island’s glaciers (Braun et al. 2001; Ferrando, Vieira and Rosa, 2009)
The Maritime Antarctica lakes have responded more rapidly than other Antarctic lakes to climate change during the last 60 years, and studies have recorded significant increase in both water temperature and primary productivity (Quayle et al. 2002). Vieira et al. (2015) indicate that Fildes area has more than 80 lakes and ponds that receive amount of sediments from different processes: glacial, glaciofluvial, periglacial and marine.
MATERIALS AND METHODS
Landform chronology
Based on Landsat scenes of 01/03/1986; 02/27/1988; 01/28/1989; 01/19/2003; 03/17/2015 and 04/29/2018, the Collins glacier front position was delimited by establishing the retreat rate since the LIA. The chronology of dating and the mapping of the advancing moraine are used to interpret the position of the glacier front in the LIA. The other stages of retraction were interpreted by the position of the recessional moraines and by the chronology established by satellite imagery as Rosa et al. (2016) and Costa et al. (2019). The outline was measured in QGIS software 2.18.7 to establish proglacial zone evolution.
Contemporary geomorphological and sedimentary analysis and proglacial system mapping
The major features were identified by granulometric and morphoscopic sedimentary analysis; geomorphological interpretation was based in field work and QuickBird (acquired in February 2008, spatial resolution <5 m) and Planet Scope scenes (acquired in February 2018 from Planet Labs Inc., spatial resolution <5 m). Sedimentary samples (17) were collected in selected transects in the proglacial and marginal areas, during the 2014/2015 and 2015/2016 summers. At each sampling site, GPS control points (geometric altitude and coordinates), and observation of the environment (orientation, deposit dimensions, matrix) were performed. Data were processed using GRADISTAT software, thus obtaining the percentage distribution of textural classes of sediments according to the Wentworth scale (1922). The morphoscopic analysis was performed on 50 grains from three granulometric classes with the largest range. The degree of rounding was calculated using the Krumbein comparison chart (1941), and the spherical degree measured according to Rittenhouse (1943). The analyses of surface textures were performed based on Bigarella (1955). A binocular loupe was used to analyze the presence of striae in the clasts.
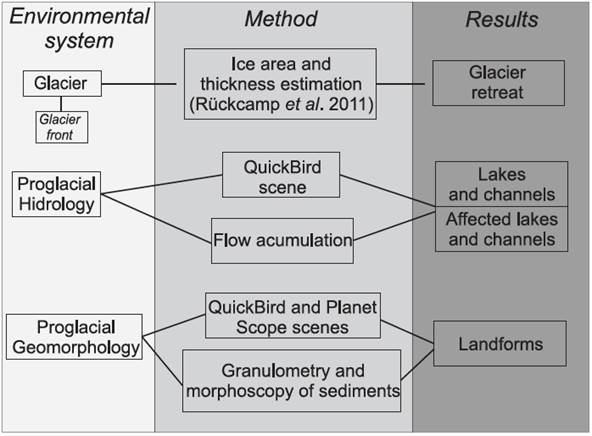
Figure 2: Schematic diagram showing the methodology used to map the proglacial system. The analysis of hydrological, glaciological and sedimentary processes resulted in the future scenario of ice-marginal environments.
The RA index (% of angular clasts) and C40 index (% of clasts with c/a axis <0.4) were conducted according to the method proposed by Benn and Ballantyne (1994) and Evans and Benn (2004), to distinguish erosional, transportational and depositional clast histories. An interpretation key was created (Table 1) for the definition and identification of the landforms for the geomorphological mapping based on Glasser et al. (2005), Hubbard and Glasser (2005), Smith and Clark (2005), and Gustavsson et al. (2006).
Table 1 Interpretation key of the glacial depositional landforms. Landforms field photos were included in the Figures 4-7.
| Landform | Profile | Location | Dimensions | Position in relation to glacier front |
|---|---|---|---|---|
| Moraine ridges of glacier advance |
|
Perpendicular to the direction of flow |
About 8-10 meters high; found in all mapped sectors. |
Glacier front-distal proglacial area |
| Flutings |
|
Parallel to flow direction |
Landforms with a maximum of 2 meters high and reaching amaximum extension of about 5 m. |
Glacier front-icemarginal area |
| Recessional moraines formed by seasonally-processes |
|
Perpendicular to the direction of flow |
About 1 meter high and maximum length of about 4 m. |
Glacier front-icemarginal area |


Possible glacier outline spatial variation
The Collins glacier surface topography has been surveyed by DGNSS (Differential Global Navigation Satellite System) for 11 years (1997/98- 2008/09); data were assembled by Rückamp et al. (2011). There are no new data of glacier surface topography for the area. The method of Rückamp et al. (2011) was used to estimate the area of the glacier in 2030, 2050 and 2070 CE (Current Epoch).
Glacial landforms chronology
The main changes in the Collins glacier occurred in areas in front of Drake Passage and Maxwell Bay where the glacier front, between the LIA period and 1980 decade, has anchored onto land with a retreat of 800 to 300 meters, respectively. The area facing Drake Passage showed a retreat of almost 1500 meters, considering the maximum advance of the LIA and the maximum retreat of 2018, while the area facing Maxwell bay has retreat 600 meters in the same period. In the central portion of the glacier front (Figure 3-A), at a rock formation as reference site, the retreat reached approximately 150 meters between the LIA and 1989, and 350 meters in the LIA-2018 period (Figure 3). The total glacier area loss was 1.4 km² in LIA-2018.
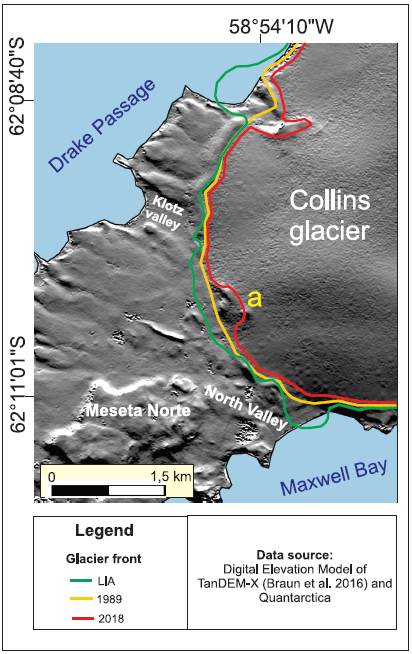
Souce: Digital elevation model of TanDEM-X (Braun et al. 2016) and Quantarctica.
Figure 3 Total Collins glacier area loss between the advance of the LIA and retreat until 1989 was 0.9 km², and between 1989 and 2018 it was 0,7 km². The main changes of the glacier occur in the Maxwell Bay and the area facing the Drake Passage. In this area, the glacier that ended in the ocean now has front at land. A - shows a rocky obstacle.
According to the retreat pattern and presence/ absence of landforms it was possible to identify four sectors in the proglacial zone (Figures 4, 5, 6 and 7): (a) Sector 1 showed changes on glacier outline since the LIA, it did not show the continuity of push moraine, the presence of flutings and recessional moraines; (b) Sector 2 showed around 100 meters of the shrinkage since LIA, and the presence of recessional and push moraines of about 10 meters high; (c) Sector 3 showed approximately 350 square meters of deglaciated area since the LIA, a rocky area which divides the flow of the glacier, recessional moraines above and below this sector, and no push moraines; (d) Sector 4 illustrates more change on the glacier front (retreat of almost 1500 meters since the LIA) and didn’t present recessional moraines, but a push moraine of about 12 meters high.
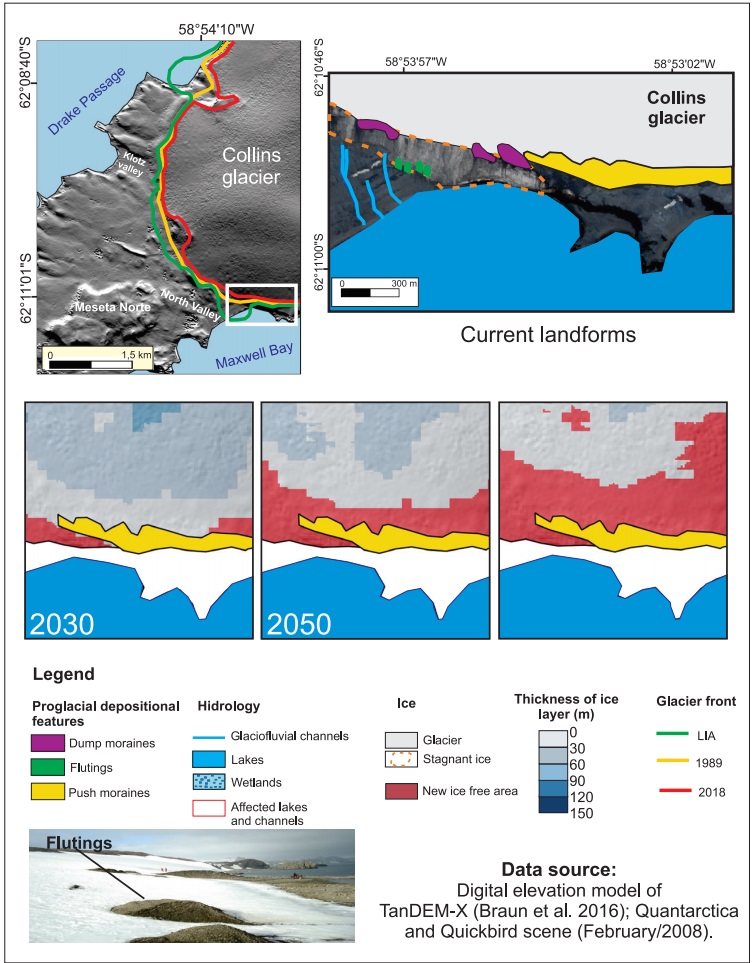
Souce: Digital Elevation Model of TanDEM-X (Braun et al. 2016); Quantarctica and Quickbird scene (February/2008).
Figure 4 Mapping of proglacial system at sector 1. The presence of flutings and dump moraines indicates the low thickness of the glacier (0-60 meters).

Souce: Digital Elevation Model of TanDEM-X (Braun et al. 2016); Quantarc tica and Quickbird scene (Fe bruary/2008).
Figure 5 Mapping of progla cial system of sector 2. This area has already a glaciofluvial channel that will be nourished continually by the meltwater of Collins glacier.
Souce: Digital Elevation Model of TanDEM-X (Braun et al. 2016); Quantarctica and Quickbird scene (February/2008)
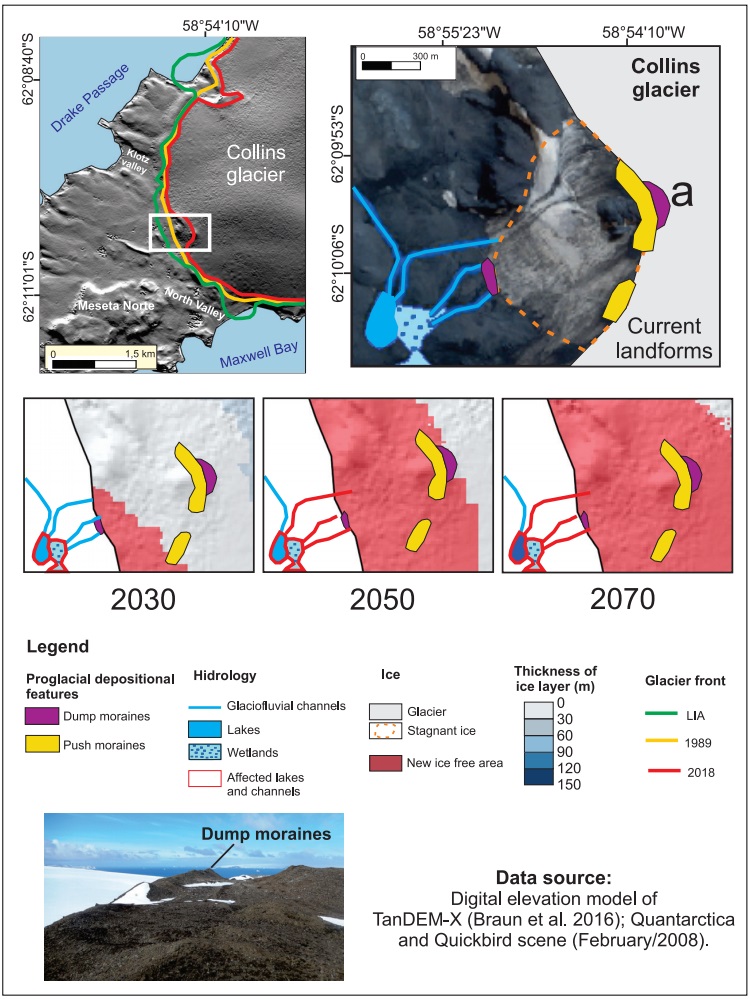
Figure 6 Sector 3 - current and future map of the proglacial system. This sector presents a rocky obstacle (A) - that restricts the continuity of the glacier flow, producing a stagnant ice area. This will be the first area exposed by glacial retreat in the coming years.
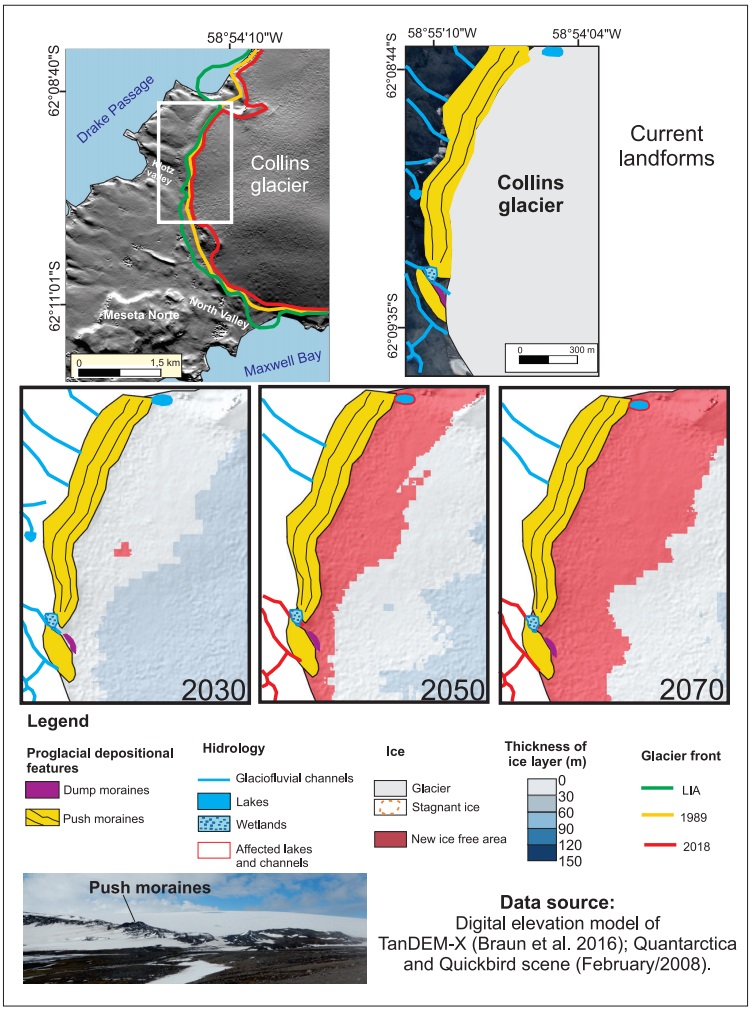
Souce: Digital Elevation Model of TanDEM-X (Braun et al. 2016); Quantarctica and Quickbird scene (Fe-bruary/2008).
Figure 7 Evolution of the proglacial system at sector 4. Up until 2030 the glacier will be stable and will not retreat, but will decrease in thickness from 30-60 meters to 0-30 meters.
Contemporary and scenario characterization of proglacial glacier areas
Under an atmospheric warming scenario, using temperature melt index models, ice-free areas could expand 1.4 km² by the end of the 2070 decade. In general, the Collins glacier front will continuously shrink in the next decades (Figures 04, 05, 06 and 07). The glacier will lose approximately 5% of its total area until 2030 (0.90 km²), 21% (3.60 km²) by 2050, and 35% (5.90 km²) by 2070 CE. The initial area (in 2008 CE) was 17 km². The period 2010 to 2030 will show the smallest shrinkage and from 2030 to 2050 will show the greatest shrinkage.
Given the recent atmospheric cooling trend in Antarctic Peninsula, as pointed out by several authors (Carrasco, 2013; Navarro, 2017), this study hypothesis is that the response of Collins glacier will not be enough to stabilize its retreat. This agrees with Oliva et al. (2017), who postulated that only the smallest ice masses will stagnate or even advance in this geographical area. Therefore, the 1998-2009 air temperature scenario was considered representative for the application of this model.
Some results will be presented according to the four sectors identified in the mapping of the Collins glacier retreat, and the evolution of the proglacial zone since the LIA (item 4.1). Mapping of the current landforms and the outline of the probable future configuration of this environment is presented, regarding the front and thickness of the glacier, hydrology and geomorphology of the proglacial zone.
Mapping contemporary and future glacier retreat: sector 1
Sector 1 is located in the portion facing the Maxwell Bay and the glacier has a current ice thickness between 30-60m. At least three glaciofluvial channels are formed near the stagnated ice margin and there is no vegetation colonization. A recessional moraine set, four flutings and one push moraine are also identified in this sector.
The flutings have an average height of 2 meters and 4-5 meters in length, and are located in the proglacial area in contact with the stagnated ice. In the deposits interpreted as flutings (Figure 4), gravel and sand texture predominance is observed (42%-53% and 44%-57% respectively). Only grains above 4 mm (pebble fraction) showed medium spherical and sub-rounded shapes, and striation features, while those below 4 mm (gravel fraction) present predominantly medium spherical shapes and sub-angular rounding, rough texture, RA index of 30%, and C40 index between 20% and 32%.
For dump moraines we see sediments with predominant textural class from medium to fine gravel (85%), sand (15%), almost complete absence of fine-grained sediments, poorly sorted and unimodally distributed. Sediments morphology showed low roundness, with predominance of 48% angular and 36% sub-angular class, and medium (54%) to low (40%) sphericity. The RA index is 48% and the C40 is 76%.
In 2030 glacier retreat will reach 50 meters in relation to its current outline position. For 2050-2070 scenarios, the outline position will change 300 meters in relation to 2018 glacier front.
Mapping contemporary and future proglacial systems: sector 2
Sector 2 is located in North Valley and the ice thickness varies between 0-30 meters on the glacier front. The ice-marginal face exposes an englacial channel in the summer season (observed in the fieldwork). Sector 2 has a prominent moraine in the landscape, while the North valley stands next to it. It is characterized by three isolated recessional moraines (Figure 5) of little extension and height (3 meters long and 1 meter high).
The recessional moraines sedimentary analysis indicates gravel predominance, poorly sorted, and a bimodal distribution. Clasts are predominantly sub-rounded and medium sphericity prevails, with RA index between 20% and 30%, and C40 index between 12% and 40%. There are few striation features and the predominant texture is rough (weathered surfaces).
The glacier will retreat approximately 150 meters and its thickness will vary between 0-60 meters until 2030. Between 2030-2050 the outline will fluctuate about 350 meters. A current proglacial lake may be affected by decreasing meltwater supply. It will occur due the lower meltwater flow that will be dammed up by new lakes formation. Between 2050-2070 the glacier will retreat 450 meters.
Mapping contemporary and future proglacial system: sector 3
Sector 3 is located in the central part of the Collins glacier, at the upstream portion of North Valley (Figure 6). Ice thickness in this sector is 0-30 meters at its frontal portion. It marks a stagnant ice area and three glaciofluvial channels linking that portion to a lake and a wetland. One particularity of this sector is a set of dump moraines on the stagnant ice front, and other kind of moraines are located upstream of its flow at a splitting point of the glacier flow by the rocky formation. Mosses occur in wetlands margins.
Currently, push moraines are 7 meters high and have a maximum extension of 30 meters. Sediment samples present on average 57%-65% of gravel and 34%-41% of sand content, poorly sorted with coarse sand and fine gravel. There are few striation features or polished surfaces in the grains. The sediments are characterized by low sphericity; roundness predominates in angular/ sub-angular, 50%-67% RA index, and 40% and 54% C40 index.
Dump moraines extend between 1 to 5 meters of extension, have a maximum of the 2 meters height, and are isolated alongside by a meltwater channel on the ice-marginal sector. Sediment sample is characterized as unimodal, with 73% gravel and 27% sand. Sub-angular clasts prevail with RA index at 25%, C40 at 30%, low sphericity, and coarse-grained sedimentary surface. Another sample collected from dump moraines indicates the predominance of sand (54%) and gravel (44%), poorly sorted, the prevalence of medium sphericity, medium roundness and rough superficial texture. Sedimentary sample showed RA index of 5% and C40 of 22%.
Up to 2030, the glacier will retreat 150 meters in relation to its current front. Between 2030- 2050, the glacier will retreat 400 meters, compared to 2018. Between 2050-2070, the glacier will retreat 550 meters.
Mapping contemporary and future proglacial system: sector 4
Sector 4 is located on the north margin of Collins glacier, and its current thickness is 30-60 meters. It presents glaciofluvial channels only in the area close to the Klotz Valley. It is characterized by push moraines of about 8-10 meters high. The area presents a push moraine about 800 meters long, very similar (according to the morphology of the deposit and sedimentary morphoscopic analysis) to the morainic ridges of sector 2. Observing satellite imagery, push moraines are widely arched on straight parts, but in detail, they are irregular and sinuous, reflecting the morphology of the active front of the glacier advance during the LIA. Vegetation is located on the Klotz valley, formed at push moraine margin (Figure 7).
Grain size analysis indicates gravel content between 40%-76% and sand content between 21.8% and 57%, poorly sorted in bimodal distribution for push moraine sample. Sub-angular to sub-rounded grains prevail, but with rounded grains as well. The predominant sphericity is medium, C40 index between 32%-50% and RA between 17%-63%. It shows superficial texture sediments with several grooves, striation features, and predominance of frosted convex hillslope profile grains.
Up until 2030 the glacier will be stable and will not retreat, but will decrease in thickness from 30-60 meters to 0-30 meters. In 2030-2050 is inferred a retreat of 350 meters from the glacier front (in relation to 2018 front). Channels located in Klotz Valley will be affected by meltwater increase. In 2050-2070 the glacier will retreat 700 meters.
DISCUSSION
As observed the total loss area of the Collins glacier was 1.4 km² in the period between the LIA advance and the retreat process until 2018, inferring the regional increase on the mean annual temperature in the last six decades (Vaughan et al. 2003; Turner et al. 2014). This glacier behavior since the LIA allows us to validate the future scenario model, which also corroborates the glacier retreat pattern. It was possible to distinguish four different sectors of the ice-marginal environment based on data collected from the field, previous maps, satellite imagery, and morphology and morphoscopic sedimentary analysis. However, the processes affecting newly ice-free environments will differ depending on the lithology, geomorphological and topographical setting and local climate conditions (Ruiz-Fernández et al. 2019).
Comparison of the sectors and evolution of the proglacial area
SECTOR 1: Sector 1, currently, has a part of stagnant ice, which indicates the low thickness of the glacier (30-60 meters). Probably, the decrease of glacier basal slide and transport competence was occurring since the LIA in this sector. Thus, in a short time, the subglacial channel was filled (Bennett and Glasser, 1996) forming the currently observed flutings. The flutings reveal the wet basal thermal regime of the glacier.
Streaks observed in the sediments of flutings and the degree of roundness indicate subglacial transport, and/or glaciofluvial activity. However, other characteristics indicate that the samples have a mixture of sediments from different transport periods. Dump moraines evidenced high C40 rates and predominance of grain with low RA index meaning elongated and immature grains, and their high angularity and low sphericity may be a result of large breakage applied to the particles. Characteristics such as low selectivity, sphericity and roundness indicate passive transport and/or shortdistance transport. The area shows a high flow of water transported through the channels, which currently makes it difficult for vegetation to cling.
For the period up to 2070, the glacier will retreat 300 meters in relation to the 2018 front. Retreat area up to 2030 is precisely the portion classified as stagnant ice from current mapping. It is inferred a period of great sedimentary load that will be responsible for the formation of glacial deposits, such as moraines, tills, eskers and flutings (Sector 1), and processes that modify ice-free areas like mass movements, defrosting, re-freezing, pluvial and fluvial activities.
SECTOR 2: Sector 2 shows a retreat since the LIA, and probably suffered glacier thickness loss, evidenced by recessional moraines. These dump moraines are subject to rework in phases of annual stabilization with process of seasonal sediment dumping. Recent recessional moraines are in perpendicular alignment to the glacier flow and with a steeper asymmetry toward the glacier front. In the field, an englacial channel connected with the ice-marginal environment was evidenced in the Collins glacier that reworks the push moraine morphology and crosses it towards a proglacial lake.
As for the current landforms, the low C40 index (12%-40%) of the samples of the recessional moraines implies active glacial transport. The characteristics of these moraines indicate wet basal thermal regime, the presence of meltwater and glacier retreat. This moraine was created by a combination of processes of dumping and pushing. The predominance of coarse grains suggests the action of processes of selective remotion of fine sediments on surface and sub-surface.
Up to 2030, Collins glacier at sector 2, facing the North valley, will be one of the first parts to shrink. The period between 2018-2030 the glacier will retreat 150 meters. This behavior may be associated with the low ice thickness in this area, about 30 m only. Currently, the eastern sector presents the greatest number of proglacial features, such as dump moraines (2-5 m length and 1-2 m high), which indicate an environment with less transport capacity and greater release of meltwater, typical of the ice-free area due to glacier retreat.
SECTOR 3: The rocky area and the North Plateau have the same elevation (120 meters), and both are probably relict of the different weathering processes in the area. This sector is the only one that does not have preservation of the push morainic ridges mentioned by Hall (2007), formed during the LIA. Probably, due to a topographic obstacle, the glacier did not advance as much as in the other sectors and has been subdivided into two directions of flow (N-S and E-W), originating the recessional moraine in the area. With the subsequent last glacier retreat during LIA, the runoff pos-depositional processes and mass movements reworked the push moraine. There is a glaciofluvial braided zone within the proglacial zone, 300 meters from the front of the active glacier forming the head of a drainage network towards Maxwell Bay with three interconnected lakes. Vegetation is concentrated in the proglacial braided area.
In sector 3, there are currently dump moraines formed by the slowing movement of the glacier, making it less thick and with less capacity of sedimentary transport. C40 index on dump moraines is 30%, it depicts the role of transport by meltwater at this site, which is evidenced by several channels in a glaciofluvial braided system in the area, as well as material from the exposed rocky area downstream.
In the period up to 2030, the Collins glacier will retreat and the channels will have easier access to larger amounts of sediment. Important changes in the lakes possible will occur due to this retreat, with fluctuations in meltwater area and volume.
SECTOR 4: The Klotz valley, which is located in the north of this sector, was probably incised before the glacier advance in the LIA. Sector 4 does not show dump moraines, due to the higher thickness of the glacier (30-60 meters), in relation to sectors 1, 2 and 3. The small lakes and wetlands probably difficult vegetation fixation. The morainic ridges observed in the mapping may be related to a retreat and stabilization sequence in the NW margin of Collin glacier. The feature between the push moraine and the most recent moraine of sector 4 that represents possibly a stage of retreat after the LIA advance, is a moraine between 4-6 meters high. The sphericity and roundness of the grains from the push moraine reveal a greater transport distance of the sediments and subglacial modification by the meltwater, although it can have a mix of grains of different origins of transport.
Up to 2030, the glacier will change just in the thickness, not in its area. This is probably because this portion has a greater ice thickness, compared to the others, leading to a slower retreat of this sector.
Finally, it is emphasized that the results found in this research are consistent with the values of retraction of volume and area of the glaciers of King George Island, found in the papers by Knap Oerlemans and Cadee (1996) and Rückamp et al. (2011). Costa et al (2019) elaborated the reconstruction of the Hope Bay’s Holocene landscape indicating glaciers advance of tens meters compared to the current front during the Little Ice Age (LIA), as observed in our study.
FINAL CONSIDERATIONS
Up to 2030, Collins Glacier at sector 2, facing the North valley, will be the first part to shrink. In the period between 2018-2030 the glacier will retreat 150 meters. This behavior may be associated to the low ice thickness in this area, about 30 m. This area already has geomorphological features such as recession moraines and flutings, which indicate low transport capacity and high meltwater flow. In the subsequent stage, from 2030 to 2050 CE, the greatest glacier shrinkage processes will occur, with a loss of 21% of the total area. In the final phase, from 2050 to 2070 CE, the area loss will occur across the glacier front, indicating an ice front following the configuration of the Klotz valley relief. Probably, this configuration will follow precisely the LIA behavior, when a greater ice thickness allowed the glacier to reach Drake Passage. The ice-free areas could expand 1.4 km² by the end of the 2070 decade, if considered since the LIA.
The new ice-free area of Collins glacier will be subject to a paraglacial process that probably predominate during the first post-retreat stage of the Collins glacier, characterizing an unstable area, with high sediment concentration forming features such as moraines, till deposits, eskers, flutings and braided channels capable of transporting material to the present proglacial zone. The current proglacial area will probably change due to the reduction of meltwater supply and more glacier distance.
Our model of glacier change does not consider air temperature variations, which can obviously generate differences in the proposed scenarios. The Collins glacier will probably continue to retreat. Finally, it is emphasized that the results found in this research are consistent with the values of retraction of volume and area of the glaciers of King George Island and results for Hope Bay at Antarctic Peninsula.
Considering the hydrologic and sedimentological process, the most dynamic areas are sectors 1 and 2 because of the faster retreat of the glacier. Several melting channels and depositional features are presently observed.

