


 nueva página del texto (beta)
 Inglés (pdf)
 Artículo en XML
 Referencias del artículo
 Enviar artículo por email
 Citado por SciELO
  Similares en
SciELO
Similares en
SciELO 
 Permalink
INTRODUCTION
A major constraint to development and improvement of living conditions among small-scale agriculturalists in developing countries is lack of collateral and hence lack of access to much-needed working capital. To secure access, many governments, private parties and NGOs have introduced a broad variety of Credit Guarantee Schemes (CGS) - over 225 widely diverse schemes across 100 countries, including mutual guarantee associations, publicly operated national schemes, corporate associations, schemes arising from bi- lateral or multilateral co-operation, and schemes operated by NGOs (Gudger, 1998; Green, 2003). In general, the purpose of a CGS hinges on the different incentives of its participants. Borrowers are seeking capital, lenders are looking for investments according to their risk profile, and guarantors are looking for first-hand information about the borrower and lender to link them in a formal business relationship. Given these basic features, a CGS can vary widely in design, purpose and participants. For instance, borrowers can be organized in productive units with authorized representatives or can be single individuals; the credit guarantee can cover just a percentage of the loan or can grant total loan coverage; the guarantor can manage private or public funds to back guaranteed operations. Nevertheless, despite this variety, all schemes use some mechanism to fill gaps in the credit supply. Where they differ is in their attempts to achieve social goals such as reducing community/societal tensions, empowering marginalized groups or assisting post-conflict reconstruction1. This occurs more frequently under public or multilateral cooperation CGS ownership and management than in CGS funds operated by mutual or corporate associations that often have different incentives. Whereas all CGS programs have their greatest impact in areas attempting to transition from subsistence production into a modern commodity production system, the attempts to achieve social goals produce varying regional impacts and do not necessarily reach the agricultural households most in need.
MEXICO’S CGS
In this paper, we explore the regional impacts of Mexico’s evolving credit guarantee programs. The Mexican case offers an opportunity to study a public program that is subject to socio-economic conditions that arise from contrasting commercial relationships with developed economic partners at the north border and emergent economies at the south. This study highlights the need for policy evaluation that reinforces decision-making to improve eligibility conditions in the existing CGS and new schemes needed to target the poo- rest rural businesses.
The origin is in the late 1930s, after the Mexican Revolution, when there was a new governmental focus on business development and economic growth. A new banking law was drafted in 1932 that created a national credit institution, which later was transformed into a set of development banks (Turrent, 2007): Banco Nacional de Obras y Servicios Públicos (Banobras), Nacional Financera (Nafinsa), Banco Nacional de Comercio Exterior (Bancomext), Banco Nacional de Crédito Ejidal, and Banco Nacional de Crédito Agrícola, among others. Banobras, Nafinsa and Bancomext are institutions that currently operate. In the 1950’s, government’s leading concern was to put in practice the import substitution economic model. In that decade several trust funds were created for specific purposes; Special Purpose Vehicles (SPVs) for small and medium enterprises, the mining industry, tourism, agriculture, workforce training, and many others. In this phase, some public trusts began to operate as second tier banks, lending to private banks at a preferential interest rate to promote credits to the most needed enterprises. In this way, a second-tier bank tries to create a link or business relationship between private banks and the productive sectors as a third-party source of funds. But it was not but until the 1970’s when the first SPV was created to promote CGS for the agricultural sector, specifically with the inception of the Fondo Especial de Asistencia Técnica y Garantía para Créditos Agropecuarios (FEGA) in 1972.
FEGA offers guarantee schemes to qualified financial intermediaries (FIs), that is, FIs that have established a business relationship (1st tier - 2nd tier credit agreements) with the trust fund manager to provide financial services to the agricultural and agribusiness sector. There are operating rules for the CGS program. Credits for fixed investment and working capital are covered by partial guarantees comprising no less than 40 percent and no more than 90 percent of the loans that the FIs issue to rural producers. The beneficiaries of FEGA have to provide a liquid collateral of at least 30 percent of the loan and a guarantee fee that covers the trust fund operating costs and the risk premium of expected loan defaults.
To complement FEGA, on 31 March 2008 the Mexican Federal Government created a program named Fondo Nacional de Garantías (FONAGA). FONAGA was designed either to operate independently or in combination with the existent FEGA, focusing attention on segments that not fully served by FEGA and commercial banks, specifically producers who do not have sufficient collateral to obtain a loan from financial intermediaries under FEGA operation rules. FONAGA provides up to 20 percent out of the 30% of the collateral that FEGA require. Unlike FEGA, FONAGA does not charge any guarantee fee to its beneficiaries. Tables 1 and 2 show the general configuration of the programs.
Table 1 FEGA structure without FONAGA.
| Fixed Investment | Working Capital | |
| Credit type | ||
| Eligibility | Whole country | |
| Liquid Collateral by Beneficiaries |
30 percent | |
| FEGA | 40 to 90 percent nominal coverage and fee charged |
|
Source: own elaboration.
Table 2 FONAGA structure with FEGA optional. Source: own elaboration
| Fixed Investment |
Working Capital | ||
| Credit type | |||
| Whole country |
South & Southeast |
Rest of the country |
|
| Eligibility | |||
| Liquid Collateral by Beneficiaries |
10 percent | ||
| 20 percent | 14.29 percent |
8.3 percent | |
| FONAGA (No fees) | |||
| FEGA (Fee cost) |
50 percent optional |
50 or 80 percent optional |
50 percent optional |
Source: FIRA (own elaboration).
SPATIAL ANALYSIS
The analysis that follows assesses whether Mexico’s provision of financial support does in fact generate access to private funds in regions and sectors that traditionally have been self-sustaining at the basic level. Specifically, the assessment is focused on the rural SMEs engaged in primary economic activities, and the CGSs specialized in the agricultural sector. Empirical evidence of the links between access to financial services and development outcomes is limited (Demirgüç-Kunt, Beck, & Honohan, 2008), and little has been done on Mexican CGS. For instance, a model based on comparative statics to determine the break-even increase in the credit supply using Mexican loan guarantee programs has left more questions about efficiency and effectiveness than it has answered (Benavides & Huidobro, 2008). A descriptive evaluation of Mexican CGS gave mixed indications of success in private credit supply promotion, enhanced competitiveness, and improved credit terms (Huidobro & Reyes, 2014). Institutional research papers by the Comisión Nacional Bancaria y de Valores (CNBV) have been issued to promote knowledge about the financial system in Mexico. CNBV’s closest research related to the present study is one by Peña and Ríos (2013) that assesses the impact of the Nafinsa CGS. They found that guarantees are associated with lower interest rates and higher loan amounts. However, this influence is bounded by the eligibility criteria of the program, aimed at SMEs involved in the secondary manufacturing industry, commerce or services, leaving out most of the rural SMEs. This study therefore is intended to fill the gaps in the existing literature for primary economic activities and the rural sector. Since access to financial services is a significant policy challenge not only for the agricultural sector in Mexico but for many developing and developed countries, it is worth analyzing which government actions are the most effective strategies for promoting rural development.
The period selected for the analysis runs from January 2004 to December 2013. More than 395 thousand guaranteed credit lines were granted through 89 Financial Intermediaries (FIs) along this period. The database contains information about the credit lines covered by FEGA alone, FO- NAGA alone and FEGA and FONAGA combined. The amounts of guarantees are in constant Mexican pesos (MXN) with an adjusted money value as of 12/31/2010.2 More than 139 types of agricultural and other primary products received credit guarantees, in five broad categories: (1) Agricultural produce, (2) Forestry, Plant-Fruit-Flower growing, (3) Livestock, (4) Fishery and (5) Other Productive Chains. Table 3 shows the types of produce and the percentage of guaranteed credit lines issued in the 2004-2013 period. In what follows, we focus on beans, corn, sorghum, and wheat production. With these data in hand, we perform an exploratory spatial data analysis (ESDA) of the CGS allocations. The identification of patterns of spatial association, clusters or hot spots or atypical locations is important to understanding how FEGA and FONAGA operate as second-tier financial providers. If financial intermediaries are not willing to provide financial services in certain locations or do not have enough infrastructure to operate, and this should be appeared in the spatial analysis, as should evidence about whether the programs are reading the poorest rural regions. Besides demand and supply considerations, CGS is also dependent on public policy definitions that establish prioritized regions with less economic development. For instance, since 2013 FONAGA has been allowed to give more coverage for capital-labor credits to SMEs located in the south-southeast region and to 400 more municipalities that are part of the Cruzada Nacional contra el Hambre -national crusade against hunger- (Fideicomisos Instituidos en Relación con la Agricultura, 2019). However, it is probable that such policy priorities are not necessarily being fulfilled in practice due to FI preferences for credit allocation, finding some dislocations between FI’s service supply and policy-targeted regions. Maps showing clusters of CGS allocation in combination with policy-targeted regions canshed some light about the level of public-private coordination.
Table 3 Types of produce and guarantees based on economic activity.
| Economic Activities | Number of types of produce |
Percentage of guaranteed credit lines |
| Agricultural Produce | 56 | 48.2 |
| Other productive chains | 1 | 17.3 |
| Forestry, Plant-Fruit-Flower growing | 62 | 16.6 |
| Livestock | 9 | 16 |
| Fishery | 11 | 1.8 |
Source: FIRA (table is own elaboration).
Some municipalities have many CGS operations and others barely accumulate a handful of credit guarantees. Yet FEGA is a cross-country program, meaning that eligibility conditions should not discriminate among regions, although FONAGA introduced some policies favoring the less advanced regions of the country. A spatial analysis will serve to identify whether the credit allocation is clustered in certain areas and if such clusters are in regions with low productive efficiency.
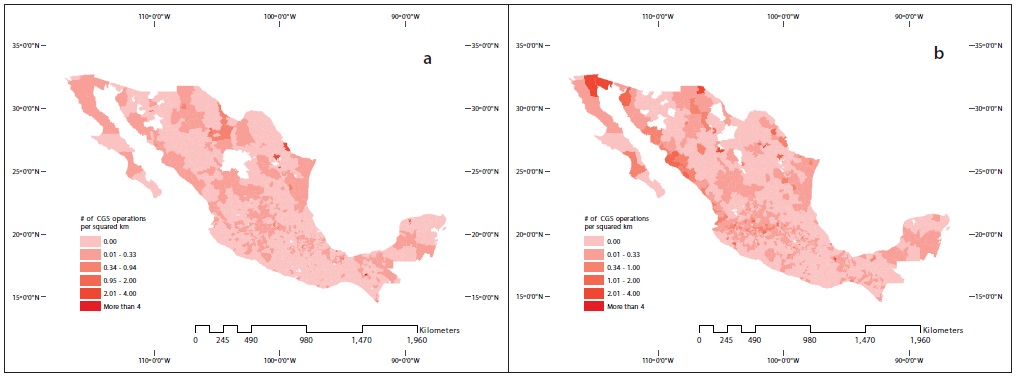
Were, then, the CGS concentrated regions, and were these the regions most in need? All Mexican states have had at least one credit operation for traditional cultivation that is covered by the FEGA- FONAGA programs. However, at the municipality level only 55% had at least one credit guarantee issued between 2004 and 2013, and the allocation of program benefits is highly unbalanced. Although almost all municipalities (98.5%) cultivate at least one of the four selected crops, many municipalities are not yet included in the program. Figure 1 shows the allocation of credit guarantee operations per square kilometer of municipal cultivable land for the selected crops at the beginning and at the end of the analyzed period. In 2004, only a few municipalities had four or more (up to an average of 4.2) guaranteed operations per square km. From one to less than four operations per squared kilometer predominated in less than a half of the municipalities that cultivated the selected crops and the rest did not enjoy the program benefits.
Source: SIAP & FIRA.
Figure 1 Number of guarantees per km2 in 2004 and 2013. 5Source: Servicio de Información Agroalimentaria (SIAP) y Pesquera & FIRA (maps is own elaboration). a. Beans, Corn, Sorghum & Wheat Cultivated by areas backed by CGS in 2004.
Ten years later, including FONAGA operations after 2008 the credit guarantee allocations had increased to four or more and up to an average of 142 operations per square km in some municipalities, but predominantly in the same regions. Figure 2 shows that funds invested also increased through time, although in the same zones in 2013 as in 2004.

Source: Servicio de Información Agroalimentaria y Pesquera (SIAP) and FIRA (maps is own elaboration). a. Beans, Corn, Sorghum & Wheat Cultivated by areas backed by CGS in 2004. Source: SIAP & FIRA. b. Beans, Corn, Sorghum & Wheat Cultivated by areas backed by CGS in 2013.
Source: SIAP & FIRA.
Figure 2 Amount covered by guarantees per km2 in 2004 and 2013.
These allocations are inconsistent with program goals that combine credit assistance to small business with poverty alleviation. They do not indicate any focus on areas that historically have been left behind identified by Consejo Nacional de Evaluación de la Política de Desarrollo Social (CONEVAL) -National Council for Social Development Policy Evaluation-. CONEVAL used measures of poverty at the municipal level based on statistical procedures that combine household surveys with census data to achieve representativeness and reasonable measures of income or consumption.
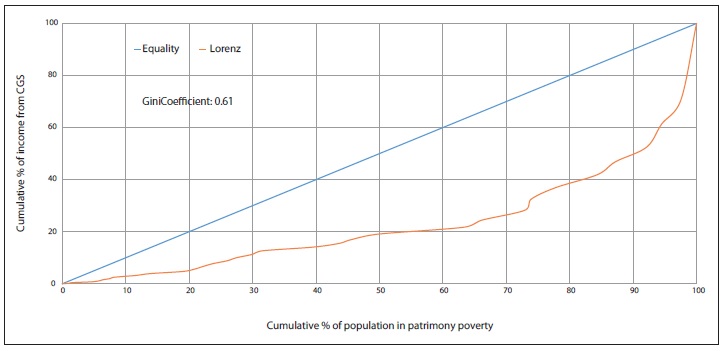
Overall, the highest poverty levels are located in the central and southeast regions of the country. The Cruzada Nacional contra el Hambre that was addressed by FONAGA, identified the municipalities within such regions, but CGS program expansion into much areas is not clear at first glance. In fact, measures of distribution such as Lorenz curve and Gini coefficient (Figure 3) show that there is a considerable unequal distribution of income (0.61) across the 32 Mexican states coming from CGS to the proportion of population with patrimony poverty according to CONEVAL (2005).
To this end, we rely upon a Hot Spot Analysis (HSA). The purpose of HSA is to look for spatial patterns of CGS-issued operations within regions. A high number of CGS operations within contiguous municipalities suggests a hot spot while low number of credit guarantees within municipal neighbors poses a “cold spot” difficulty. To this end we calculate the Getis-Ord Gi* statistic, a spatial association measure based on distances among neighbors (Getis & Ord, 1992). The Gi* statistic returns as a normalized score for each municipality in the dataset. Positive and statistically significant scores mean clustering of high values. The larger the score is, the more intense the clustering of hot spots. Statistically significant negative scores represent an intense clustering of cold spots (Mitchel, 2005).
To ensure consistent measurement across the country relevant neighbors are defined as those within a Fixed Distance Band (FDB) established via spatial autocorrelation estimation by choosing the distance band with the highest spatial autocorrelation.
Such distance maximizes spatial clustering for the analyzed attributes per municipality such as the number of CGS operations or the amount covered by the program. In the present case, we calculated the spatial autocorrelation Moran’s I recursively to find the highest Z-score. The higher the score, the greater the spatial clustering among attributes in the studied area (Moran, 1950). Table 4 shows the distances that maximize clustering per year at the municipal level and for the number of CGS operations per square km, and CGS amount covered per square km within the whole country.
Table 4 Global Moran’s I Spatial Autocorrelation highest distances (kms).
| Year | 2004 | 2005 | 2006 | 2007 | 2008 | 2009 | 2010 | 2011 | 2012 | 2013 | Avg |
| CGS Operations |
308.71 | 292.96* | 340.22* | 277.20 | 245.69 | 277.2 | 371.74* | 371.74* | 245.69* | 371.74* | 277.20 |
| CGS Coverage |
229.93* | 371.74* | 308.71 | 229.93* | 261.45* | 371.74* | 371.74* | 371.74* | 277.2 | 340.25* | 292.95 |
* Distances that had no significant Moran’s Index, not computed for average.
Once the fixed distance band with the highest z-scores is found per year, the average of maximizing distances is used to perform the HSA. Figure 4 shows annual maps of the clustered areas with the highest magnitudes (hot spots) and clustered areas with the lowest values (cold spots) of CGS operations per square km. The cluster analysis is performed per year to verify whether a displacement of hot/cold spots took place through time. It is important to remember that FONAGA started operations in 2008 with clear policies that favored disadvantaged areas, and this is expected to show up as an adjustment of the program spatial allocation.
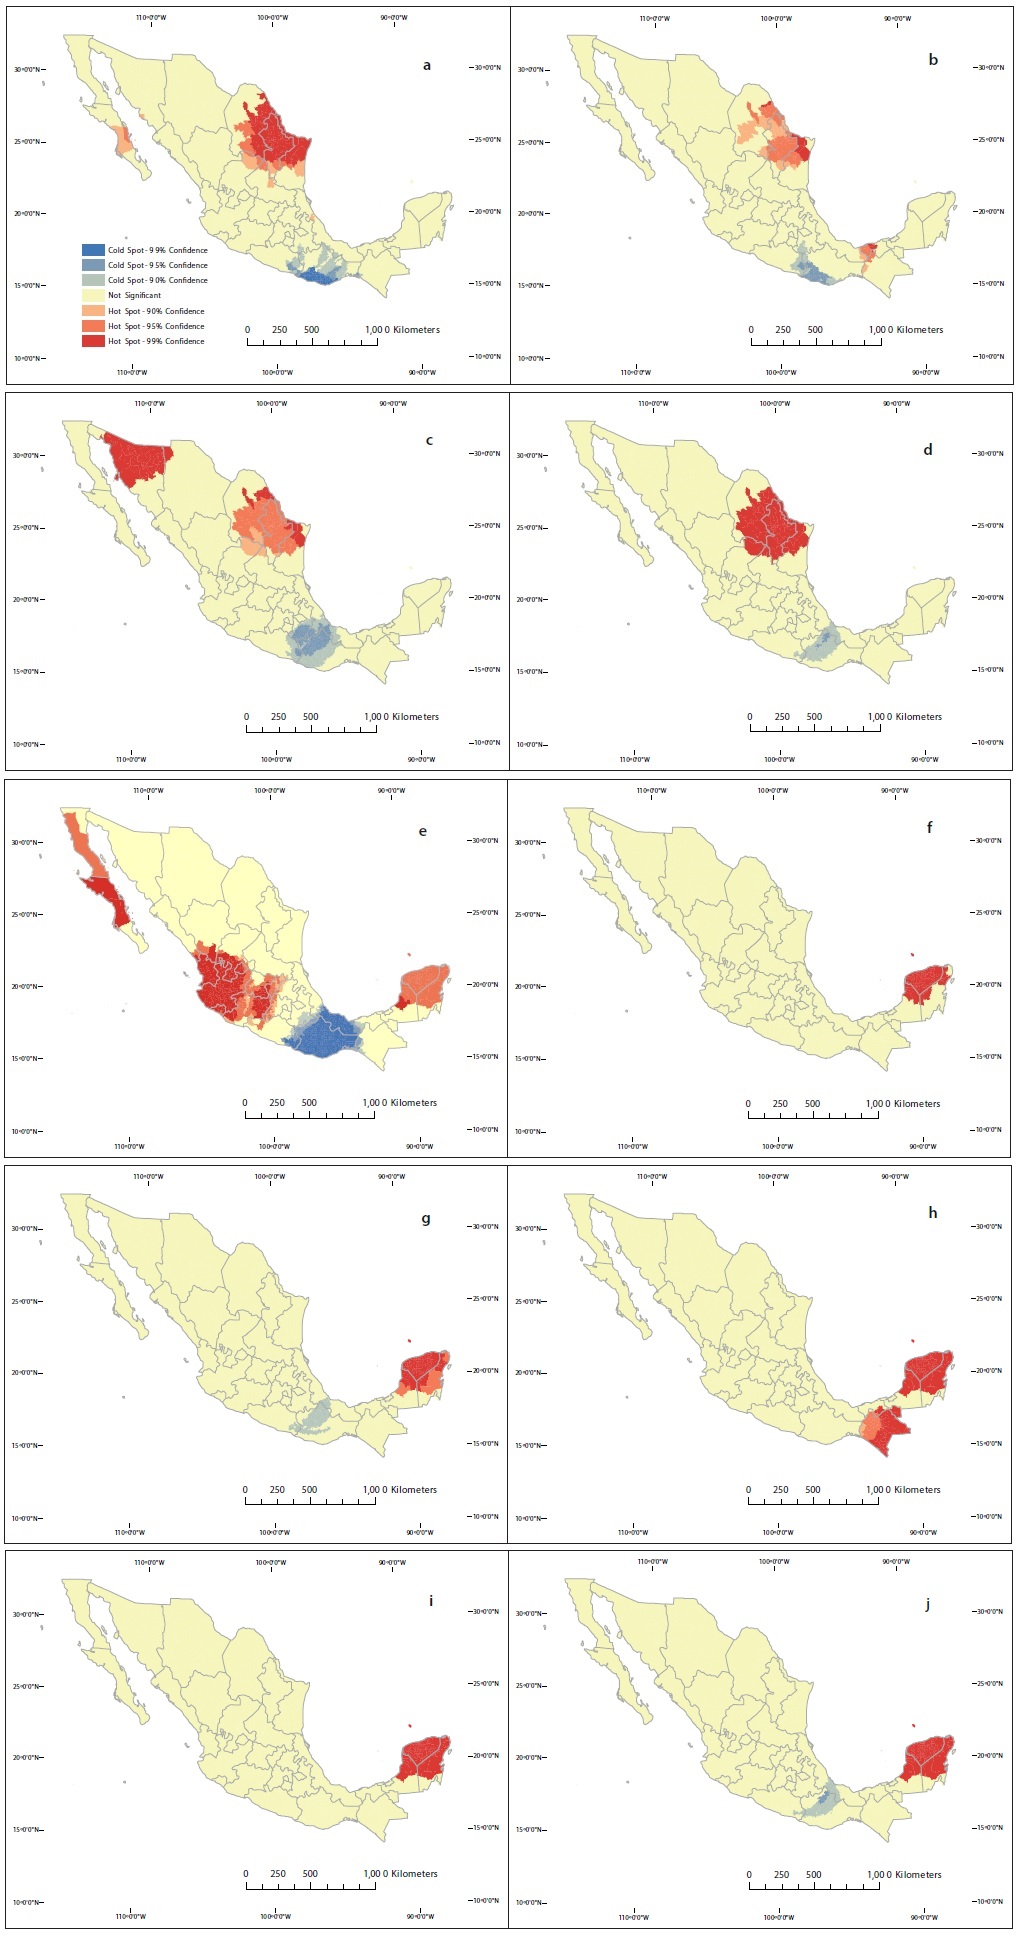
Source: FIRA (the maps are own elaboration). a. Hot/Cold Spots of the number of guaranteed operations per squared km in 2004. Source: FIRA. b. Hot/Cold Spots of the number of guaranteed operations per squared km in 2005. c. Hot/Cold Spots of the number of guaranteed operations per squared km in 2006. d. Hot/Cold Spots of the number of guaranteed operations per squared km in 2007. e. Hot/Cold Spots of the number of guaranteed operations per squared km in 2008. f. Hot/Cold Spots of the number of guaranteed operations per squared km in 2009. g. Hot/Cold Spots of the number of guaranteed operations per squared km in 2010. h. Hot/Cold Spots of the number of guaranteed operations per squared km in 2011. i. Hot/Cold Spots of the number of guaranteed operations per squared km in 2012. j. Hot/Cold Spots of the number of guaranteed operations per squared km in 2013.
Figure 4 Hot Spot Analysis. Number of Guaranteed operations per km2 2004-2013.
Where do the hot and cold spot configuration of the CGS operations reveal? From 2004 to 2007 there are consistent and statistically significant clustering patterns in the north (hot spots) and south-central (cold spots) and hot spots appeared in the northwest region in 2006.
However, in 2008, the year when FONAGA started operations, the patterns changed significantly. Operations moved from northern to western and southeastern municipalities. This movement suggest that program policies worked to move FEGA-FONAGA operations to the zones with more needs. In 2009 and 2010 the high number of guaranteed operations increased the allocation intensity in the municipalities of the states of Quintana Roo, Campeche and Yucatan. By 2011, a new hot spot appeared in the state of Chiapas a southern border state adjacent to Guatemala and Belice. In general, the hot spots shifted from the north to southern regions in the 2008-2013 period. This finding is completely in line with the FONAGA directives. Based on the low proportion of FONAGA-only operations compared to total number of operations, it is evident that the new policies influenced the extant FEGA operations to move to other regions of the country. Early cold spots in contrast, the less favored municipalities persisted in the Istmo de Tehuantepec zone where municipalities of Oaxaca, Veracruz and Tabasco had consistently received small number of CGS operations, tended to vanish between 2010 and 2013.
In terms of guaranteed resources invested per square km of cultivable land, the clustering behavior followed similar patterns as the number of CGS operations. Figure 5 shows the hot and cold spot maps per year.

Source: FIRA (the maps are own elaboration). a. Hot/Cold Spots of the amounts guaranteed per squared km in 2004. b. Hot/Cold Spots of the amounts guaranteed per squared km in 2005. c. Hot/Cold Spots of the amounts guaranteed per squared km in 2006. d. Hot/Cold Spots of the amounts guaranteed per squared km in 2007. e. Hot/Cold Spots of the amounts guaranteed per squared km in 2008. f. Hot/Cold Spots of the amounts guaranteed per squared km in 2009. g. Hot/Cold Spots of the amounts guaranteed per squared km in 2010. h. Hot/Cold Spots of the amounts guaranteed per squared km in 2011. i. Hot/Cold Spots of the amounts guaranteed per squared km in 2012. j. Hot/Cold Spots of the amounts guaranteed per squared km in 2013.
Figure 5 Hot Spot Analysis, amount guaranteed (MXN millions) per km2 2004-2013.
In 2004, heavy guarantee coverage was concentrated in northern states of the country. Municipalities from Tamaulipas, Nuevo Leon, Coahuila, Sonora, Baja California, and Baja California Sur were covered by higher amounts of guarantees than the rest of Mexico and Oaxaca and Veracruz received consistently low coverage per square km of cultivable land. This problem remained the same until 2008 when southeast municipalities emerged with high amounts of coverage. 2011 confirmed the high intensity of FEGA-FONAGA delivery to municipalities of Chiapas.
The combination of a significantly high number of operations and high amounts covered by CGS in the southeast region was associated with a downward shift of the average amount per CGS operation: targeted program beneficiaries after FONAGA took place primarily in the states of Campeche, Yucatan, Quintana Roo, and Chiapas where small-scale farmers were in greater need.
CONCLUSIONS
Research based on spatial analysis is widespread in commercial banking. There are models of decision-making under risk and uncertainty in which loans are issued to small businesses with imperfect information (DeYoung, Glennon, & Nigro, 2008). These models use physical distances bet- ween lenders and borrowers to test potential impacts on adverse selection problems. Insurance companies also take into account spatial variables to determine premium costs. In agriculture, spatial externalities can affect economic welfare and landscape patterns by linking farm returns on ad- joining parcels of land (Lewis, Barham, & Zimmerer, 2008). Until now this type of analysis has not been used to evaluate the targeting of CGS operations. Its application provides a different and important perspective regarding CGS performance. The exploratory geographic data analysis (ESDA) showed that CGS were concentrated principally in the northern municipalities before FONAGA. In 2008, there was a shift in the concentration of CGS operations to the southeast region; however, FONAGA therefore influenced FEGA to move operations to regions afflicted by high levels of poverty according to CONEVAL measures. The spatial patterns of the FEGA-FONAGA credit allocation were concordant with the shift in 2008 of FEGA-FONAGA guarantees to small-amount credit operations, pointing to the inclusion of more small-scale producers located in regions that have the poorest rural businesses.
From the viewpoint of a trust fund administrator, the program performance therefore has been successful. However, clustering patterns that include both hot and cold spots are evidence of a continuing uneven distribution of the credit guarantees. These patterns point to the need for FONAGA to explore additional ways to provide financial access to rural businesses that do not have private funding. The ultimate objective is to produce economic development in rural areas and to establish the necessary conditions to pro- duce business transformation and inclusion in the market economy.

