


 nueva página del texto (beta)
 Inglés (pdf)
 Artículo en XML
 Referencias del artículo
 Enviar artículo por email
 Citado por SciELO
  Similares en
SciELO
Similares en
SciELO 
 Permalink
INTRODUCTION
Transportation planning has been changing to an employment accessibility-oriented paradigm in response to negative environmental and social externalities ascribed to the mobility-driven paradigm that predominated in the second half of the last century (Rode et al., 2014). Mobility approach focused into improve the levels of service of transportation infrastructure with a clear bias toward the private car use. Conversely, accessibility while still recognizing the aspect of easiness of mobility in different transportation modes it also stresses the issue of land uses policies as a mean to decrease distances and/or times of travel. Thus, an accessibility indicator that include these two aspects, easiness of mobility by transportation modes and traveled times, works as an appropriate benchmarking of transport policies. Moreover, accessibility indicators have allowed to link transportation problems and important social policy issues such as urban poverty, unemployment, exclusion, etc. Under the new paradigm the issue of equity in transportation modes, along with socioeconomic and spatial dimensions, have become primary concerns on the agenda of accessibility planning (Jaramillo, Lizárraga, Grindlay, 2012; Lucas, 2012). Assessing the benefits of transportation projects and policies based on improving employment accessibility (referred to hereafter as accessibility) in the metropolitan landscape has become a necessary practice (Foth, Manaugh, & El-Geneidy, 2013), and to accomplish this, frameworks have been proposed to assess equity in terms of spatial and social disparities (Martens, Golub, & Robinson, 2012).
Commuting to work is the main source of intraurban trips in many cities around the world, and is a key issue of urban transportation policy (Rode et al., 2014). Different metrics have been proposed to assess accessibility. However, it has been shown that some of these metrics produce different geographic assessments, which has hindered the identification of the effect of unequal commuting experiences and of their relationship with other important aspects of social policy (Merlin and Hu, 2017). Thus, the development of proper metrics is essential to establish a link between the concept of accessibility and the development of urban policies and their implementation (Manaugh, Badami, & El-Geneidy, 2015; Boisjoly and El-Geneidy, 2017). To establish this link, Shen (1998) developed an indicator that has proved to be robust in its application in cities with different spatial structures. In his methodology, Shen includes the competition for opportunities and travel times for car drivers and public transit (hereinafter transit) users, unveiling important nuances in the patterns of metropolitan accessibility.
Using Shen´s indicator it has been shown that in highly automobile-oriented metropolitan areas of the United States the number of accessible job opportunities is considerably lower for transit users compared to those who drive cars, by far outweighing any location advantage that residents living near the central areas of a city or in suburban sub-centers may have. Thus, although location is important, the key factor for low-income workers seeking job opportunities is their transportation mode (Shen, 1998). Kawabata and Shen (2007) state that to be able to make a systematic international comparison of the relationship between accessibility and commuting time, we first need to understand the nature of the commuting inequality between driving a car and using transit in metropolitan areas that have differing transportation systems and urban spatial structures.
Latin America encompasses vast socioeconomic inequalities where transportation systems are made up of both formal and informal schemes that must be evaluated in terms of their capacity to meet the needs of those who are socially excluded (Delmelle and Casas, 2012; Stanley and Lucas, 2008). Although specific urban form varies for different US cities (where Shen´s indicator have been widely used), there are some features than distinguishes MCMA from them. For example Firstly, there is a relatively high level of intra-metropolitan transit ridership in MCMA, which is 66.51% of all trips, while 38.7% for trips to work in CDMX (Mexico City, formerly the Federal District), and 51.1% for trips to work in the rest of the municipalities (2017 Household Origin-Destination Survey (HODS17). On the other hand, in US the average of transit use was only 5.1% of all trips in 2011 (US Department of Transportation, 2011), whereas commuter transit ridership in all US cities but New York, New Jersey and Philadelphia is lower than in CDMX (Gilbert, 2017), additionally transit ridership has fallen in many of the top 50 transit markets (Mallet, 2018). Secondly, in MCMA there has been a process of urban sprawl driven by extensive migration from the countryside over the past century and residential decentralization of affluent areas due to the fear of the instability of infrastructures in the inner-city during earthquakes (Aguilar and Ward, 2003; Isunza and Soriano, 2008; Pradilla, 2016). Thirdly, comparing MCMA with other metropolitan areas of similar population size such as Los Angeles and New York, what is called the central area is a relatively large geographical area with a high share of the metropolitan employment which is an indication of this highly influential inner city in the jobs market. This issue will be taken up in more detail in the following section.
This research addresses a question that can be divided into two parts. In the first part we assess whether there are substantial differences in accessibility depending on transportation modes (cars and transit) and the differences between the formal sector and total employment (formal + informal). The strength of these differences was analyzed using two models of accessibility and two sources of travel-time data. The second part of the research question was to learn whether the accessibility geography resembles the urban structure reported in the literature.
Compared to previous research on accessibility in the MCMA, the present work incorporates three aspects that have not previously been approached in conjunction: 1) analysis at a more detailed geographical level instead of on the municipal level; 2) considering the demand side of the labor market; and 3) disaggregating travel-time data by transportation mode. According to Merlin and Hu (2017), all of these aspects are significant in achieving a realistic overview of accessibility.
STUDY AREA
Over the last three decades research has been devoted to assessing the MCMA urban structure that began with the monocentric model, but the debate has now been directed towards determining the extended polycentricism that has emerged. Recently, there has been a certain consensus for considering the polycentric evolution of the MCMA yet in its early stages, this is being undertaken using the employmentresident ratio (Suárez and Delgado, 2009), the trips-flow approach (Casado, 2012), and the land use approach (Montejano, Caudillo and Silván, 2016).
Most of the sub-centers found in seminal research in the polycentric evaluation of the MCMA have been considered in subsequent research to be corridors and extensions of the central area, while the appearance of more external cores depends to a great extent on the point of reference from which the analysis was based. Beyond the interpretation of the urban structure which is still in debate, what is clear is the existence of what is called a central area (CA) that correspond to an influential Central Business District and its associated corridors elongating from this through specific avenues, this whole central area is characterized as being a large area with a relative important share of employment. This can be showed in a comparison of the relative magnitude of this CA with the corresponding central areas of cities of similar size in the US. For example, even a conservative estimation of the central area in the MCMA is 121.50 km2 (Casado, 2012), which is approximately 27 km2 larger than the Los Angeles central area and 2.5 times larger than the central area of New York City (Glendening, 2012), this latter with a population comparable to that of the MCMA. In terms of the metropolitan share of employment, MCMA’s Central Business District identified by Casado (2012) includes 32.7 % of the metropolitan employment, which is superior to the employment share of the Central Business Districts in New York City, which in 2000 was 21.2%, and that in Los Angeles was 13% (Lee, 2007). It is important to clarify that it is not the intention of this work to make an interpretation of the urban structure in terms of the debate monocentric - polycentric rather we describe whether there is a spatial overlap between the areas of high accessibility and the central area reported in the literature for the MCMA.
LITERATURE REVIEW
Urban spatial structure and commute inequity
The concept of urban structure refers to the spatial distribution of residencies and economic activities in a city. There have been contrasting views in academic scholarship as to the effects of urban structure changes on commuting ever since the seminal works in this debate appeared some 30 years ago. Since then, diverse evidence has been reported in the literature. For some, land use patterns play a fundamental role in determining travel behavior, and therefore associated initiatives should be applied to reduce congestion, air pollution, dependence on automobiles, and such issues as the ‘job-housing balance’ (Cervero, 1989; Cervero, 1996). On the other hand, some researchers dismiss the relevance of physical planning in favor of market-driven policies (Giuliano, 1991). In the US, a parallel research field on accessibility has incorporated the study of what is called a ‘spatial mismatch hypothesis’, which, according to Kain (1968), shows that the distribution of employment for African-Americans, most of whom live in central urban areas, is affected by segregation in the housing market. This reduces the number of accessible employment opportunities available to them, and employment suburbanization aggravates the problem. Research results are disparate, both supporting and contradicting this claim. The varying and inconsistent manners of operationalizing the urban structure could be the source of this disagreement (Gobillon, Selod, & Zenou, 2007; Grengs, 2010; Ong and Miller, 2015). Given that transportation disadvantages can arise from various factors (location, transportation system, individual characteristics, etc.), authors such as Grengs (2010) claim that these debates should be reconceptualized with the inclusion of the concept of accessibility.
Location-based accessibility and metropolitan inequities
In this paper I follow the definition of accessibility given by Merlin and Hu (2017) as the measure of the ease in reaching employment opportunities distributed across distances from different residential locations. Geurs and Wee (2004) argue that accessibility has four elements that are theoretically important for such a definition - land use, transportation, time and individual characteristics - and that the concept of accessibility involves an irreducible relationship between these elements. Geurs and Wee (2004) identified four basic perspectives of the measurement of accessibility: infrastructure-based, location-based, person-based and utility-based. Of these categories, location-based indicators represent the most appropriate manner of measuring intra-metropolitan variability, often at the Traffic Analysis Zones (TAZ) level, because these allow for a clearer understanding of the role of location as a causal factor in the formation of disadvantageous transportation patterns (Farrington, 2007). With an accurate knowledge of the spatial patterns of accessibility researchers could contribute to the design and implementation of improved accessibility programs that are often based on location (Shen, 2000).
The Shen (1998) equation is a location-based indicator that takes into account primarily land use and the transportation aspects of accessibility. Land use is taken into account by considering the urban geography of employment opportunities, while the transportation aspect involves an assessment of travel-times that sums up the existing transportation alternatives of a certain location. When disaggregating data by travel mode (car or transit), location-based indicators provide insights into the relative importance of each travel mode in an urban spatial structure (Kawabata, 2009).
A common approach for measuring accessibility is the gravity-based model, which was initially developed by Hansen (1959). This model involves calculating the number of job opportunities available depending on a given travel cost that includes travel distance and time. In its initial form, this simple model lacks two aspects that are rarely considered in the literature: 1) the incorporation of both the supply and demand sides of the labor market and 2) disaggregation by travel modes. Shen (1998) addressed these limitations, and his solution yields fruitful insights, because jobs and workers are not equally distributed within metropolitan areas, and differentiating between car and transit users provides very different images of accessibility. In US cities this index has shown that, when compared with workers living in the suburbs, less educated workers living in the central urban area are not significantly disadvantaged with respect to accessibility.
There is strong evidence that suggests that commuting by car largely determines the accessibility to jobs; thus, not having a car for commuting can be a major barrier to participation in economic activities (Shen, 1998; Kawabata and Shen, 2007). This evidence suggests that the inequality in accessibility between car and transit users is particularly acute in low-density, highly automobile-oriented urban spatial structures. In cities such as Hong Kong and Tokyo with high population densities and substantial transit coverage, accessibility has been found to be much higher for transit users than for car users (Kwok and Yeh, 2004). Kawabata and Shen (2006) also found that accessibility for transit users is much lower in US car-oriented cities like Boston and Los Angeles than in Tokyo.
Previous location-based methods for job accessibility assessment in MCMA
Suárez and Delgado (2007) used the gravitybased model with an inverse power impedance function for the distance network at the municipality level, and accounted for the labor demand (disaggregating the data by sector of occupation and income level) by considering the proportion of each population group living in each tract, but without considering the possibility of people commuting from other parts of the city to compete for the same jobs in a given tract. Caudillo (2017) used a variation of the gravity-based accessibility indicator applying the squared inverse distance as an impedance function at the census tract level. He tested two different measures of distance (Euclidean and Manhattan), but his methodological approach did not consider the demand side. In these two examples the general pattern of accessibility in the MCMA shows only slight differences from the previously reported highly concentric pattern of the employment geography in the MCMA.
Casado (2012) and Suárez and Delgado (2007) used a trips-attraction capacity approach at the TAZ level aimed at assessing the urban structure, and with this it is to be expected that assessing accessibility also based on travel data will result in finding similarities within such an urban structure. In other words, it could be interpreted that the accessibility landscape has a direct effect on such urban structure. However, it is important to point out that under the conceptual framework of accessibility, an accessibility-rich area is not necessarily an urban employment core if travel time is sufficiently short.
METHODS
Data
HODS17 split the MCMA into 194 TAZs, and this geographic scale is used for the present analysis. Four types of data are needed for the expected accessibility estimation. Firstly, using time matrices by transportation mode (car or transit) that captures travel times between each pair of TAZ are key inputs. Thus, for travel-time matrices we used two data sources. One was the HODS17 that provides time information for 64,494 intrametropolitan work trips, and based on these data, two matrices (one for car and another for transit) were extracted using the factor expansion to weight each trip as a representative sample of its corresponding TAZ. However, not all cells from the 194x194 matrix were filled, so estimations for the empty cells were constructed using a simple regression model of time versus distance to the centroid for each HODS17-TAZ. The reason for using travel-time matrices is that they reflect the intra-metropolitan differences in the levels of service of the transportation infrastructure for both car and transit, thus using a specific time-distance relationship for each TAZ was used to capture such location transportation characteristics. This can be considered to be a time-distance hybrid approach.
The other source of trip-time information was obtained from the region’s travel demand model, TRANUS (model 2013, modeling date 25-02-2014) provided by the Institute for Transportation and Development Policy (ITDP) (Navarro & Viñas, 2014). The calibrated trip matrices include travel times at peak morning hours between the region’s 978 TAZ; however, these times were applied to the HODS17-TAZ by associating each HODS17-TAZ with the TRANUS-TAZ that contains the HODS17-TAZ centroid in order to maintain congruency with the geographical unit of analysis selected for the present study. In the case of the peripheral HODS17-TAZ in which the geographic centroid did not lie in an urban area, we made a correction to place the point of reference in its corresponding central urban area. We selected two matrices for this study, transit and car, and the two sources of travel times, HODS17 and TRANUS, were used to check the consistency of the results. Therefore, we based the analysis of accessibility on four time-matrices: 1) car time from TRANUS; 2) transit time from TRANUS; 3) car time from HODS17; and 4) transit time from HODS17.
Secondly, the supply side of the jobs market is represented by employment data for which two approaches were followed, one for formality and the other for total employment (formal + informal). In the case of the formality approach, we got the data from the TEPA database provided by the Mario Molina Center for Strategic Studies on Energy and the Environment (2016) that contains the estimated number of jobs per block. These employment data are estimations based on the number of economic units reported in the 2013 economic census and the corresponding numerical range of workers in each of those units. We added the values of the TEPA database that lay within each of the HODS17-TAZ. Aggregating spatial data may introduce some errors in the spatial analysis (known as the modifiable areal unit problem), but the HODS17-TAZ included the smallest area units for which all the necessary data were available. In the case of the total employment approach, we considered total trips to work attracted to each HODS17-TAZ as a proxy of total employment, an approach used previously by Suárez and Delgado (2009), who estimate that economic informality represents over 40 per cent of total employment.
This work considers these two useful and feasible scenarios for job accessibility evaluation, formal and total employment. On one hand, total employment (formal plus informal) considers that all job seekers compete for all available job positions, this offers a first and general depiction of job accessibility. On the other hand, the second scenario considers accessibility only to the formal sector, it is assumed that these jobs are the priority for those job seekers, this scenario represents the main objective of any urban policy aimed at integrate to the formality to all the labor force. We consider that to evaluate job accessibility only to informal employment (total employment minus formal employment) is an unreal scenario given that for all job seekers informality is not the first option, on the contrary it is assumed they go to informality once that the formal sector is no longer achievable due to a lack of opportunities. Moreover, if we consider evaluation of job access only to informal jobs, we would have to extract the share of the Economically Active People (EAP) available to match those jobs adding a difficulty the fact that some of them go back and forth from the informality.
Thirdly, we extracted the working population for each census tract from the 2010 census (INEGI, 2010) under the variable Economically Active People (EAP), this variable represents the demand side of the jobs market. The MCMA contains 5,648 census tracts; so, in this case we added the values of the 2010 census tracts that lay within each of the HODS17-TAZ. Finally, trips to work matrices that capture the commute flow between each pair of TAZ were extracted from the HODS17 in a similar manner as that used for time matrices.
Employment Accessibility
We estimated two accessibility measurements: the gravity-based model (GBM) and the Shen indicator. The gravity-based indicator is modeled with a negative exponential impedance function:
Intra-zonal travel time was assumed to be 0.7 times the minimum travel time observed for each TAZ. The travel impedance function is specified as f(Cij) = e−bCij, where b is an empirically determined parameter. Based on an ordinary least squares (OLS) regression (log of trips to work vs travel time), the estimated value for TRANUS time matrices was -0.4 (TRANUS time was converted into minutes) and the value for the HODS17 matrices was -0.01. Thus, TRANUS b parameter is 40 times higher than for HODS17, this means that accessibility estimations of TRANUS will be always higher than the accessibility counterpart for HODS17. It is expected a difference in this parameter since time data was obtained with a different approach in both types of matrices. TRANUS provides travel times based on a transportation model which use information inputs of several sources not only from travel surveys but also use levels of services of transportation infrastructure. On the other hand, HODS17 represent average observed traveled times from each recorded trip in the survey. For our analysis of accessibility this is not necessarily an issue when comparing results between both matrices given that for this aspect, we are not comparing absolute values but the pattern of relative differences among TAZs, i.e. the ranking of inter TAZs accessibility. In the next section there is an explanation of this.
The approach of assessing accessibility using the formula developed by Shen (1998) is a variation of the Hansen Accessibility Index. This indicator captures the ‘demand side’ of accessibility, that is, the spatial distribution of workers. The final equation is as follows:
Where Ej is the number of relevant employment opportunities in location j; Ai v is the accessibility available for people living in location i and traveling by mode v; Cij is travel time from i to j; Wk m is the number of people living in location k and traveling by mode m to seek the relevant job opportunities; f(Cij v) and f(Ckj m) are the impedance functions for transportation modes v and m, respectively, which measure the spatial separation between i and j, and k and j, respectively. For an urban or regional system with M transportation modes, v, m = 1, 2, ..., M, and k locations, k = 1, 2, …, N. The travel impedance parameter is the same than the used for GBM.
The general accessibility index proposed by Shen (1998) is as follows:
Where Ai G is the general accessibility for all groups of people living in location i; αi is the percentage of households with cars in location i. In this case we used the actual percentage of commute trips by car in each TAZ according to the HODS17. The number of workers corresponds to the EAP, while jobs were estimated based on the total of jobs available in all economic sectors. The inequality in accessibility between cars and transit in zone i (Xi) was calculated based on the following equation (Kwok and Yeh, 2004):
Equation (5) standardizes the difference between accessibility by car and accessibility using transit in a range from 0 to 1. The inequality in accessibility increases as the disparity measure approaches 1.
The population-weighted regional averages of accessibility by car (Acar), accessibility by transit (Atran), and the disparity of accessibility between using cars and transit (X) were calculated as follows (Kawabata, 2009):
Comparisons of job access evaluations
Thus, there are four basic aspects of comparison in this evaluation of job accessibility in MCMA. These are between sources of travel time data (Tranus vs HODS17), between methods (Shen vs GBM), between type of employment data (total vs formal) and between transportation modes (Car vs Transit) (Figure 1). Note that when doing each comparison, the rest of the aspects are kept constant. In the first two, absolute values of accessibility are not comparable. Both sources of travel time data followed different approaches in gathering the data, modeled times from TRANUS tend to be higher than HODS17 times for the travel among every TAZs pair. Likewise, GBM and Shen´s type equations have different units as well as upper and lower limits. For this reason, when comparing job access results between sources of time data or between methods the objective is to determine the consistency and robustness of the results in base of the job access ranking among TAZs. Thus, the Spearman Rank Correlation (SRC) is the appropriate indicator to check the consistency in the accessibility estimations. For example, a value close to 1 when comparing job access results between the two sources of travel time data would mean that the method is consistent and robust regardless such different sources of travel times data, which would be a desirable outcome. Moreover, a value close to 1 when comparing job access results between methods would mean that the job access estimation is convergent, here there is not any a priori expectation for some value, however when looking the variation of such indicator through other aspects of comparison can give us insights of how the accessibility estimation of each method is affected and therefore tell us which methods is more informative.
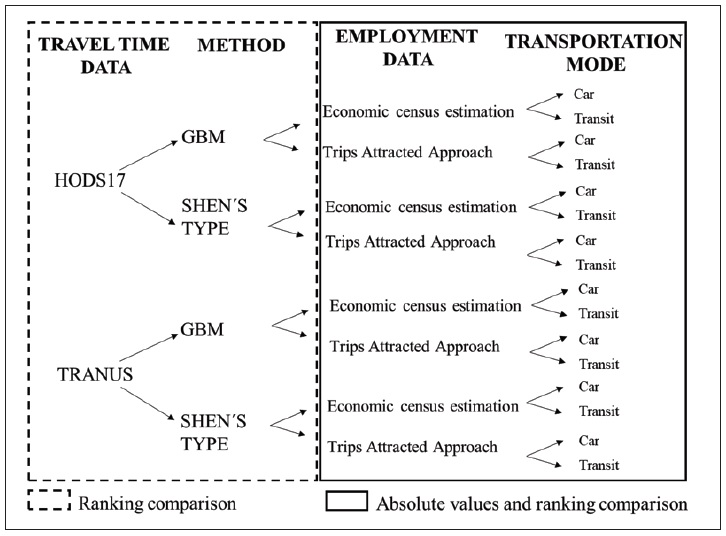
Then, in the other two aspects of comparison (Total employment vs formal employment; Car vs Transit) absolute values and rankings of accessibility are relevant. These two aspects represent direct variables embedded in both accessibility equations and therefore offer insights about how these factors impact accessibility. Overall, the purpose of analyzing the importance of these variations was to select those estimations with the highest consistency between travel-time sources but included further differences according to employment-type data and transportation modes. This information offers insights into the nuances of these aspects in the disparity of intra-metropolitan accessibility.
RESULTS
Spearman Rank Correlations can be seen in Table 1. This section presents the main findings by methods, starting with GBM.
Table 1 Spearman Rank Correlations between different estimations of accessibility according to the method, travel time source, employment data and transportation mode.
| Comparing | Accessibility Method | |
| GBM | Shen-type | |
| Travel time source (TRANUS vs HODS17) |
|
|
| Employment data (Formal vs Total) |
|
|
| Transportation Mode (Car vs Transit) |
|
|
Note: In parenthesis are the constants in the comparison. (For: Formality employment data; TA: trips attraction capacity approach for total employment; Car: car time; Tra: transit time).
Gravity-based model maps show an important variation in the patterns of accessibility, this can be showed with the comparative lower values of spearman correlation in the GBM than in Shen´s type in the comparison between travel time sources (Table 1). However, total employment gives more consistent accessibility results between travel-time sources than does formal employment, with a correlation coefficient of 0.64 for car and 0.74 for transit. The GBM estimations using the HODS17 data offers slightly larger accessibility differences (0.97 SRC) between employment data in comparison with estimations using TRANUS (0.99 SRC). Thus, gravity-based models using the HODS17 database and total employment are presented in Figure 2.
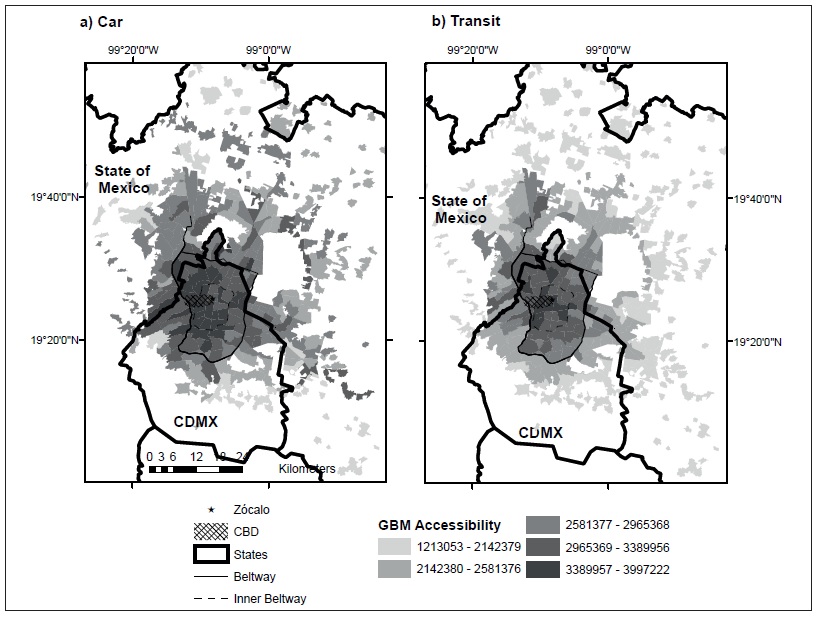
Figure 2 Accessibility with the GBM using the HODS17 database, accounting for total employment and both car (a) and transit (b).
Accessibility by car expand areas with the highest category outside the beltway (Figure 2a), while for Transit areas with this highest category remain mostly within the beltway polygon (Figure 2b) because of the prominent subway transportation system coverage in the inner city, as well as its high concentration of opportunities. Central areas in the west side within the beltway polygon have the highest accessibility values with the GBM since this model focuses on the supply side of the jobs market, therefore jobs-rich areas have the highest accessibility scores, then there is a decrease toward jobs-poor areas in the periphery, this can be noticed for every GBM model (Figure 3a). This negative relationship is not as clear as in the Shen´s type model.
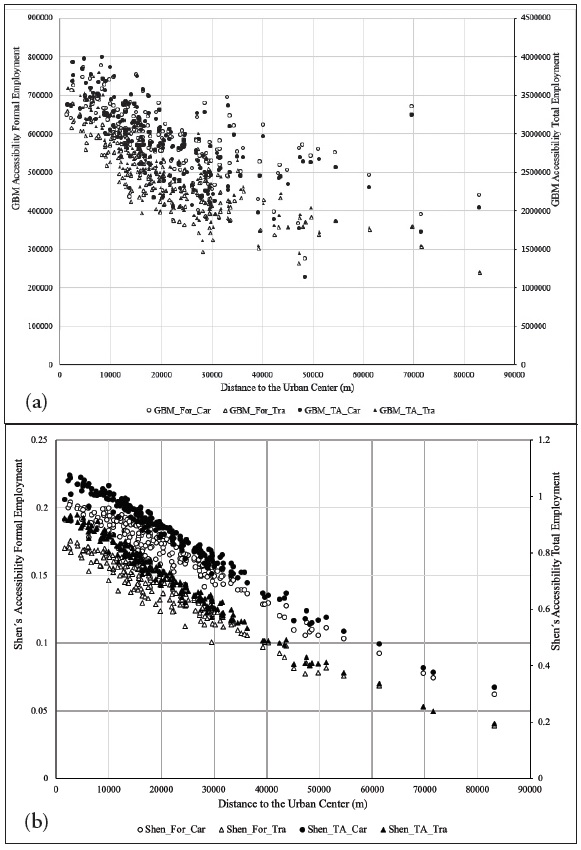
Figure 3 Accessibility vs Distance to the metropolitan center using the HODS17 database with GBM Accessibility (a) and Shen´s type Accessibility (b). (For: Formality employment data; TA: trips attraction capacity approach for total employment; Car: car time; Tra: transit time).
Overall, using the gravity-based model we find two main differences in accessibility according to the data used as input. Firstly, considering total employment considerably increases accessibility for all TAZ reflected in the magnitude of the accessibility indicator, however the spatial patterns (i.e. the ranking of the TAZ) is very similar, as we saw above. Secondly, with the TRANUS data accessibility is always higher for car users over transit users, but this is only generally true with the HODS17 data, because there are a few TAZ with no identifiable spatial patterns where accessibility is higher for transit users than for car users.
The Shen´s indicator shows a more consistent spatial pattern of accessibility between traveltime sources with a Spearman Rank Correlation of 0.81 for formal employment accessibility and 0.83 for total employment accessibility (Table 1). This gives credence to the results of the Shen´s indicator in which, unlike the GBM accessibility results we saw above, there was a lower correlation coefficient in the comparison between travel-time databases. With the Shen´s indicator employment data was shown to produce little dissimilarities with a correlation coefficient of approximately 0.97. Likewise, with the GBM these coefficients were approximately 0.98. With regard to the differences in accessibility between transportation modes, when using Shen´s indicator these are minimal, as we can see that the correlation indicator is 0.99 with the HODS17. For GBM the correlation indicator is 0.78 with the HODS17 and total employment. Using TRANUS the correlation indicators comparing transportation modes are very similar between GBM and Shen´s indicator, with values of 0.92. With these findings, the first part of the research question is answered. Then, the details of these differences are described in conjunction with the overall accessibility metropolitan landscape in relation to the urban structure, thereby addressing the second part of the research question.
The pattern of Shen´s accessibility in relation to the urban center is a well-delineated line with a negative slope (Figure 3b), showing the clear difference in access between the inner city and the periphery. There is no official delimitation of a specific Central Business District, but various authors refer to this as an area similar to the one represented in Figure 4, and from there it extends from north to south through Insurgentes Avenue in CDMX (Figure 5) in what Suárez and Delgado (2009) call a Central Agglomeration (CA). Then, extending from the CA we can identify what Suárez and Delgado (2009) call Adjacent Segmented Corridors (ASC), which are formed along the highways to Querétaro and Toluca. In Figure 4 the ASC is shown to correspond to areas extending into the State of Mexico from CDMX. The employment centers’ polygon of the CA and the ASC as a whole (hereafter called CA polygon) is represented in Figure 4 for formal jobs (a and c) and for total jobs (b and d), the latter being a geographical extension of the first.
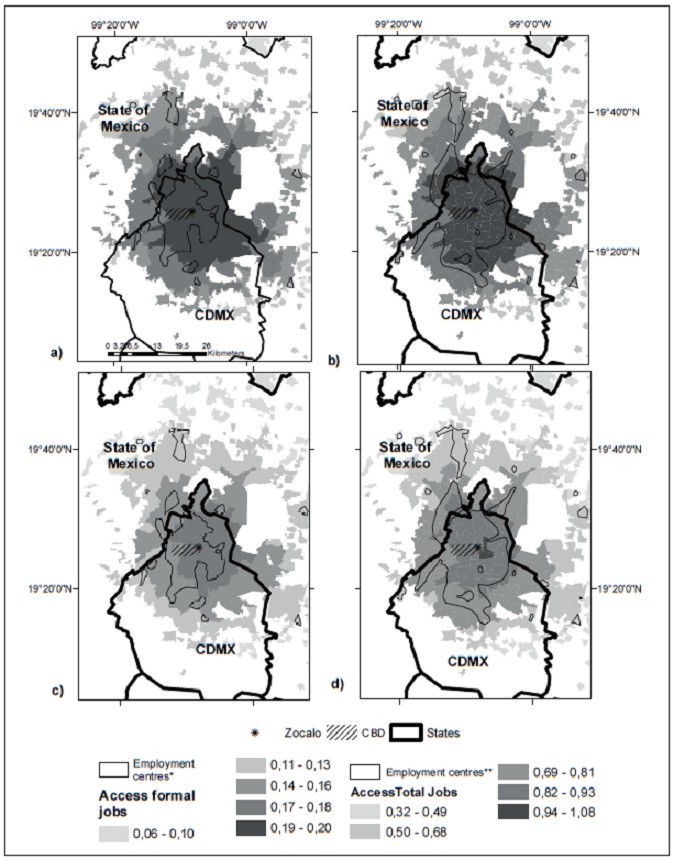
Note: *employment centres for formal jobs; **employment centres for total jobs.
Figure 4 Shen-type models with HODS17 travel time data for formal employment by car (a) and transit (c) and for total employment by car (b) and transit (d).
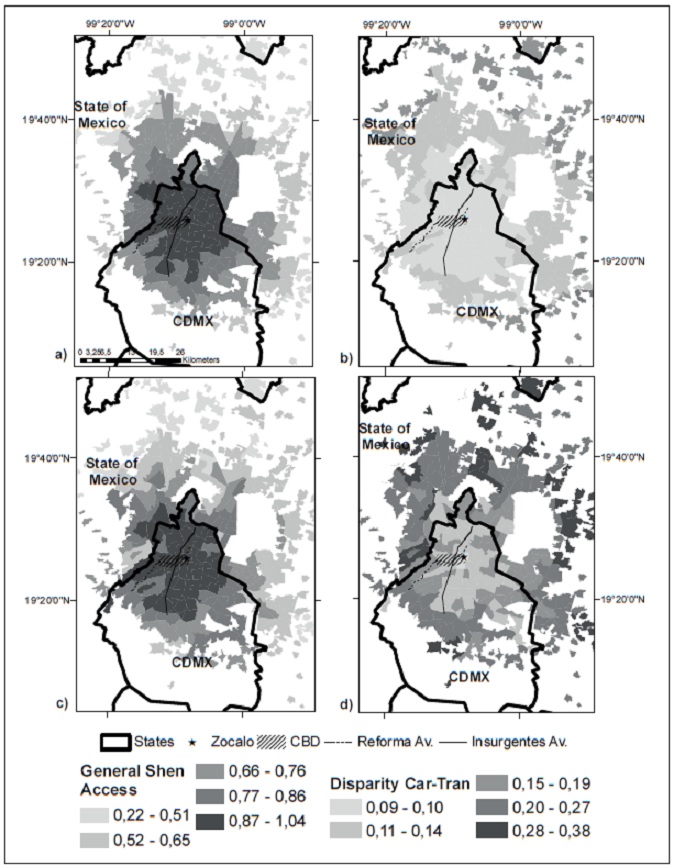
Figure 5 General Shen-type accessibility (left) using the HODS17 (a) and TRANUS (c) databases, and disparity in accessibility between car and transit (right) using the data of HODS17 (b) and TRANUS (d).
Overall, we can see that inside this CA polygon many of the TAZs with the highest metropolitan accessibility are located, which is consistent with any transportation mode and employment data. However, there are specific cases where this pattern is not followed. Using natural jenk breaks there are some TAZ inside the polygon with similar accessibility scores to some of those outside of the polygon, and this is more evident in the polygon that considers informality, principally those at the edge of the polygon. This means that some TAZ in the inner city could show medium accessibility regardless of their geographical inclusion in the polygon of the CA, probably due to factors such as a high workforce population that increases competition for opportunities, local problems of mobility caused by the urban structure, or infrastructure deficits. In any case, these results help to identify such problematic areas so that local problems can be addressed.
Surprisingly, there are several TAZs outside the polygon that have similar accessibility by car to those inside the polygon. Shen´s indicator does not necessarily coincide with employment centers, for example areas with low employment opportunities do not necessarily have low accessibility if either the competition for those employment opportunities is not significant or if there is sufficient capacity for mobility with direct road connections for those driving a car or efficient transit connections for others.
Using maps of the Shen´s indicator, when informality is included this again is shown to be the primary factor in increased accessibility. Everything else being equal, accessibility by car is higher than that for transit, and none of the TAZ contradict this in any of the travel-time data sources employed (maps not shown). Regarding the effect of the time data sources, differences between accessibility by car versus transit (in favor of car) are more prominent in the TRANUS database than in the HODS17 database, the gap being less in the HODS17.
Figure 5 shows the disparity in accessibility between car and transit for both HODS17 (b) and TRANUS (d). Overall, in central areas disparity in favor of car usage is less than in peripheral areas, which is reasonable given that the main transit infrastructure is concentrated in the central areas. In order to discuss the differences of accessibility by transportation mode and location we focus on the model that uses total employment, although similar arguments also apply to the model using only formal employment. Thus, the general disparity is only 0.09 in HODS17 and 0.18 in TRANUS (Table 2). It is useful to remember that the average accessibility in the region for total employment is the ratio between the number of jobs (total trips to work attracted 6,811,580) and the number of potential workers (EAP 8,966,847), which is 0.759. A property of Shen´s indicator is that accessibility measures per TAZ and transportation mode are standardized, so this average can be taken as a reference for comparison, and the average of these indicators weighted by EAP should result in that same regional average, this relationship was demonstrated by Shen (1998).
Table 2 Population-weighted regional averages of accessibility by car (Acar), transit (Atra), and the general disparity of accessibility between car and transit (D).
| Data source | Acar | Atran | D |
| HODS17 | 0.88 | 0.72 | 0.09 |
| TRANUS | 0.99 | 0.69 | 0.18 |
With the HODS17, Shen´s indicator for driving a car goes from 0.32 to 1.07, while the range goes from 0.19 to 0.93 if using public transit. Using TRANUS the ranges are a little narrower, being from 0.73 to 1.15 for car drivers and from 0.34 to 0.94 for transit users. For any TAZ the accessibility score is achieved primarily because of its location, since changing the transportation mode will impact the accessibility score only marginally, on average 0.18 (Table 2. Disparity index for TRANUS).
In other words, accessibility for people living in the MCMA can be slightly greater if they drive a car, however their real potential for getting to job sites depends on their place of residence in direct correspondence to their closeness to employment centres. Evidently areas near the main employment corridors have high levels of accessibility, leaving people that live increasingly further away from the CA at a greater disadvantage. This is contrary to the case of car-oriented cities in the US where this same methodology demonstrated that car accessibility outweighs any locational advantage (Shen, 1998). However, the MCMA doesn´t match the condition shown in some south Asian cities where it was found that accessibility is actually much higher for transit users than for car users (Kwok and Yeh, 2004), even when in the MCMA there are also large population densities and high transit user rates. This reflects not only the inefficiency of the existing transit systems in the MCMA but more fundamentally, the deficit in geographical coverage of mass transit systems is apparent. The HODS17 reveals that in the central TAZ, where there are a number of subways stations, commute time by transit is shorter than by car, however it is possible that when we move away from the CA the accessibility throughout the rest of the metropolis is greater for car than for transit.
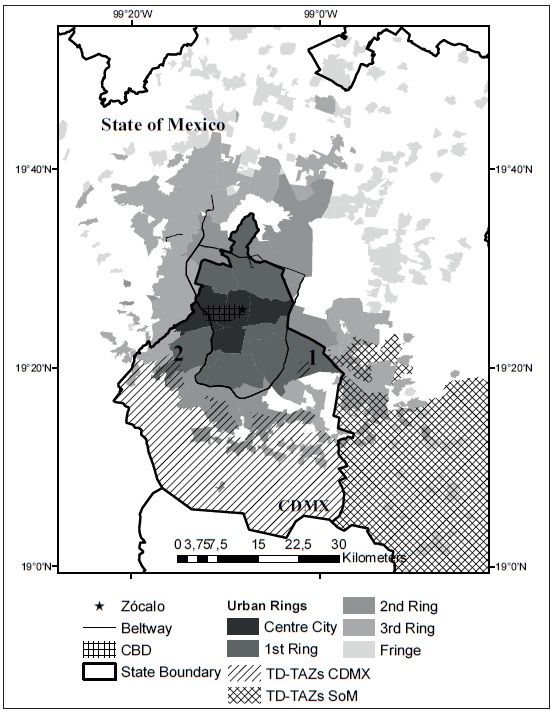
The disparity between TAZ shows that the most opportunity-rich area has a General Shen´s indicator (with HODS17) of 0.96 while the metropolitan average is 0.759, i.e. 26% higher. Therefore, the Shen´s indicator shows important nuances of locational accessibility. Given that the core of the metropolitan area lies within CDMX, when making a comparison on a regional scope, the State of Mexico shows lower levels of accessibility. Many TAZ located in the State of Mexico are on the metropolitan periphery; however, those located on the eastern limit between the State of Mexico and CDMX have relatively good levels of accessibility. In CDMX, the areas that suffer from low levels of accessibility lie in the east and the south, with a small portion in the northern areas. If we look for the ten TAZs with the worst accessibility index and highest marginalization in both the State of Mexico and CDMX, priority areas are found (Figure 6, Transport disadvantage TD-TAZs), and for these, different strategies should be analyzed in conjunction such as public transportation investment and/or land use policies to encourage economic development in job-poor areas. These results offer straightforward area-level implications to guide the metropolitan transportation policy for planning how to mitigate locational disadvantages.
CONCLUSIONS
Our exploration of accessibility using the GBM shows an important variation in the metropolitan pattern according to employment data, travel-time sources and transportation mode. As a general description, jobs-rich areas in the inner city have the highest accessibility with a decrease in accessibility with increasing distance from the urban center, however this negative relationship is not as clear as in the Shen´s type model. This is an expected result with GBM since this model focuses on the supply side of the jobs market, i.e. employment urban cores are predominant areas of accessibility. Total employment increases accessibility and gives more consistent results between travel-time sources than does formal employment, probably due to the reinforcement of the role of land use in the estimation. Accessibility is always higher for car drivers than for transit users with TRANUS, while for HODS17 this remains true for the most part but with a few exceptions.
The Shen´s indicator shows a more consistent spatial pattern of accessibility (spearman correlations close to 1) regardless of travel-time data and transportation mode with the HODS17, demonstrating the robustness of the method. In general, the spatial pattern of accessibility in relation to the urban center is a line with a clear negative slope. Again, as expected, the inclusion of informality increases accessibility. The Shen-type indicator allows us to see that car user accessibility is slightly higher than accessibility by transit, and the gap between the two using HODS17 data is less than that when using TRANUS data. This means that for any TAZ its accessibility score is achieved primarily because of its location. This disparity in terms of location means that accessibility in the TAZ with the highest accessibility record is 26% higher than the metropolitan accessibility average.
The policy implications of these results can be divided into three non-mutually exclusive approaches for improving accessibility: 1) developing affordable housing programs in job-rich areas, 2) intensifying investment in the subway system (While significant public-private investments have been made in the last few years to replace the informal bus-predominant transportation system with Rapid Transit Bus systems, although these systems have some merits they don´t replace the need for mass-transit systems such as subways), and/or 3) encouraging land use policies that attract and foster employment opportunities in locationdisadvantaged areas (low accessibility levels) and in sub-developed corridors in high density population areas. Cervero (1996) explained in his seminal work how a considerable job/worker imbalance between communities creates the conditions for congestion problems, given the need for long travel distances, and he therefore argued for planning for more diverse communities. Controversy arose over this because critics against land use planning argued in favor of market policies for congestion relief. However, in the context of the MCMA many of the assumptions for such market alternatives cannot be realized, principally because mobility costs are a significant limitation in accessibility given that the rate of car use for commuters is relatively low, 38.7% (INEGI, 2017). Furthermore, the freedom to relocate to residences near workplaces is limited to a very small segment of the population who can afford to do so. The job/housing ratio clearly has limitations as a suitable indicator to guide transportation policy, as some of its critics have pointed out (Giuliano, 1991). We think that the Shen´s indicator solves some of the important limitations of the job/housing ratio because distances, times, employment, residential geography and competition are explicitly integrated.
Decreasing distances to work for those workers who live in peripheral areas is also controversial. According to Guerra (2014), “households in lowdiversity, inaccessible neighborhoods are among the least likely to drive, but once they drive, they tend to drive a lot” (Ibid.: 13). Guerra states that policies encouraging suburban job accessibility, meaning reducing travel to work distances by increasing suburban job opportunities, would imply an increase of total Vehicle Kilometers Traveled (VKT) by encouraging a shift to cars from other modes, which would thereby further endanger the urban traffic system. Thus, such a land use policy would be at odds with the environmental aim of reducing emissions from transportation in a metropolis with renowned problems of air pollution and traffic congestion.
Grengs (2010) has made a detailed analysis of this tradeoff between cleaner air and providing opportunities for the poor. His argument aims to change the terms of the debate by asking whether it is fair to require that poor people endure enormous disadvantages in terms of accessibility on behalf of the middle-class and the rich, who benefit not only from car ownership and its mobility and accessibility but also would also benefit from improvements in air quality. In the case of the MCMA we can say that increasing local traffic at the expense of a decrease in regional mobility needs would certainly increase overall regional motor vehicular traffic but at the same would be a more equitable manner of distributing traffic costs.
Finally, it is important to point out two limitations that were encountered in this study that we suggest are worthy of further analysis. Of special importance is the precision of time matrices (transit and car), which should be properly calibrated and periodically assessed to allow for a longitudinal analysis of commute patterns in order to better identify transport-disadvantaged areas. We also noted that there are some remarkably contrasting differences in accessibility between contiguous TAZ. Some of these differences are well explained by the discontinuity of the local transportation infrastructure, which suggests that they would be priority areas for public investment; however, it is suggested that further studies should aim to recalibrate time matrices to increase the validity of the data. It is further suggested that the metropolitan transportation agency (COMETRAVI) collect and maintain reliable information about all relevant aspects of transportation systems.
The other limitation we encountered in this study and suggest be taken up in further studies is the reliability of the formal employment data, because the source that is presently available is no more than a rough estimation. This is suitable for representing the employment geography, but for an understanding of the specifics of employment it is limited. For example, for large economic units the estimation of jobs is based in the lower limit of the range recorded (i.e. over 250 workers or more), thus it is impossible to know the exact number of jobs in those units.
Another aspect that we suggest should be considered further is the possibility of analyzing accessibility in specific economic sectors, such as low-wage workers; unfortunately, no official data by job sector is currently available for the MCMA at the TAZ level. Having this information would be essential for an in-depth analysis of transportation disadvantages, and these should be properly understood as being the predominant objectives of the transportation policies in the MCMA in order to promote equity in job accessibility.

