


 text new page (beta)
 English (pdf)
 Article in xml format
 Article references
 Send this article by e-mail
 Cited by SciELO
  Similars in
SciELO
Similars in
SciELO 
 Permalink
INTRODUCTION
The interaction of natural and man-made hazards with high vulnerability levels of the populations exposed to these hazards frequently lead to disaster. Risk assessment (hazard, vulnerability, exposure) is essential for proper land-use planning and determining the areas where mitigation and prevention plans are needed. Risk reduction is considered as the key driver of disaster risk management because, regardless of whether it is implemented prospectively or correctively, its ultimate aim is to prevent or reduce the impact of disasters (IIRSA / COSIPLAN, 2014).
Risk maps are the first element for risk reduction, as these allow visualizing the spatial distribution of risk and identifying areas where strategic decisions are required for mitigating or reducing the impact of disasters. They are also useful for emergency and disaster response plans. However, in most cases only hazard maps are generated for most communities. In Mexico, few studies regarding vulnerability have been carried out (Cortés-Gutierrez, 2014). Vulnerability is commonly estimated using social information obtained from local censuses. The disadvantage of this evaluation approach is that the information is updated every 5 or 10 years and some indicators for the assessment of vulnerability are not considered.
In the present work, we used the methodology developed by Flax et al. (2002) and applied it as in Novelo-Casanova and Suarez (2010; 2011). This methodology has proved to be useful for the development of vulnerability and risk maps identifying low- and high-risk areas within a given territory.
Hazards in Valle de Chalco Solidaridad
Valle de Chalco Solidaridad (VCS) is a municipality in the State of Mexico, Mexico, located on the eastern outskirts of the Mexico City metropolitan area in the lower basin of the Valley of Mexico (old Chalco Lake) at 2,250 m above sea level (Figure 1). The most common local hazards in this region are subsidence and flooding (Atlas del Riesgos del Valle de Chalco Solidaridad; ARVCS, 2011). Volcanoes, including the Popocatepetl and Iztaccihuatl stratovolcanoes, also demarcate the VCS basin.
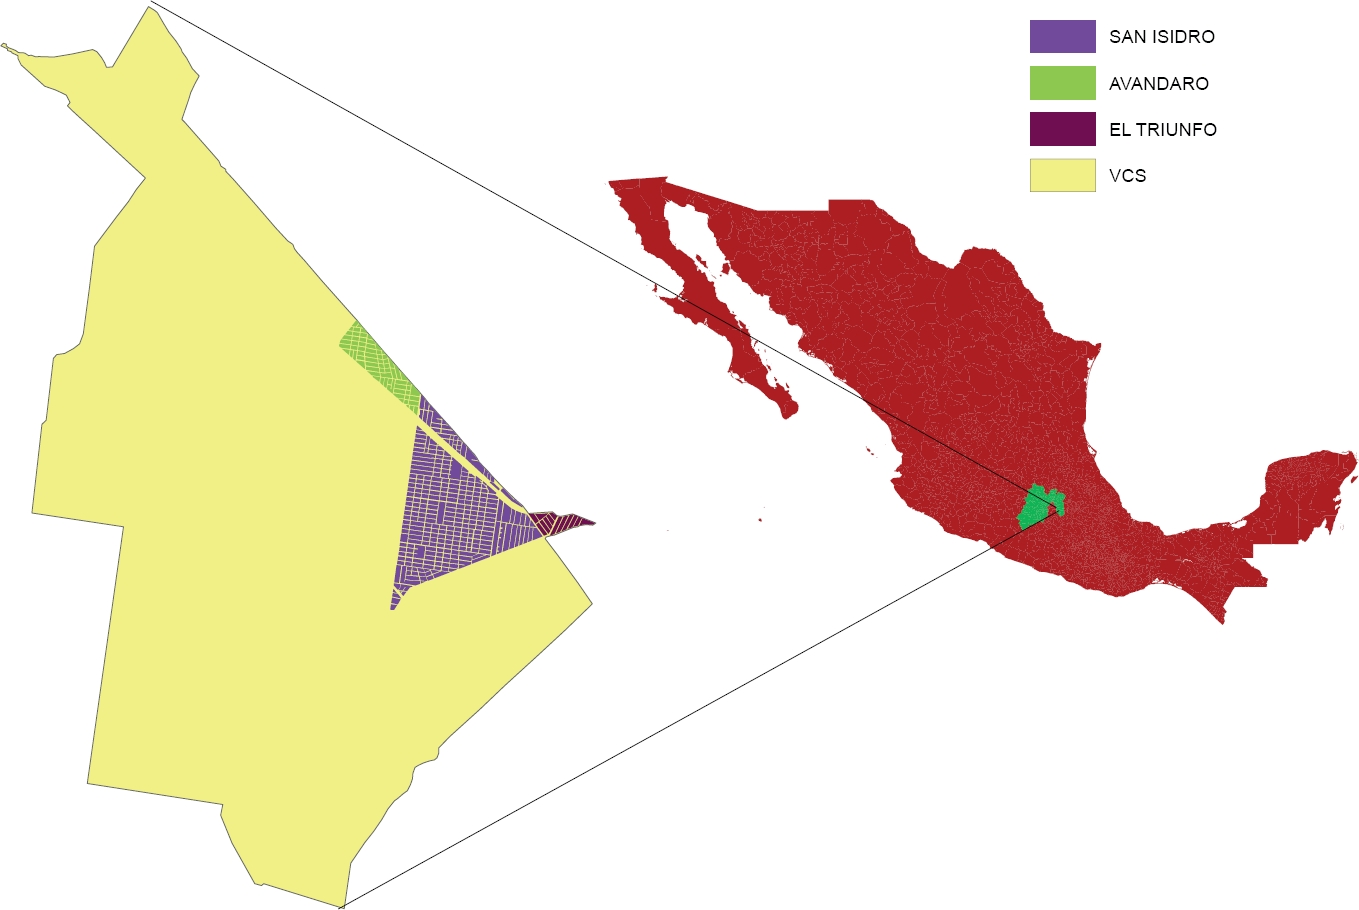
Figure 1 Urban trace of study areas in the municipality of Valle de Chalco Solidaridad, State of Mexico, Mexico (modified from Cabildo Municipal de Valle de Chalco Solidaridad, 2005).
During the rainy season, water requires being pumped from local pluvial lagoons to avoid floods; nevertheless, runoff water from highlands frequently overflows the canalized rivers “La Compañía” and “Acapol” (Cabildo Municipal de Valle de Chalco Solidaridad 2005). In this work we focused our analysis on the impact of flooding of La Compañía Canal (LCC) because the Acapol River is located outside of our study area. La Compañía River (LCR) originates in the foothills of the Iztaccihuatl volcano and flows down towards the northeast, draining into the Canal General in the former lake of Texcoco. LCR is 30 km long and includes the tributaries San Rafael, Santo Domingo and San Francisco rivers. It runs through the plains of the former Chalco Lake, the Mexico-Puebla highway and the federal road. LCC was previously an open sewage canal that collects domestic wastewater from two municipalities in the State of Mexico: Valle de Chalco Slolidaridad (Chalco Valley-Solidarity), and Chalco. Today, LCC is a piped sewage canal.
In the municipality of VCS, average terrain slope is minimal (0.04°) and soil is silty loam, clayey loam, and sandy loam in most of its territory. These soil types are highly compressible, and clays tend to absorb large amounts of water, which can increase its original volume as much as 2-fold. This volume is reduced to a quarter of its original size when water evaporates completely, producing cracks in the ground and damaging nearby buildings (Thieken et al., 2005).
The natural environment in VCS has been modified dramatically over the past 20 years because of the overexploitation of local aquifers that has resulted in subsidence. In the center of the plain, subsidence reaches about 40 cm/year in areas where the thickness of lacustrine sediments is about 300 m (Ortiz-Zamora and Ortega-Guerrero 2010). This compaction and failure of soil’s layers has led to waterlogging, causing serious structural damage to LCC by reducing the lateral pressure on canal walls (Diaz-Delgado et al. 2010). On the other hand, about 90% of urbanized land in the municipality is exposed to seismic hazards.
Impact of Flooding Events
On June 1, 2000, 80 hectares of Chalco Valley territory were flooded with wastewater. Floods were caused by the rupture and discharge of LCC. The inhabitants of more than 6,700 households were affected with gastrointestinal, skin, and water-borne diseases; in addition, power, piped water and food supplies were temporarily unavailable (Aragón-Durand 2009). Three VCS districts were seriously damaged by cracks in LCC walls in 2010: El Triunfo, San Isidro y Avándaro. According to the “Atlas de Inundaciones del Estado de México” (Flood Atlas of the State of Mexico; AIEM 2010), floods affected an urban area of about 447,592 m2 with a population of 11,250 inhabitants. This flooding event occurred on 3, 4 and 5 February 2010. The estimated economic impact was 2.7 to 3.0 million USD (Díaz-Delgado et al. 2010).
Global Vulnerability and Risk
In this research we considered global vulnerability as the weighted sum of structural, social, and economical vulnerabilities (Novelo-Casanova and Rodriguez-Vangort 2015). In other words, in this work, global vulnerability consists of the integrated analysis of these three types of vulnerabilities.
Risk is considered as the estimated impact that a hazard event would have on people, services, facilities, structures, and assets in a community. It is defined by the following equation (Crichton, 1999):
In this work we analyzed risk and vulnerability in areas that have been exposed to recurrent flooding between 2000 and 2010 due to fractured LCC walls (AIEM 2010). In addition, we conducted a quantitative assessment of global vulnerability in VCS through an integrated analysis of the structural, social, and economic vulnerabilities associated with earthquakes and subsidence.
METHODOLOGY
Hazard and Vulnerability Assessment
We applied the methodology developed by Flax et al. (2002) and applied it as in Novelo-Casanova and Suarez (2010; 2011), including the following steps:
Hazard Identification
Hazard Analysis
Critical Facility Analysis
Societal Analysis
Economic Analysis
Environmental Analysis
Mitigation Opportunity Analysis
For the purposes of our study, we only considered steps 1, 2, 4, and 5, which in this work correspond to steps 1, 2, 3 and 4, respectively. In addition, we estimated the structural vulnerability of households in VCS as step 5. Step 6 consisted of global vulnerability and risk measurements. To note, the methodology was adapted according to our particular research conditions, as explained below:
Step 1. Same as in Novelo and Suarez (2010). The aim is to identify local hazards and their potential impacts.
Step 2. Same as in Novelo and Suarez (2010). Exposure areas are determined for each hazard identified.
Step 3. Social aspects that lead to increased vulnerability are identified, including:
Household overcrowding
Household with illiterate relative(s)
Household with no social security coverage
Handicapped relative(s)
Education level
Neighborhood organization
Availability of evacuation roads
Family members over 65 and below 10 years old
Step 4. The economic vulnerability of each surveyed household is estimated considering the following indicators:
Availability of health services
House leasing/ownership
Number of floors in the house
Number of light bulbs in the house
Family bank savings
Access to public services (water supply, drainage, electricity, etc.)
Number of family members with employment
Number of vehicles in the family
Business ownership (if applicable)
Business insurance (if applicable)
Availability of business’ bank credit (if applicable)
Step 5. Structural vulnerability due to earthquakes, flooding and subsidence was estimated by analyzing the following housing indicators:
Structural design
Construction material of walls
Construction material of roofs
Current extent of structural damage (if any)
Structural conditions of columns, foundations, etc.
Other factors: actual subsidence, separation between adjacent houses, structurally hazardous neighboring buildings.
Step 6. Global vulnerability (GV) for each household (i) was estimated as an average of the three vulnerabilities analyzed:
Where SV: Social Vulnerability, EV: Economic Vulnerability, and StV: Structural Vulnerability. GV was estimated assuming that the three vulnerabilities analyzed have the same importance (same weight) and impact on the VCS community.
Global Vulnerability Levels
As in Novelo-Casanova and Rodriguez-Vangort (2015), five global vulnerability levels were considered using the Weighted Inverse Distance (IDW) method in a Geographical Information System (GIS):
Very low: unlikely damage.
Low: exposed to minor damage.
Moderate: exposed to relatively minor damage.
High: exposed to significant damage.
Very high: exposed to severe damage.
We obtained the spatial distribution of risk by superposing individual GIS flooding, earthquake, and subsidence hazard maps on the global vulnerability map.
Field Work
Considering the methodology proposed by Novelo-Casanova and Rodriguez-Vangort (2015), during our field work in VCS, 361 families were randomly surveyed considering a statistically significant sample from a total of 6,058 households located in VCS at the time of our field work. Interviews were structured using a questionnaire designed to obtain the structural, economic and social indicators described in the methodology section.
Data Sources
The data for this study were obtained from field surveys in VCS in March-April 2010, as well as from the following scientific and government sources:
Instituto Nacional de Estadística y Geografía (National Institute of Statistic and Geography)
Gobierno Municipal of Valle de Chalco Solidaridad (Municipal Government of Valle de Chalco Solidaridad)
Secretaría de Desarrollo Social (Secretariat of Social Development of Mexico)
Desinventar Data Base (http://www.desinventar.org/es/database)
Atlas de Riesgos de Valle de Chalco Solidaridad [Risk Atlas of Valle de Chalco Solidaridad] (2011)
It should be stressed that both AIEM (2010) and ARVCS (2011) are policy instruments aimed at describing the areas that are regularly flooded and “at risk” heavy rainfall and the local hazards identified, respectively. Both Atlases consist mainly of a series of topographic maps of urban and rural settlements where hazard areas are identified based on information from previous years. The vulnerability of inhabitants is reduced to numbers of affected persons, and vulnerable individuals are not described in terms of socio-economic processes (Aragón-Durand 2009).
The methodology developed here is a relatively new approach for the evaluation of the spatial distribution of risk. Novelo-Casanova and Suarez (2010) and Novelo-Casanova and Suarez (2011) used this methodology to determine risk related to natural and man-made hazards in the Caiman Islands. Also, Novelo-Casanova and Rodríguez-Vangort (2015) applied this method to assess flood risk in Motozintla de Mendoza, Chiapas, Mexico. However, as in other methodologies (Oliver-Smith et al., 2016; Magaña-Rueda, 2013), it is important to supplement this analysis with more complex studies to assess those processes that add to the social conditions of risk and the actions aimed at disaster reduction and prevention. Although our methodology has its intrinsic limitations, it does provide elements for decision makers to implement risk-reduction actions in areas identified as high-risk.
RESULTS AND DISCUSSION
Hazard Identification
Using the desinventar database (http://www.desinventar.org/es/), we identified ten different hazards in our study area (Table 1). To supplement our hazard analysis, we also consulted ARVCS (2011), which is mainly focused on the description of the different hazards VCS is exposed to.
Table 1 Relative Ranking Matrix of Hazards at VCS.
| Hazard | Frequency | Area of Impact | Magnitude | Total* |
|---|---|---|---|---|
| Earthquakes | 1 | 5 | 4 | 24 |
| Floods | 5 | 3 | 3 | 24 |
| Subsidence | 3 | 5 | 2 | 16 |
| Mass Removal Process | 3 | 1 | 2 | 6 |
| Droughts | 1 | 5 | 1 | 6 |
| Volcanic Eruptions | 1 | 5 | 1 | 6 |
| Frost | 1 | 4 | 1 | 5 |
| Winds | 1 | 4 | 1 | 5 |
| Explosions | 4 | 1 | 1 | 5 |
| Fire | 1 | 1 | 2 | 4 |
* (Frequency + area of impact) x magnitude of potential damage
As in Novelo-Casanova and Rodriguez-Vangort (2015), the frequency, area of impact, and magnitude values of the potential damage area were defined according to five levels:
Following the methodology described above, the hazards classified as Very High in VCS are earthquakes, floods, and subsidence (Table 1). From historical records and data collected during field work, we found that the most recurrent hazard in the study area are floods. mainly due to ruptured LCC walls. Also, given its geographic location, this region is highly prone to the impact of large earthquakes. Furthermore, subsidence (40 cm/year) has been reported in some areas of CVS due to groundwater extraction, causing structural damages to local buildings (ARVCS 2011).
Hazard Analysis
Based on ARVCS (2011), we identified the analyzed hazard’s level of exposure areas considering the following relative scoring system (Table 2):
Table 2 Risk Exposure Areas at VCS.
| Risk Zone | Score | Description |
|---|---|---|
| F-Zone 1 | 5 | Frequently flooded: high expected damage |
| F-Zone 2 | 2 | Moderate frequency of flooding and expected damage |
| F-Zone 3 | 3 | Low frequency of flooding and low expected damage |
| F-Zone 4 | 4 | Rarely flooded and damage only in extreme situations |
| F-Zone 5 | 1 | No reports of flooding |
| E-Zone 1 | 5 | Area located in lake sediments with very high seismic wave amplification |
| E-Zone 2 | 3 | Area located in the transition zone of lake sediments with moderate seismic wave amplification |
| S-Zone 1 | 3 | Subsidence is common throughout the area due to excessive underground water extraction |
| S-Zone 2 | 2 | Moderate subsidence levels |
The spatial distribution of these hazard areas is shown in Figure 2.
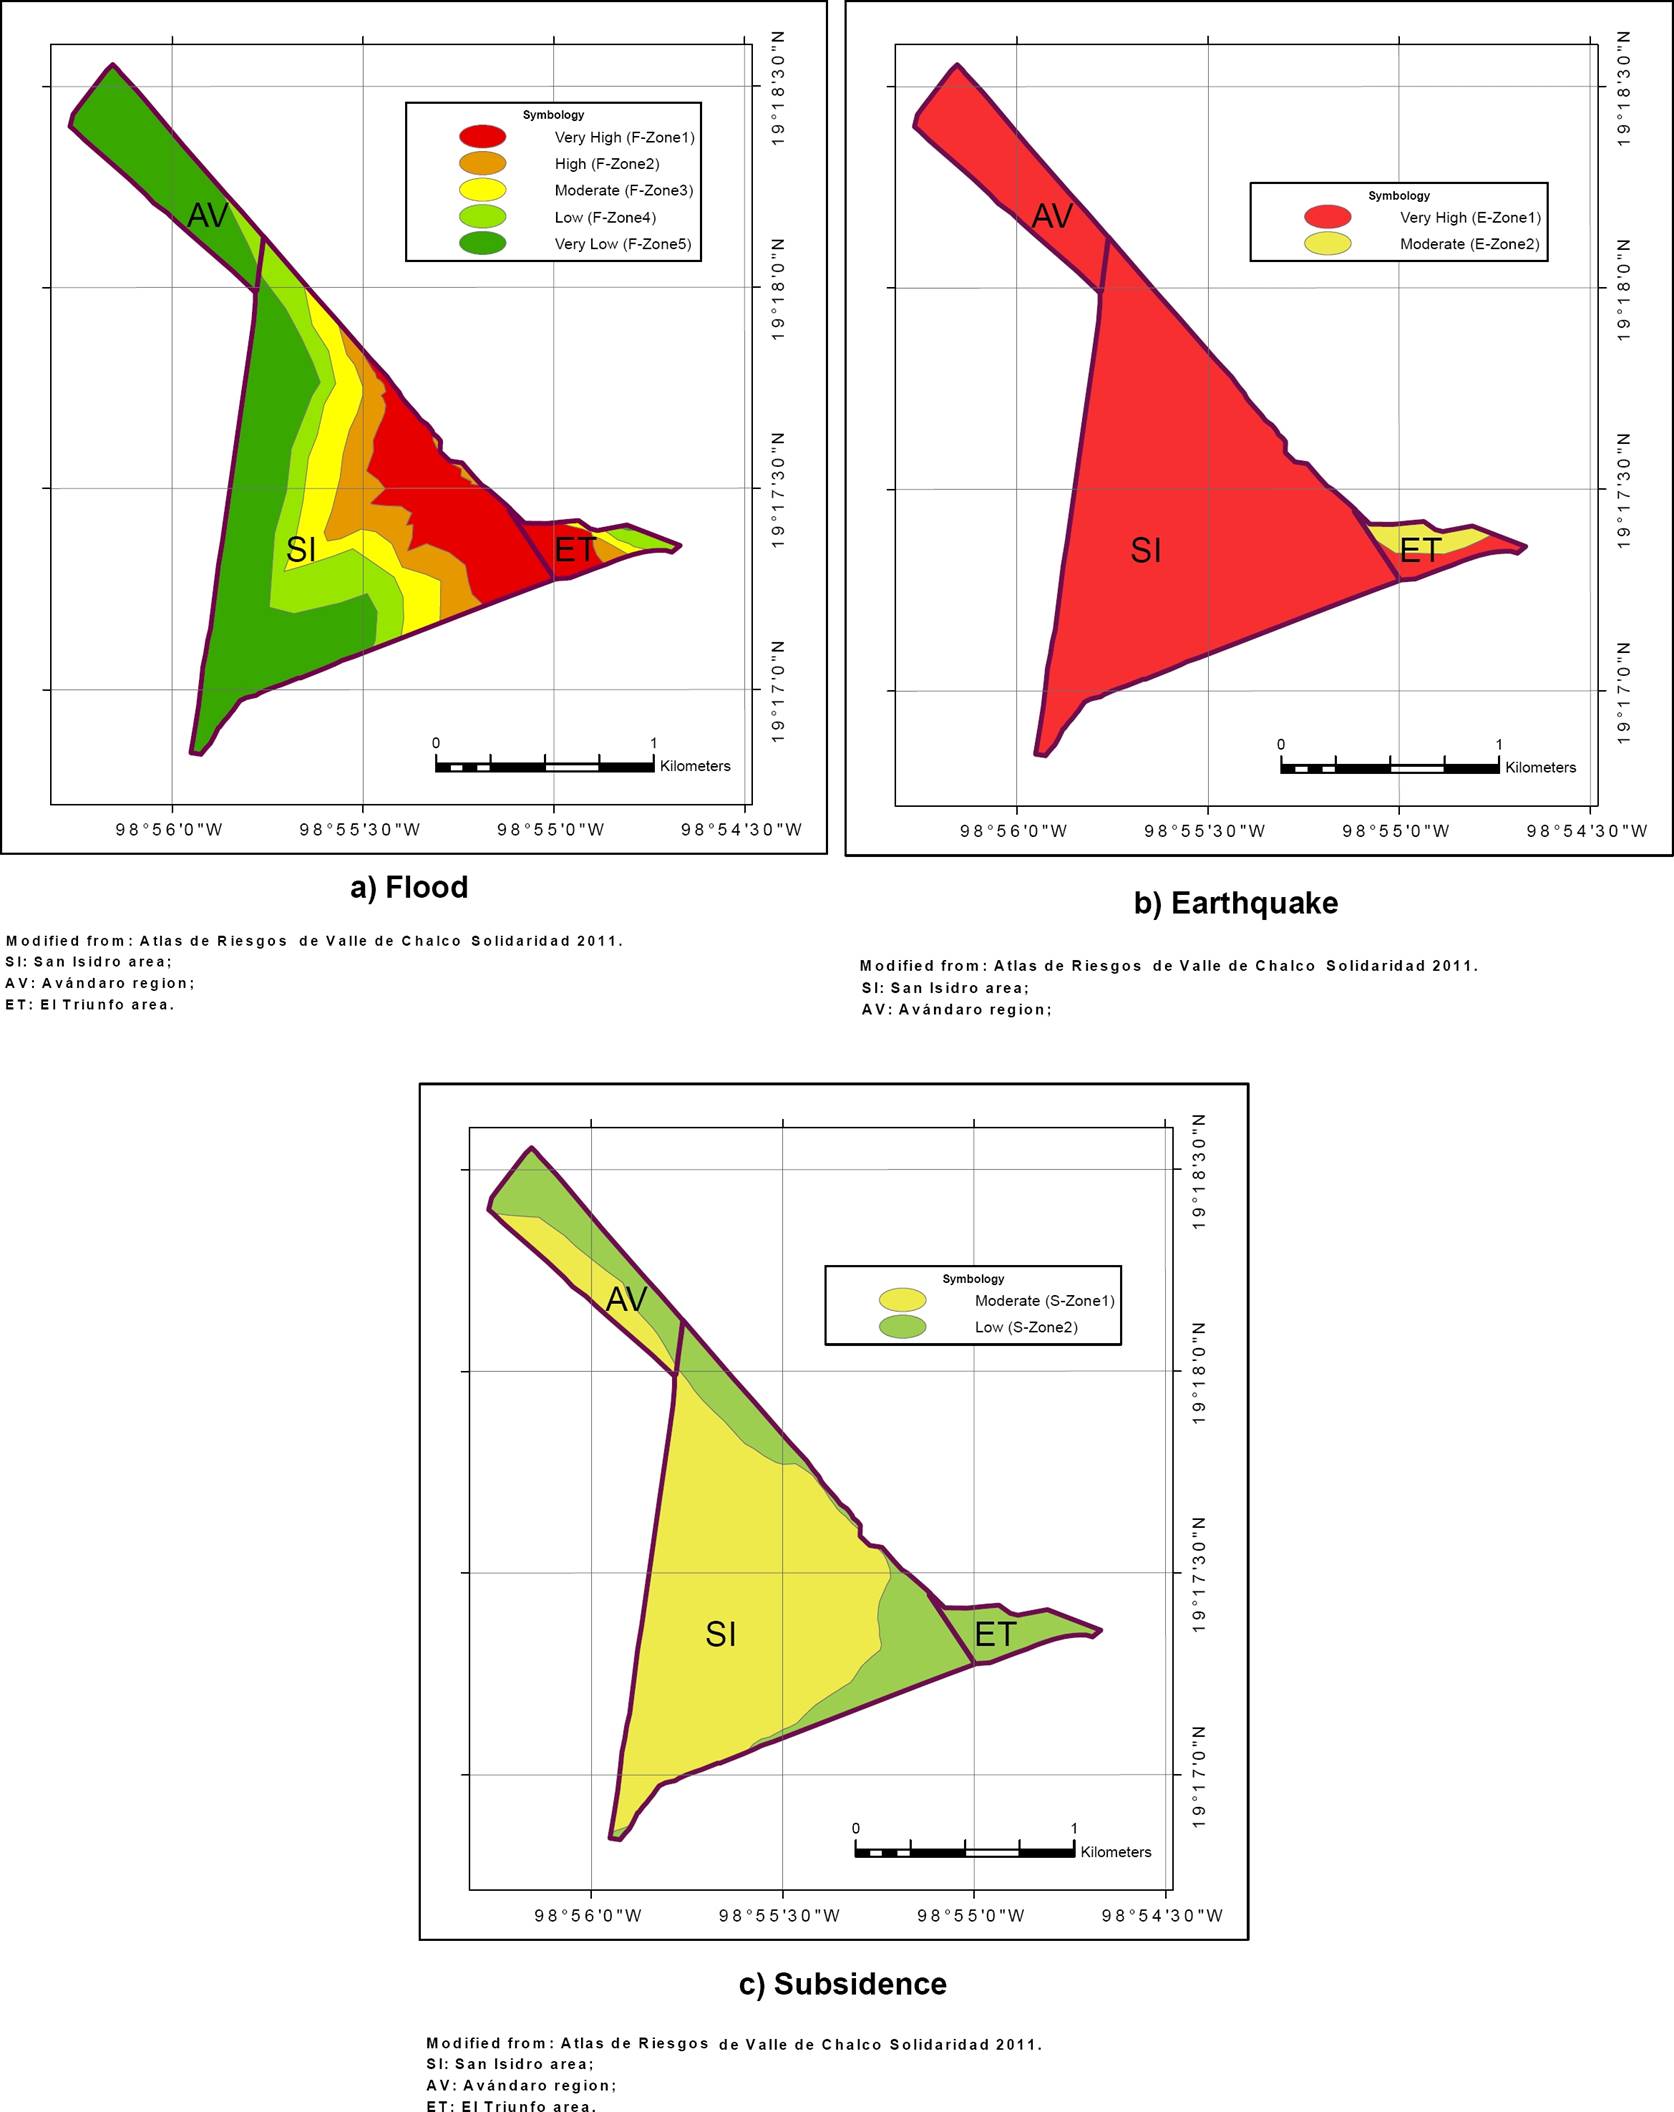
Figure 2 Zones of hazard exposure: a) Flood; b) Earthquake; and c) Subsidence. (Modified from the Atlas de Riesgos de Valle de Chalco Solidaridad 2011). SI: San Isidro area; AV: Avándaro region; ET: El Triunfo area.
Societal Analysis
Social vulnerability analysis identifies areas of potential social needs. In general, social vulnerability in the study area is moderate to high, with small very-high vulnerability areas of (Figure 3a). These high-vulnerability areas are distributed as isolated patches in the central region of VCS. No regions with low and very low social vulnerabilities were identified. To note, the areas that were highly impacted during the 2000, 2005 and 2010 floods were also identified as showing with a high social vulnerability level (Figure 3a). During these flood events, low-income families unable to cope with the disaster were those most severely affected.
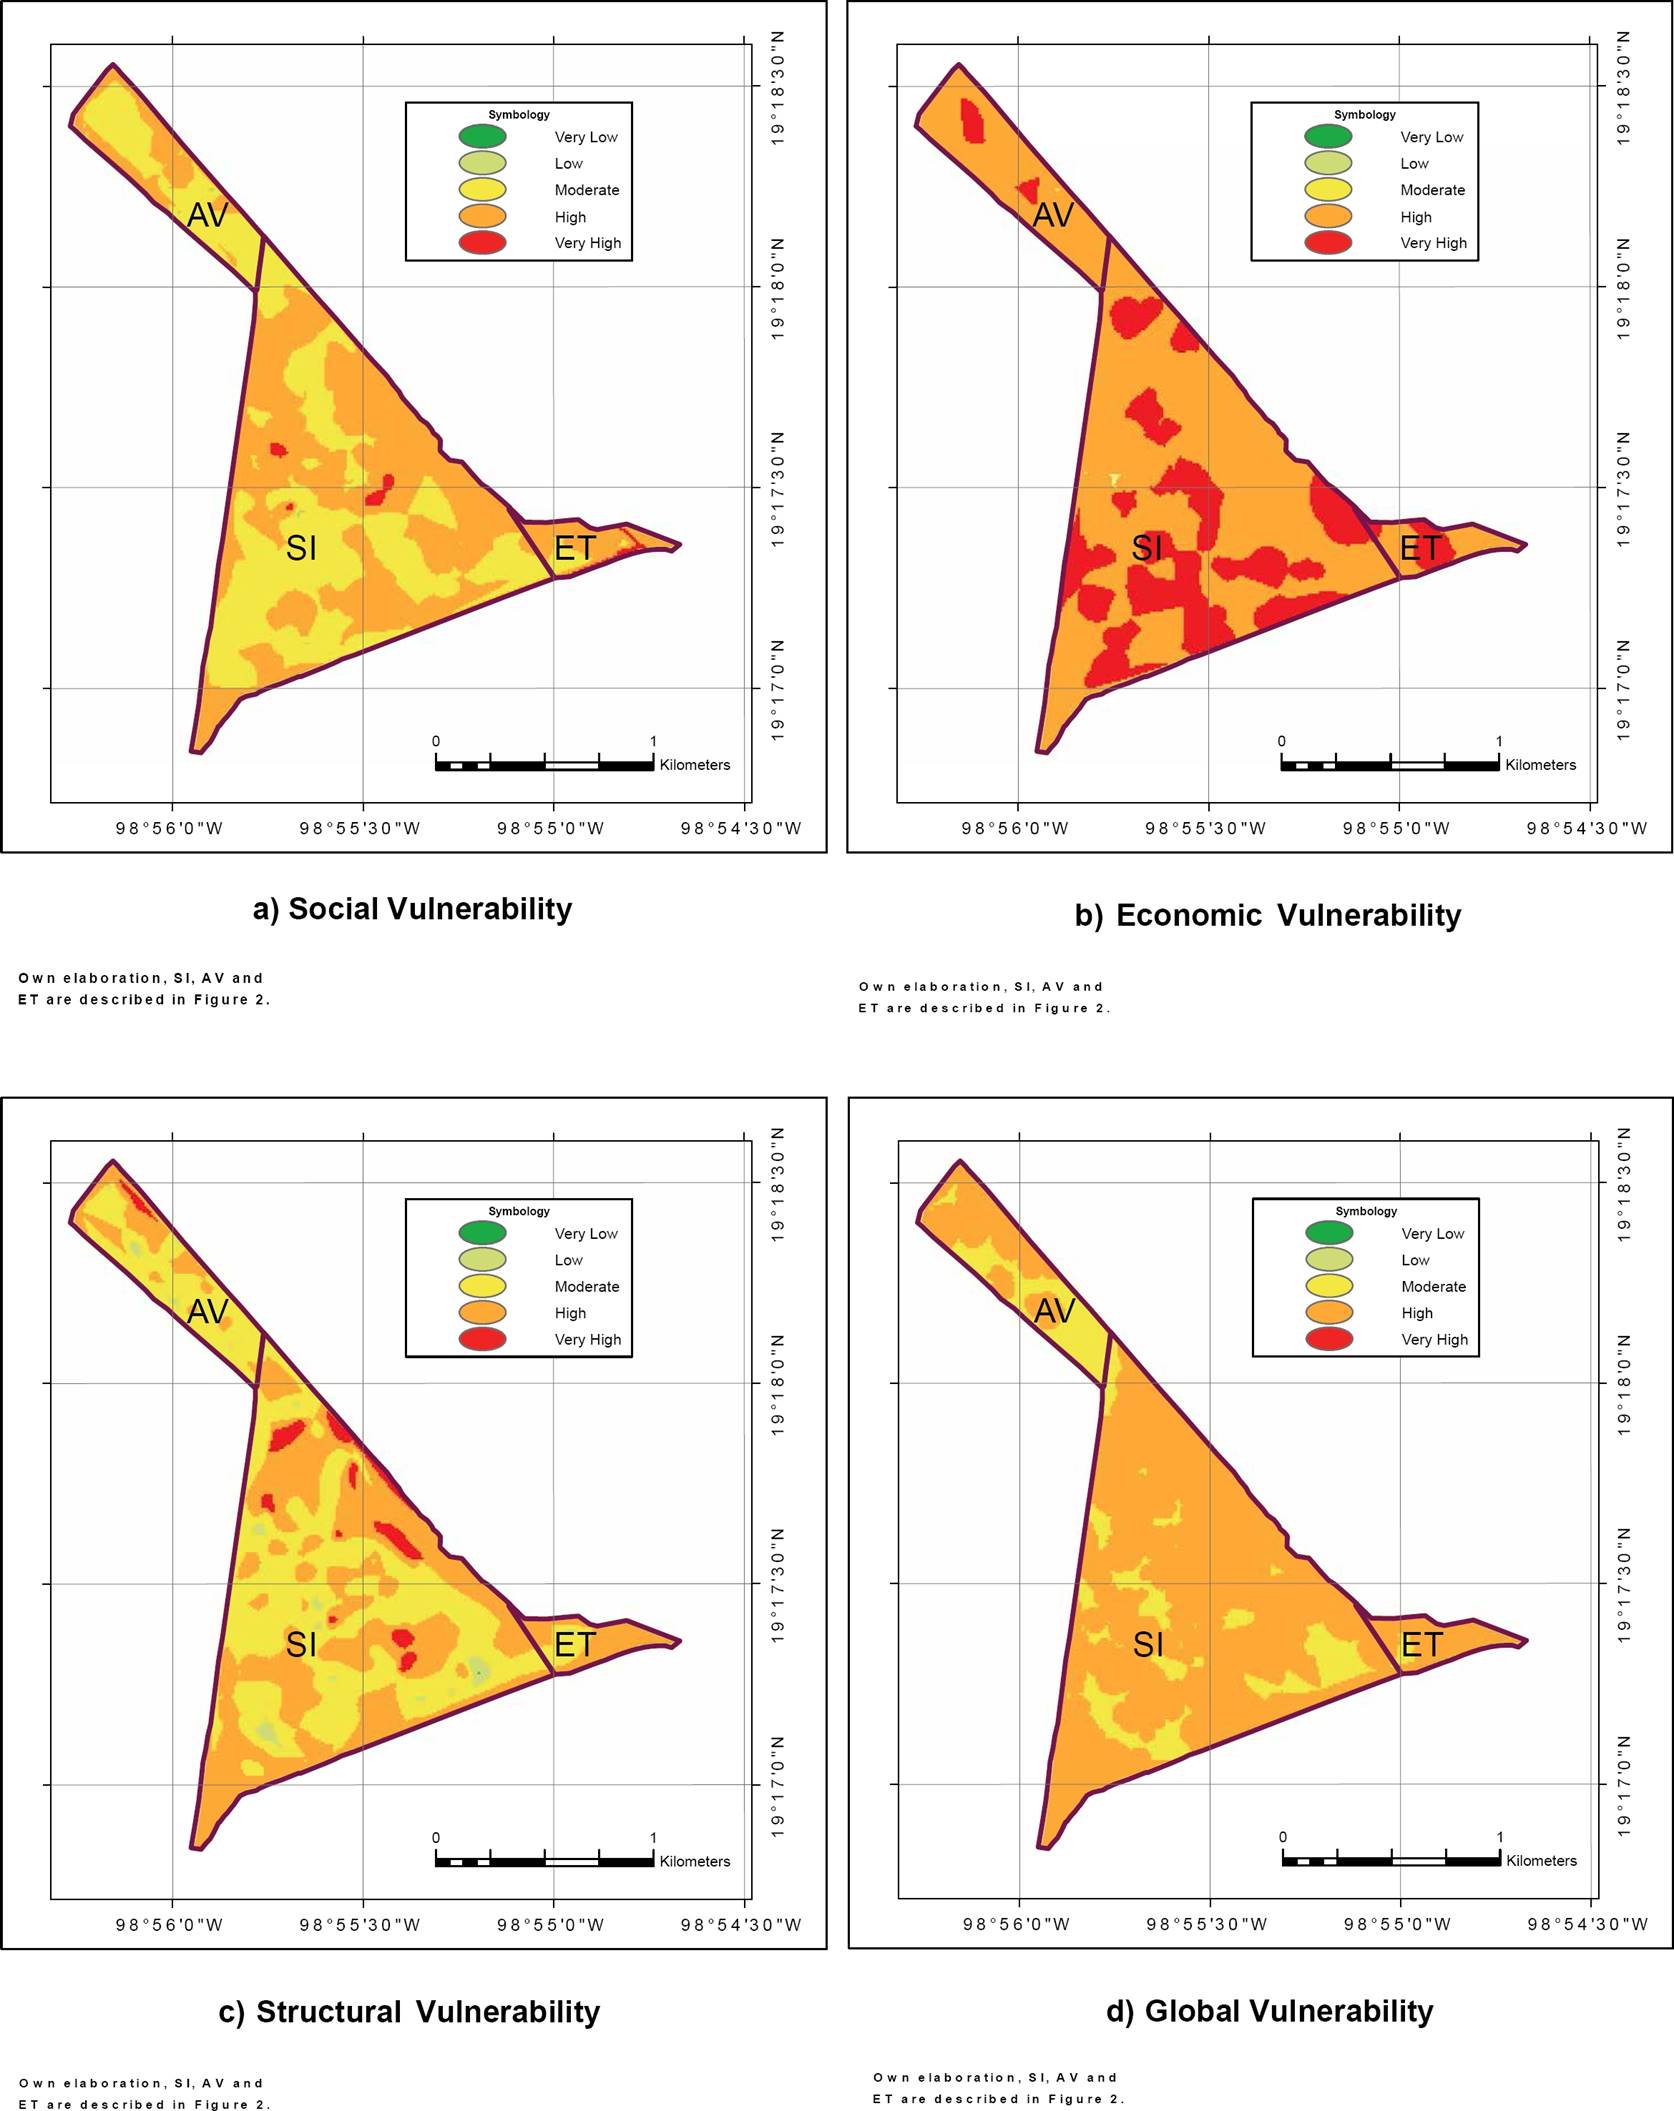
Figure 3 Spatial distribution of vulnerability at VCS. a) Social; b) Economic; c) Structural; and d) Global. SI, AV and ET are described in Figure 2.
Aragón-Durand (2009) pointed out that the propensity of the Chalco Valley to flooding is the result of a social-historical-environmental process that unfolded in the urban interface of southeastern Mexico City involving specific social stakeholders and modernization projects. Novelo-Casanova and Suarez (2010) consider natural hazards as natural events capable of disrupting the physical and social space where they occur, not only at the time of occurrence but also longterm, due to their associated consequences.Accordingly, the social impact of the last three major floods (2000, 2005, 2010) may be greater than the economical impact previously reported (Díaz-Delgado et al. 2010).
Economic Analysis
The spatial distribution of economic vulnerability demonstrates that a large portion of the territory has a very high vulnerability level. In fact, practically all the VCS territory has high and very-high economic vulnerability (Figure 3b). However, low-income zones are not concentrated in a specific region. In VCS, it is common to find high-income households surrounded by low-income families. Employment in VCS is very low, and most persons work in either nearby municipalities or Mexico City. Most businesses in VCS are grocery stores, pharmacies, mechanical and electrical services, as well as food markets. Besides, at least four flea markets operate throughout the week. These small businesses and the variety of services provided by them are the only ones supporting an active local economy in the area.
To complete our economic vulnerability analysis, we assumed a scenario of serious damage to the Mexico-Puebla highway due to an earthquake, and we analyzed how this scenario may affect financially to the local inhabitants of CVS. It was found that most local workers would be severely impacted, as they would be unable to get to work should the highway be damaged. It should be stressed that about 38% of the economically active population works within the municipality, while 62% do so in areas outside CVS. Persons that run their own business could be either directly affected by a disaster or indirectly if supplies are not available because of damage to the main highway. On the other hand, it is worth noting that none of the respondents that reported having their own businessare covered by any kind of business insurance. This fact further increases the likelihood of high and very-high economic damage from an extreme natural event. On the other hand, Aragón-Durand (2009) reported that during the 2005 floods in Chalco, a segment of the Mexico-Puebla highway between kilometers 26 and 28 was waterlogged and many passenger buses, trucks, and automobiles became stranded. Transportation of goods and services from Mexico City was interrupted. The report by Aragón-Durand (2009) supports our analysis.
Structural Analysis
Most households in the study area show moderate and high structural vulnerability levels, although some zones with very high vulnerability were identified in the San Isidro and Avandaro districts (Figure 3c). In El Triunfo, most households fall into the moderate and high vulnerability levels. The high and very high structural vulnerability levels measured in VCS derive from the fact that 80% of the local houses are in precarious conditions, increasing their fragility and making them highly vulnerable to damage by slow-raising floods, earthquakes, and subsidence.
Our results indicate that structural vulnerability represents one of the major factors that increase risk in VCS. Thus, in the case of future floods and earthquakes, the probability of full or partial damage to households in VCS is either “high” or “very-high”, as most houses and structures are in poor structural conditions or are old buildings, which increases their vulnerability. Also, subsidence might have a high economic impact.
Global Vulnerability
Most households in VCS show a high global vulnerability (Figure 3d). However, small areas in San Isidro and Avandaro show a moderate global vulnerability level. In contrast, virtually the whole El Triunfo territory shows a high global vulnerability level. These findings indicate that this community is highly vulnerable.
According to Aragón-Durand (2009), the driving forces of vulnerability in the Chalco Valley are:
“The physical environment: Unsafe housing and location in risk-prone areas, and erosion or damage of house materials. As example, the impact of the 2000 floods caused houses and other assets to be lost or damaged in varying degrees ranging from contamination of rooms with wastewaters and inundation with mud to complete erosion of house walls, floors, and roofs, which rendered these unsuitable for living.”
Fragile economy: The local economy that depends on capital, assets, and savings, can be easily lost or damaged during disasters. During floods, most persons working outside the study area may lose their job or income due to the impossibility to travel to their workplace. Also, during floods, the affected residents are unable to remain at their houses, and are forced to incur unanticipated expenses for temporary room leasing elsewhere.
Policy responses: Unequal distribution of emergency aid and goods according to damage; increase of insecurity, decrease of social protection mechanisms and inadequate warning.
All these vulnerability characteristics pointed out by Aragón-Durand (2009) were also identified in this work. In a report of the United Nations Economic Commission for Latin America and the Caribbean (2004), vulnerability is defined as “a set of conditions and processes resulting from physical, social, economical, and environmental factors that increases the susceptibility of a community to the impact of hazards”. Under this definition, we estimated global vulnerability considering three of these vulnerability factors (physical, social, economic) that a society susceptible to impact by a potential hazard.
Risk Assessment
Using equation (1), we estimated the spatial distribution of flood, seismic, and subsidence risk by superposing the maps on global vulnerability and individual hazards (Figure 4). As in the case of vulnerability, risk was estimated using a 1-to-5 scale with the same relative scoring system.

Figure 4 Spatial distribution of risk in VCS. a) Flood Risk, b) Seismic Risk and c) Subsidence Risk. SI, AV and ET are described in Figure 2.
Table 3 shows that most households in VCS have very low and low flood-risk levels, as most houses are located on unexposed areas. However, about 28% of the ocal households are located in areas of high and very high flood risk (Figure 4a). In the case of seismic and subsidence risks, most population in VCS shows moderate and high risk levels.
Table 3 Percentage of Houses at Risk in VCS.
| Risk Level | Flood (%) |
Seismic (%) |
Subsidence (%) |
| Very Low | 35 | 0 | 0 |
| Low | 23 | 1 | 16 |
| Moderate | 14 | 67 | 59 |
| High | 13 | 32 | 25 |
| Very High | 15 | 0 | 0 |
In slowly-rising floods, the maximum water level during the flood event accounts for the resulting damage (Thieken et al., 2005). Major damages in VCS are caused by moisture content and the type of building structure in the cellar and ground floors. Flood damage depends, in addition to the construction type and water depth, on other factors like flood duration, sediment concentration, and quality of external response during the flood event (Smith 1994; Penning-Rowsell, 2015).
Land subsidence in the Chalco Valley is caused by the consolidation of the upper aquitards, which consist mainly of saturated silt-clayey sediments interbedded with sandy lenses of volcanic ash (Ortega, 1996). During the past two decades, groundwater extraction from aquifers in Chalco has been an economically important source of water supply for Mexico City. According to Ortiz and Ortega (2007), 12 m3/s of underground water are extracted, whereas only 8 m3/s are naturally recharged. The plain is sinking at 40 cm per year and undergoing a racking process. Besides, the sinking process is permanently altering the local topography (Bitrán-Bitrán et al., 2001).
Moderate to high damage due to earthquakes is expected in VCS, mainly because about 60% of the local houses are built with low-cost materials (adobe). In addition, the socio-economic vulnerability of the community is high and very high (Figure 3b). An additional factor is that the majority of adobe constructions in VCS have poor structural configuration, making them more vulnerable to earthquakes. The collapse of adobe households due to earthquakes has resulted in considerable loss of life in many third-world countries. The high seismic vulnerability of earthen constructions derives from the combined effect of the mechanical properties of dry earth: 1) earthen structures are massive and thus attract large inertial force; 2) these structures are weak and cannot withstand these forces; and 3) these structures are brittle and break without warning (Blondet et al., 2006).
The primary objective of risk management is to reduce to an acceptable risk level all types of hazards (natural and man-made) a community is exposed to. This also implies the use of all available resources to reduce this risk (human, technology, etc.). The three risk management phases are: 1) risk assessment and analysis; 2) mitigation and prevention actions based on the knowledge of risk levels and their spatial distribution; 3) Long-term plans to reduce the social construction of risk (public policies, land-use planning, environmental restoration, etc.).In this study, we assessed the risk level and spatial distribution of subsidence, floods and earthquakes in VCS. Our results are part of the first risk management phase. However, our results also provide key elements for local authorities and the inhabitants of VCS to develop actions regarding phases 2 and 3.
Our results identified zones where mitigation measures are needed, and this knowledge is a first element for local decision-makers to implement mitigation programs in the study area. Among these actions, we recommend the development of a program to reduce the structural vulnerability of houses located in high-risk areas. Also, due to the current differential sinking of soil in Valle de Chalco and the permanent damage to local houses, we suggest local authorities to regulate housing construction in these areas. Although La Compañía River is channeled , the flood risk level is still high.
Subsidence and earthquake risks should also be considered in urban development planning in Valle de Chalco. Although during the earthquake of 19 September 2017 minor damages were reported in the study area, about 100 houses within the municipality were affected (Fernández, 2017).
The social analysis of vulnerability demonstrated that the social vulnerability levels range from moderate to high. During field work, a low social integration of the local community was observed. Most local inhabitants do not interact with their neighbours. Therefore, we also believe that education social programs addressing risk prevention and mitigation should be developed.
CONCLUSIONS
Social vulnerability is a direct consequence of impoverishment, population growth, and rapid urbanization with no planning. These conditions occur at the study site. A clear example are the houses located less than 30 meters from “La Compañía” canal, which are in poor conditions and highly exposed in case of leakage or cracks in canal walls .
Our analysis indicates that most families living in VCS show a high global vulnerability level. Only small zones with moderate global vulnerability were identified. However, areas with moderate vulnerability are susceptible to suffer damage once a hazard occurs, because most local families show high and very high economic vulnerability levels. High and very high flood risk is limited to families living adjacent to flood-prone areas. The majority of the population shows moderate and high subsidence and seismic risks. The key drivers that increase vulnerability in Chalco Valley are: 1) ignorance about the level of local hazards; 2) unsafe structural housing conditions; 3) continuous failure of La Compañía canal infrastructure and sanitation system; 4) high exposure of vulnerable people.
The areas where civil protection authorities, emergency services, and government officials should pay attention are the places identified in this work that show high and very high global vulnerability and risk levels. The results of this work will support the development of local disaster response plans and mitigation actions.
Our results should be broadened with other types of studies, including the analysis of the social construction of risk. We believe that a program to reduce the structural vulnerability in areas identified with high-risk should be developed. We also recommend the regulation of local housing construction in these areas. In general, our methodology contributes elements for decision makers to implement risk-reduction actions.

