


 nueva página del texto (beta)
 Inglés (pdf)
 Artículo en XML
 Referencias del artículo
 Enviar artículo por email
 Citado por SciELO
  Similares en
SciELO
Similares en
SciELO 
 Permalink
INTRODUCTION
The description of the so-called natural disasters has changed in recent decades, from a naturalistic perspective (Bullock, 1993; Schutt, 2010; Fuchs, Birkmann, and Glade, 2012), to one that takes into account the vulnerability component (e.g., Cannon, 1994). Consequently, disasters are not inevitable since they are frequently associated with lack of planning and prevention measures. Floods are probably the type of natural disasters with greater social, economic and environmental costs (Istomina, Kocharyan, and Lebedeva, 2005; Messner and Meyer, 2006; Re, M. 2011; Worldwide, 2012). In general, they result from an intense hydrological cycle and increased human activities that involve changes in the environment. Floods related to intense rains are becoming more frequent due to climate change (e.g., Trenberth, 2011; Hirabayashi et al., 2013). However, changes in the landscape make some regions more prone to this type of disaster (Romero Lankao, 2010). Therefore, the traditional paradigm of “flood protection” (response to disasters only) is currently considered inappropriate (UNDRO, 1991; Plate, 2002). A risk-management approach should be followed —including landscape planning— for regions that are highly vulnerable to intense rainfall.
Human activities such as agriculture, urbanization, cattle ranching or logging compact soils and reduce rainfall infiltration (Solín, Feranec, and Nováček, 2011), hence resulting in heavier runoff in mountainous regions that may lead to flooding when intense rainfall occur. Deforestation also result in increased erosion and transport of soil that is deposited in river beds, hence reducing river transport capacity. Therefore, floods are fostered when changes in soil cover reduce the infiltration capacity of soil (Walling, 1999).
In coastal regions, as well as in lowlands of deforested watersheds, intense summer rainfall, sometimes related to landfalling tropical cyclones, trigger floods (Tejeda-Martínez and Welsh-Rodríguez, 2006; Aparicio, Martínez-Austria, Güitrón and Ramírez, 2009); some floods may also occur during the winter, after persistent rainfall episodes overflow water channels, dams and reservoirs (Álvarez, 2016). These illustrate that water management or issues related to hydraulic infrastructure may be flood-risk factors. Therefore, the social and environmental context where heavy rainfall occur largely determines the occurrence of floods (Viglione and Rogger, 2015).
In Mexico, the number of floods is increasing (DesInventar, 2013) (Fig. 1); these currently make up more than 50% of all natural disasters in the country (CENAPRED, 2014). As in many other parts of the world, the increased deterioration (deforestation) of basins, along with changes in the hydrological cycle, is making them more prone to floods and landslides (Alcántara, 2004; Coutu and Vega, 2007). Approximately 25% of the Mexican population is at risk of being affected by floods (Saavedra, 2010). Therefore, a diagnosis of the major causes of this type of disaster should be determined, and a risk management strategy should be implemented if the social, economic and environmental costs of floods are to be reduced.
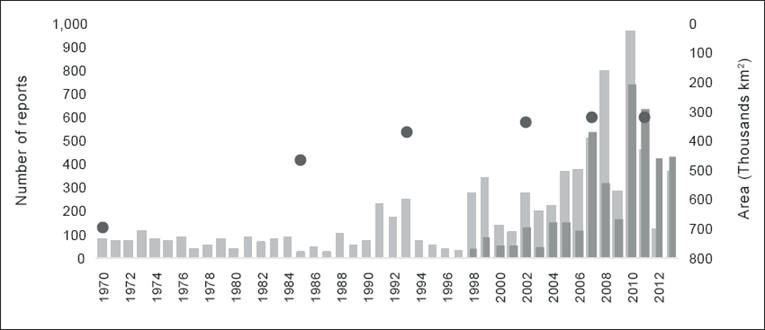
(source: INEGI, 2011)
Fig 1 Yearly number of flood reports in Mexico for the 1970-2013 period according to DesInventar (2013) (light-gray bars) and to CENAPRED (2014) (dark-gray bars) for the 1998-2013 period. Dots correspond to estimates of accumulated deforested areas in Mexico (km2) between 1970 and 2012
Therefore, the objective of this work is to analyze the positive trends in flood events and the increased vulnerability of deteriorated watersheds in Mexico in relation to the hazard of intense rainfall. In particular, the present analysis focuses on how the degradation of basins due to deforestation increases the risk of flooding when heavy rainfall occur. Section 2 describes the data and methodology used in the study. Part 3 details the methodology for flood-risk analysis. In the section 4, a discussion on the results is provided. Conclusions and recommendations on flood-risk management are drawn in the final part of this article.
DATA AND METHODOLOGY
i) Data
This study quantifies natural hazard by means of daily extreme rainfall figures that are equal or larger than the 95th percentile of daily precipitation (P95) from gridded fields within a rainfall grid with a 10-km spatial resolution. Precipitation gridded were elaborated using a Cressman (1959) objective analysis scheme with data from more than a thousand climatological stations in Mexico for 1979-2014 period. The stations selected account for over 70% of data for the period of analysis. Under such a scheme, station data iteratively modify a preliminary (first-guess) daily field until a minimum difference between station data and gridded fields is reached (Daley, 1981; Magaña, López, and Vázquez, 2013). The first-guess precipitation field was estimated from Global Precipitation Climate Project (GPCP) daily data (Adler et al., 2003). Episodes of more than 100 mm accumulated precipitation during three consecutive days were also used to characterize natural hazards that may result in floods.
On the other hand, the vulnerability to heavy rainfall depends on the physical conditions of the basins. Significant changes in land cover took place since 1970, as evidenced by data from the National Institute of Statistics, Geography and Informatics (INEGI, 2011), and from the National Commission on Biodiversity (CONABIO, 2010), for years 1970, 1985, 1992, 2002, 2007, and 2011. Land-use cover data were used to determine the characteristics of hydrological soil groups. A Digital Elevation Model (DEM) with a 10-m vertical resolution was used to determine the physical structure of watersheds (INEGI, 2013).
Data on the number of floods were obtained from two sources: i) the DesInventar V6 (2013) project, that accounts for disaster activity based on newspaper reports between 1970 and 2013, and ii) data from CENAPRED for 1998-2013. DesInventar does not provide an actual account of the physical characteristics of floods, but serves as a flood-activity indicator. CENAPRED is the official source of disaster information and was compared to DesInvenatr as a means to have more robust data on floods and impacts. There are additional sources for particular flood events; one such sources is the Dartmouth observatory, but it only makes reference to case studies and not to actual trends in the number of floods.
Floods are more frequent during the summer rainy season, as precipitation extremes are more common during this season of the year when the soil is wet, which makes it less permeable to rainfall. There are more flood reports for central and southern Mexico than for northern Mexico, not only because intense rainfall is more frequent, but also because deforestation is more severe in the former. Monthly precipitation and flood reports appear to be consistent for central-southern Mexico and show signals of the Mid-Summer Drought (Magaña, Amador, Medina et al., 1999), with a relative minimum in August (Fig. 2). Over the northern part of Mexico, floods tend to be more frequent during September, once the soil is saturated.
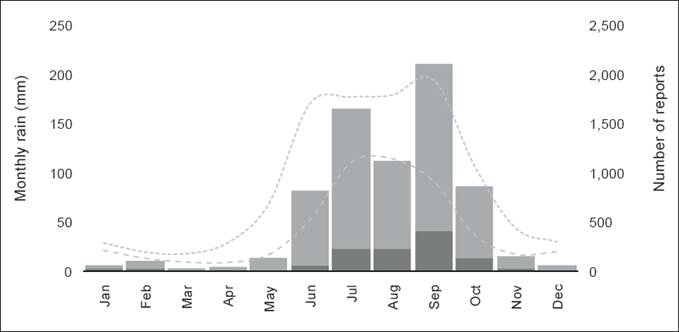
(sources: DesInventar, 2015 and CONAGUA, 2015)
Fig. 2 Average number of monthly flood reports in northern (dark-gray bars) and central-southern (light-gray bars) Mexico, between 1970 and 2013. Average monthly precipitation (mm) in central-southern (short-dashed line) and in northern (long-dashed line) Mexico
ii) Methodology
There is no universally accepted approach to estimate vulnerability (Gain, Giupponi, and Renaud, 2012) and, consequently, several methods have been proposed to quantify it (e.g., Balica, Dinh and Popescu, 2015). The use of indicators that describe the vulnerability factor is common practice (e.g., Neri and Magaña, 2016). A proper identification of vulnerability is crucial if risk-reduction strategies aimed at diminishing disaster activity are the goal. The indicators may be combined into a single vulnerability index for a region or sector, and may be compared from one region or sector to another.
In this study, vulnerability is derived from three main factors:
Runoff, estimated by CN and HG (dynamic factor)
Terrain slope, α (static factor)
Compactness index, Ci, in relation to watershed shape (static factor).
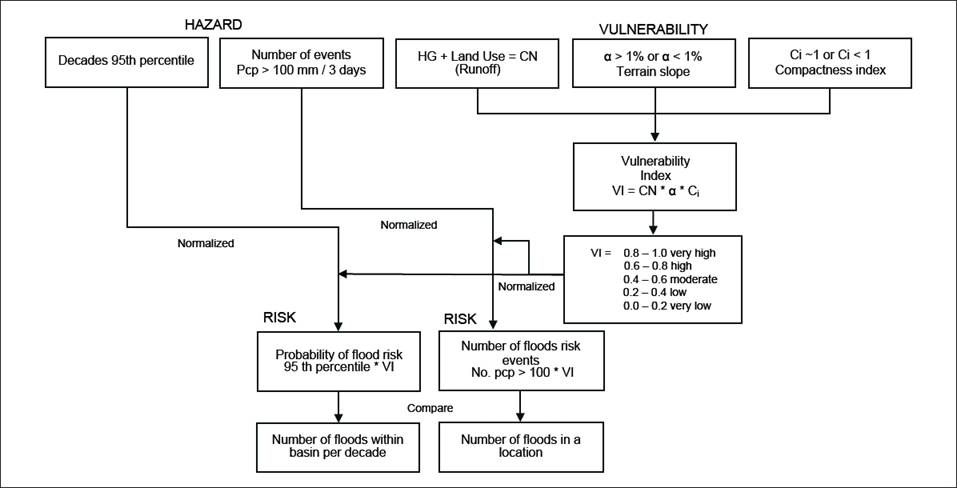
The hazard may be characterized as condition of extreme weather in a period of time, for instance by means of the 95th percentil of daily precipitation, which indicates where extreme events have a certain intensity. When this information is combined with a vulnerability estimate, those regions with a large probability of experiencing a flood are identified (Fig. 3). The hazard may also be determined annually by considering the number of times a certain meteorological condition occurs, for instance, number of days with precipitation >100 mm for three days. When this information is combined with the vulnerability index, the flood-risk estimate obtained may be compared with the actual number of floods that occurred in a given location.
Direct runoff resulting from intense rainfall is obtained for each Hydrologic Soil Group (HSG) by means of the Curve Number method (Wood and Blackburn, 1984; Hernández, 2000; Melesse and Shih, 2002). Hydrologic groups are: agriculture, forest, human settlements, scrubland, jungle, other vegetation types, pasture land, and without apparent vegetation. According to the soil type, HSG may be defined as either A, B, C or D (USDA-NRCS, 1986), which refers to its infiltration capacity:
Group A: low runoff potential;
Group B: moderate runoff potential;
Group C: high runoff potential, and
Group D: very high runoff potential.
The curve number (CN) method of the Natural Resources Conservation Service (USDA, 1979; USDA-NRCS, 2004; Mishra and Singh, 2013) is a structured semi-empirical scheme that takes into account soil moisture from accumulated precipitation in a region to estimate runoff using standard values from tables of the USDA-NRCS (USDA - NRCS, 1986; Domínguez et al., 2008) for each HG. CN values range from 0 to 100, with CN = 0 corresponding to a region that has no runoff and CN = 100 describing a virtually impervious area (Gaspari, 2007). Direct runoff, Q, as a function of CN was calculated in the present study for rainfall values larger than P95. The relationship between P (mm) > P95 and direct runoff, Q, was obtained following Aparicio (2008) by means of:
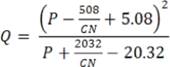 (1)
(1)
Forests are 35% to 45% more permeable than land for agriculture, or 50% more permeable than human settlements. As landscapes change from forests to agriculture and cattle-ranching land, or to urban settlements, they become less permeable and thus more vulnerable to intense rainfall since water does not infiltrate and accumulates at the surface, hence causing floods (Singh and Singh, 2011). Estimating runoff based on the CN method is common practice in hydrology (Svobdova, 1991; Nayak, 2012; Askar, 2013). A rapid increase in runoff occurs for most soil types when P > 100 mm/day, particularly in the case of pasture land or human settlements (Fig, 4).
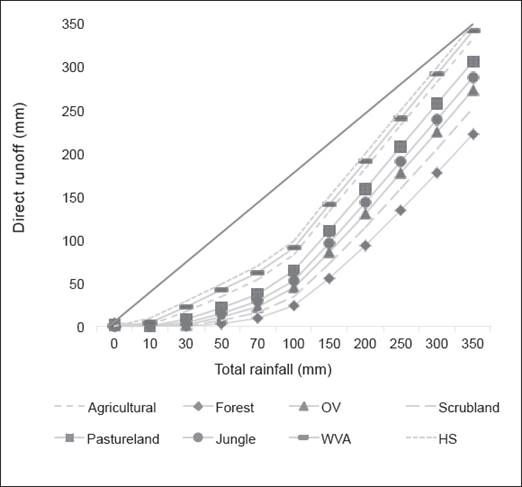
Figure 4 Direct runoff for various soil types: Agriculture, Forest, OV (Other Vegetation types), Scrubland, Pasture land, Jungle, WVA (Without Apparent Vegetation) and HS (Human Settlements). The straight line is a reference when Q is equal to P (e.g. Paz-Pellat, 2009).
Changes in land cover alter the HSG-NC characteristics and the regional vulnerability to intense rainfall by increasing runoff. However, vulnerability to rainfall should also include factors such as the edaphic characteristics of soil, antecedent soil moisture condition (AMC), terrain slope, and watershed compactness, since these also affect flood intensity. For instance, it is generally towards the end of the rainy season in Mexico when soil moisture reaches a peak and the increased runoff may cause floods. The slope of the terrain influences the amount of runoff and flood-prone areas. It can be divided into:
Class I, called flat areas, with a slope, α, of less than 1%
Class II, called wavy zones or contributing areas, with α > 1%
Class I is more likely to experience floods than Class II, since the physical parameter α determines the potential for runoff in watersheds. It was calculated according to the morphological characteristics of the terrain (Pedraza, 1996; Weiss, 2001) using a digital elevation model (INEGI, 2013).
Finally, the compactness index Ci was calculated to describe the shape of the basin (round or elongated) in order to estimate the amount of rainfall captured in each basin (Campos, 1987). The compactness index Ci is calculated through the empirical relationship:
 (2)
(2)
where P is basin perimeter (km), and Ac is basin area (km2). In circular basins (Ci ≈ 1), the basin area, runoff volumes and concentration time are all higher vs. elongated basins (Ci < 1). For the present analysis, a basin with Ci = 1 and α < 1% is more vulnerable than one with Ci = 0 and α > 1%, since the former is more prone to large rainfall uptake and runoff accumulation than the later. Slopes and compactness are also vulnerability factors but these can be considered as static.
The combination of these factors (indicators) results in a vulnerability index that shows those areas most likely to be affected (flood) by intense rainfall. It would also be adequate to include the effect of sediments on riverbeds as a vulnerability factor, since it results in a lower streamflow capacity. However, there are no adequate data to quantify it, and thus it is not considered in this work (Clark and Wilcock, 2000). Once the hazard and the vulnerability are obtained, an estimate of risk under intense rainfall can be determined and compared with disaster events. The risk of flood is calculated as the product of the normalized values of the natural hazard (P95) by the vulnerability index. In general, climatic vulnerability varies at time scales longer than the hazard and, consequently, it is considered to be the low-frequency modulator of risk and disaster activity (Neri and Magaña, 2016).
Finally, the adequacy of the vulnerability and flood-risk estimates was obtained by comparing the spatial distribution of flood risk vs. actual flood reports for a given period of time. Furthermore, the dynamic character of risk may be related to disaster activity. For instance, the trend in the number of floods should be recorded by the estimates of risk for recent decades. In this way, it is through the spatial and temporal comparison of risk and flood frequency that the adequacy of vulnerability can be evaluated, since there are no historical records of the magnitude of floods for a more quantitative assessment.
Results
a) Vulnerability, risk and flooding activity
During the second half of the summer, daily rainfall above P95 is more frequent across the Mexican territory, which determines that most floods occur during September and October. There are significant spatial contrasts in the magnitude of P95 (Fig. 5), with lowest values in some arid and semiarid regions where P95 < 30 mm/day, and highest values in and southern areas of Mexico, where tropical cyclones and orographically forced moisture fluxes produce intense rainfall (e.g., more than 100 mm/day as recorded in climatological stations across this region).
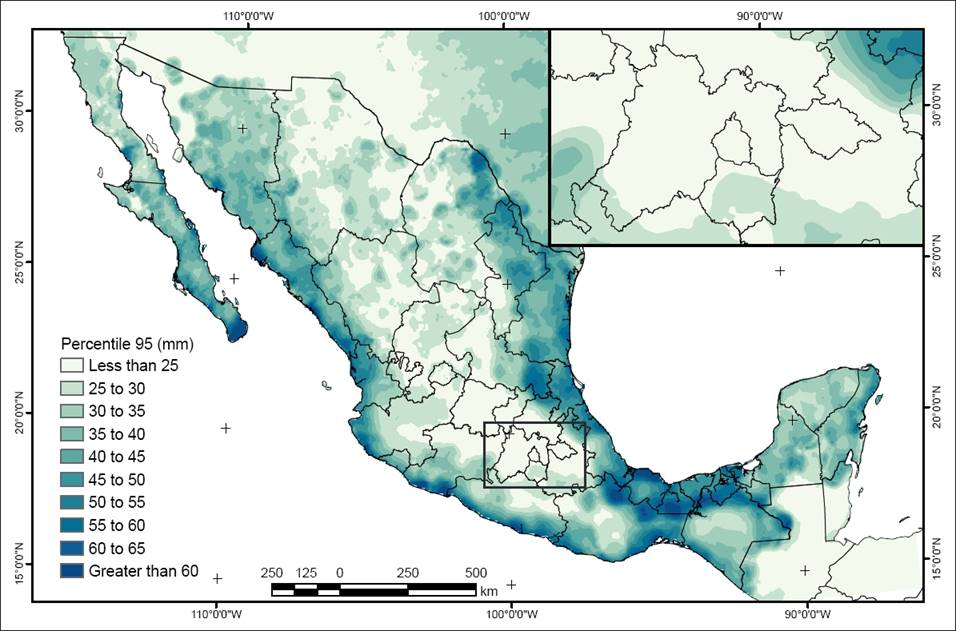
In some arid regions of northern Mexico, including the southern Baja California peninsula and northeastern Mexico, P95 is large due to the passage of tropical cyclones even when the annual cumulative rainfall is low. In the Mexico City Metropolitan Area, extreme precipitation events (P95 > 25 mm/day) occur mainly in the western part of the Valley of Mexico (Magaña, Pérez y Méndez, 2003).
Regions that experience floods are located mainly along the coasts, where P95 frequently exceeds 50 mm/day. However, the spatial distribution of floods in Mexico depends not only on the hazard, but also on the vulnerability context within which intense rainfall occurs. An increase in the number of floods in recent decades is more evident in the states close to the Gulf of Mexico, in the central Highlands (including the Mexico City Metropolitan Area), the southern coast of the Mexican Pacific and parts of northern Mexico (Fig. 6). Only in a few places floods tend to decrease, as in the state of Baja California or in central Chihuahua. Under a simple naturalistic focus, one may think that the change in the hydrological cycle (climate change) has led to the increased frequency in the number of floods observed, but from a risk perspective one should consider changes in the natural hazard as well as in the vulnerability context in which more frequent intense rainfall is now occurring.
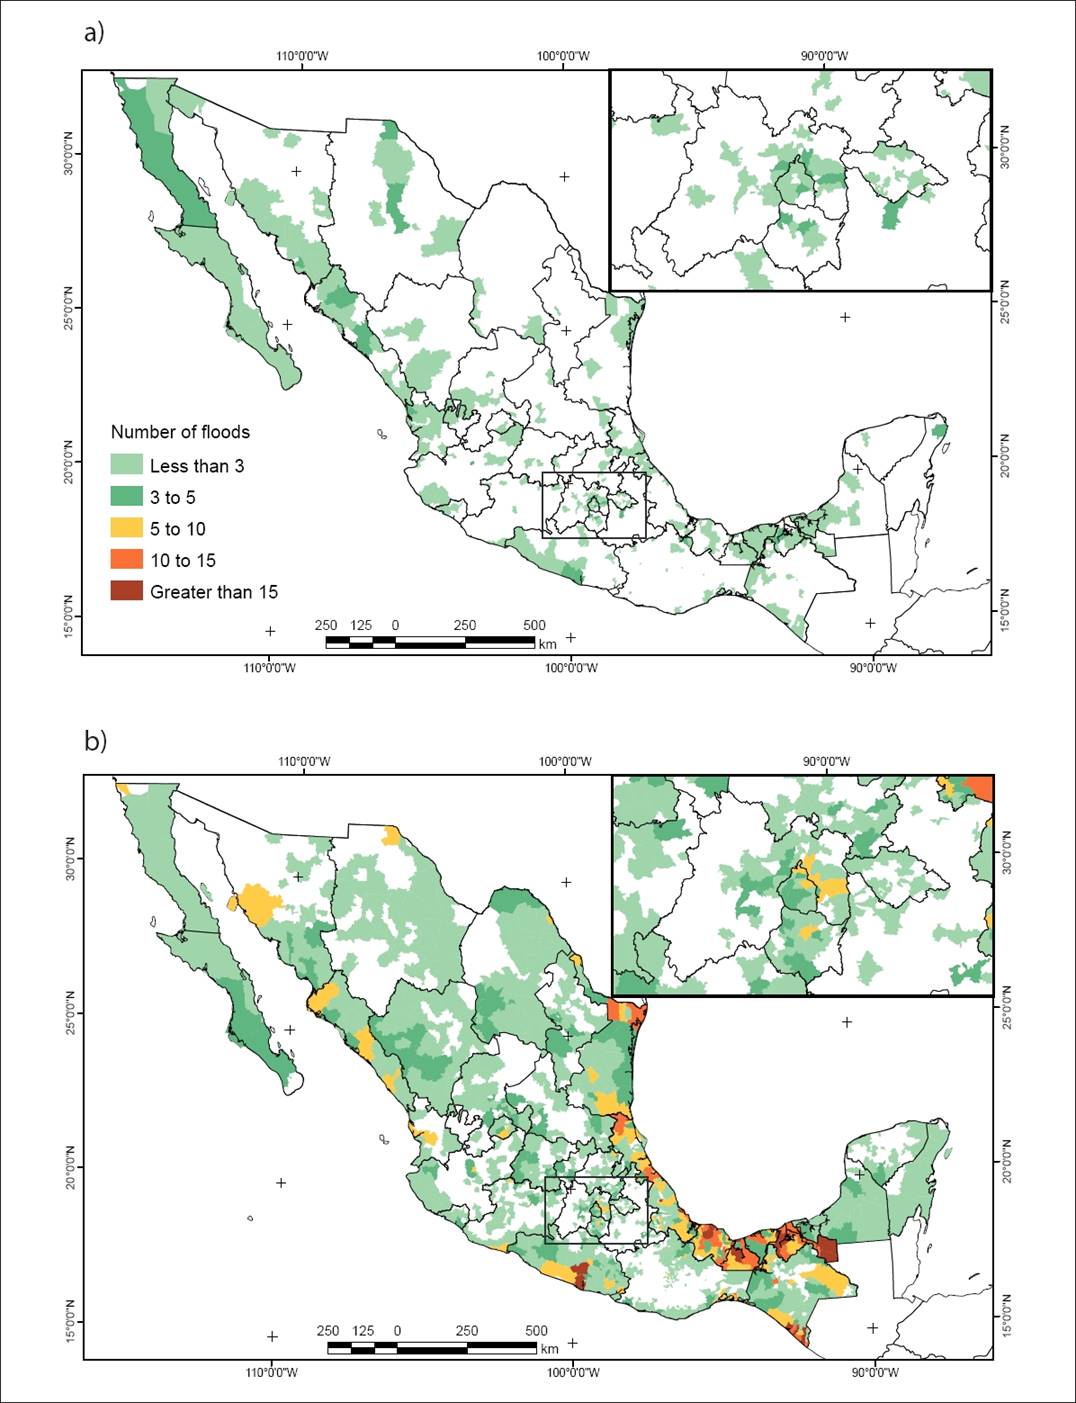
Fig.6 Number of floods reported by Desinventar for the 1980-2010 period: a) 1980-1990, b) 2000-2010.
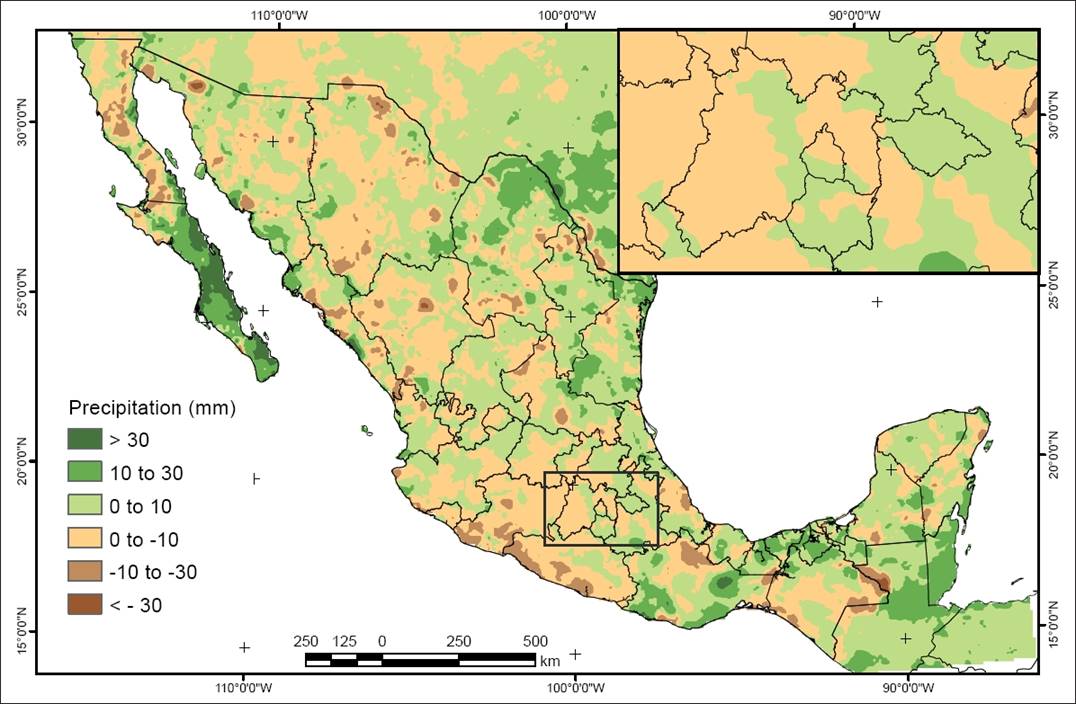
The trend in the number of days with precipitation above P95 shows that more frequent intense rainstorms are occurring over a large area of the Mexican territory (Aguilar et al., 2005). This could partially explain the rise in the number of floods. For instance, in the Baja California peninsula and northeastern Mexico, P95 is currently larger than two decades ago (Fig. 7). More landfalling tropical cyclones in this region have led to more frequent floods. During the 1960s. approximately 10 tropical cyclones affected Baja California Sur, 7 in the 1970s, 18 in the 1980s, 24 during the 2000s, and approximately 10 during the present decade. Consequently, in this region the higher incidence of floods is primarily due to the increase in hazard activity. In the Valley of Mexico, P95 events are more intense and occur more frequently now than in the past, just a couple of decades ago. The urban heat island effect associated with Mexico City is the leading cause of more intense rainfall (Jáuregui and Romales, 1996), but changes in land cover, particularly in the mountains surrounding the Valley of Mexico, have significantly increased the volume of runoff and the frequency of urban flood events.
The dynamics of vulnerability is an important element in risk analysis. Changes in land cover are one of the most important drivers of water infiltration, runoff and sediment buildup in rivers, lakes and dams. Deforestation for agriculture, cattle ranching and urban expansion has increased in Mexico in recent decades. It is estimated that forest cover has undergone a 30% decrease between 1970 and 2010. Such changes occurred mainly between 1970 and 2000 to expand agriculture and cattle ranching (Mas et al., 2004), resulting in an increased area covered by impervious soil in some basins. Infiltration capacity in scrubland and forests is higher than in grasslands, agricultural land or regions without vegetation. Therefore, the changes in land cover in Mexico, mainly associated with deforestation, have led to increased runoff and reduced infiltration capacity, creating favorable conditions for flooding. Land cover transformations are more important in regions near the Gulf of Mexico, where the increase in agricultural land has grown approximately 60% in around forty years (INEGI, 1985 and 2011) and appear to be the main cause of more frequent floods (Pérez, 2002; Seingier, Espejel, and Almada, 2009).
The vulnerability index to heavy rainfall was defined for 987 catchment areas (Fig. 8) using the product of two static indicators, terrain slope and compactness index, and a dynamic indicator, soil cover, related to runoff based on the CN. A normalized vulnerability between 0 and 1 has been categorized into five vulnerability levels: 0.0 to 0.2 (very low), 0.2 to 0.4 (low), 0.4 to 0.6 (moderate), 0.6 to 0.8) and 0.8 to 1.0 (very high). The regions most vulnerable to heavy rainfall are located in northwestern Mexico (state of Sinaloa), the regions adjacent to the Gulf of Mexico (Tabasco, Veracruz and Tamaulipas), the valleys of the central part of the Mexican Highlands, the Trans-Mexican Volcanic Belt, along the coast of Chiapas, and the Colorado river delta. Vulnerability to intense rainfall is also high in some parts of central northern Mexico and Chihuahua.
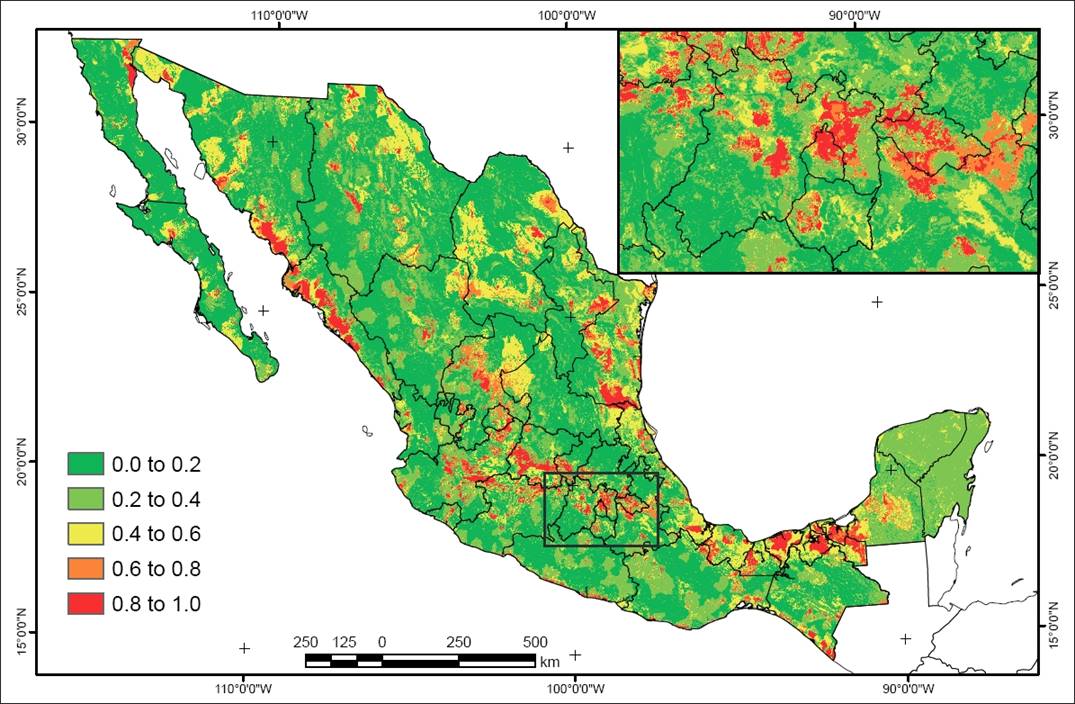
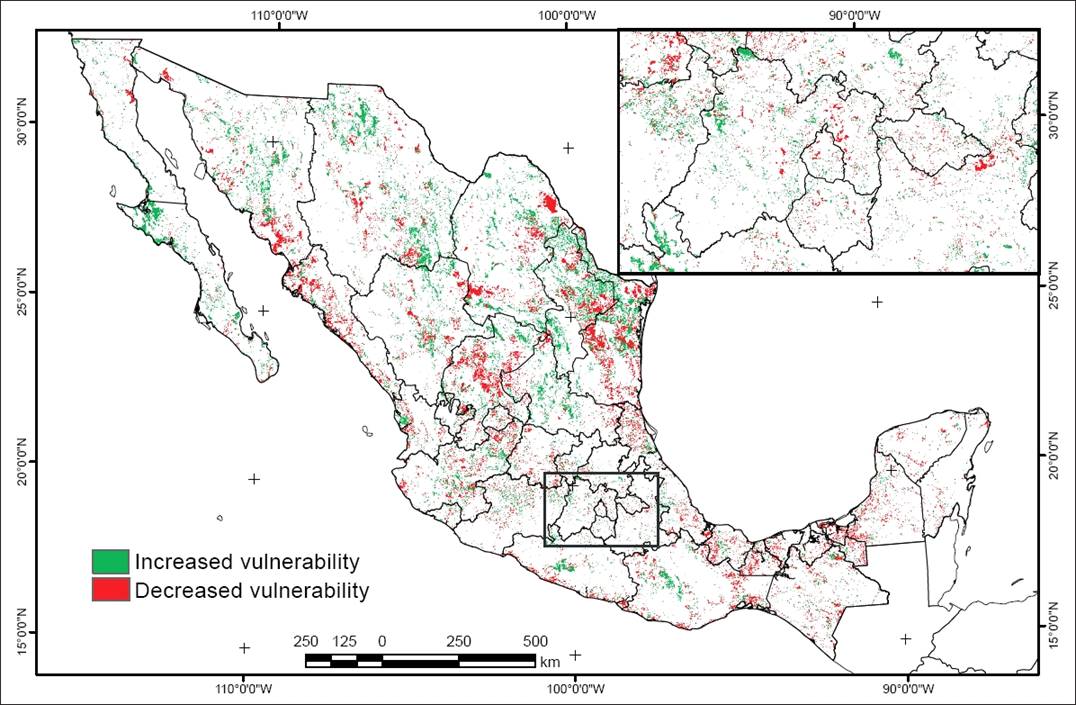
The vulnerability index increased in most regions between 1970 and 2010, although it decreased in some areas (Fig. 9). The regions that show the largest increase in flood occurrence (Fig. 6) roughly correspond to the regions where vulnerability rose, such as the coastal regions of the Gulf of Mexico and northwestern Mexico (Sinaloa and Sonora), or the coast of southern Mexico, where some of the largest changes took place.
The increased risk of floods due to deforestation for specific regions of Mexico where the hazard of intense rainfall associated with various phenomena has emerged, is illustrated below.
b) Flood risk: case studies
A risk estimate is the main goal in order to analyze or prevent disasters. Since hazard is expressed in terms of probability and vulnerability by means of an index, risk is also expressed in terms of probability. However, when the hazard corresponds to a specific flood event in a particular time and location, it is expressed in terms of intensity, and risk has a specific value that can be compared with the actual disaster information. The challenge is to determine the proper combination of vulnerability and hazard that yields the most adequate spatial and temporal representation of the disaster. When flood activity is calculated on an annual basis, the associated vulnerability varies gradually following a logarithmic function, as deforestation and land-cover changes progress (Fig. 10). The vulnerability index between 1970 and 2010 shows the low-frequency modulating effect of flood risk.
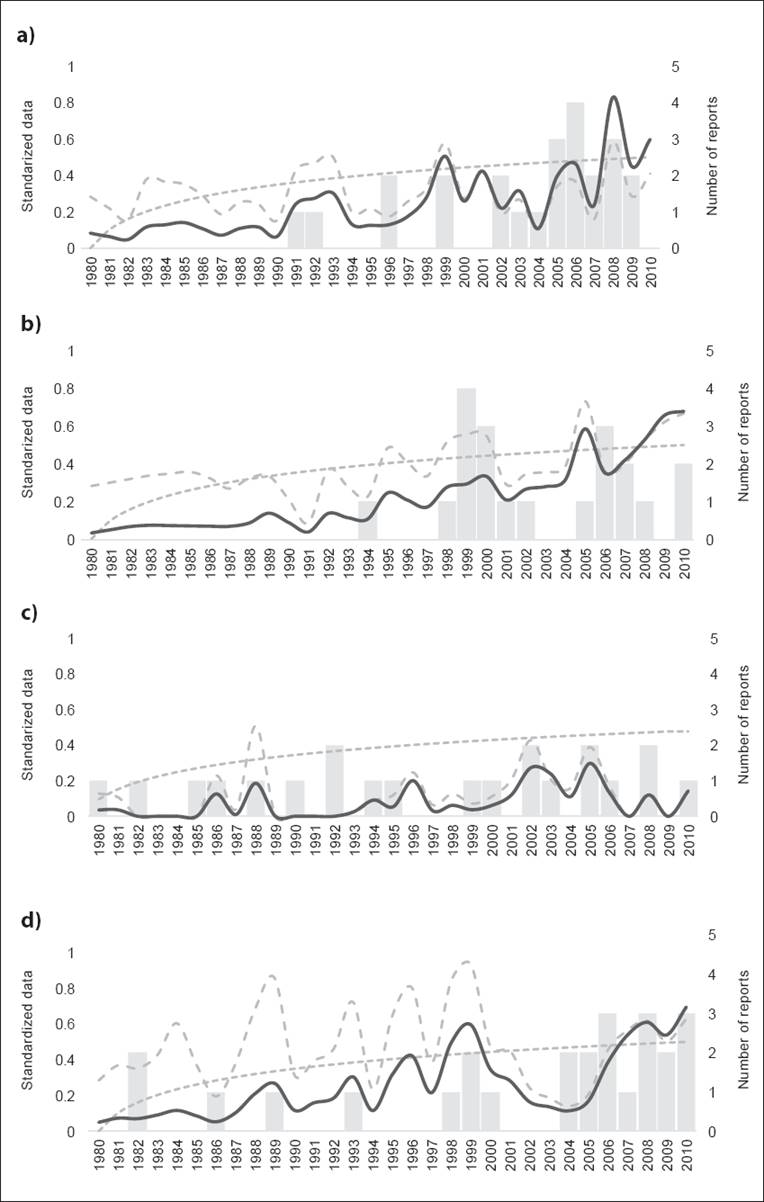
Fig. 10 Time series of number of events when precipitation in three consecutive days exceeded 100 mm (long-dashed line), vulnerability index (short-dashed lines), risk estimate (solid line), and number of flood reports (grey bars) for: a) Boca del Río, Veracruz; b) Tapachula, Chiapas; c) Monterrey, Nuevo León; and d) Acapulco, Guerrero.
The annual evolution of risk and the number of disasters for four locations in Mexico are presented as case studies: a) Boca del Río, Veracruz; b) Tapachula, Chiapas; c) Monterrey, Nuevo León; and d) Acapulco, Guerrero, all being regions where the number of floods has increased. In these locations, intense rainfall is related to tropical cyclones, cold surges, mesoscale convective systems or easterly waves, and frequently last for more than three days. The number of events when precipitation was above 100 mm in 3 days was used as a hazard index and was obtained from the records of climatological stations in those places. This measure of hazard was obtained empirically by examining the meteorological conditions that led to floods. The hazard activity varies on interannual time scales with more precipitation extremes on wet years, related to La Niña years, for instance. Therefore, hazard shows a higher frequency variability vs. vulnerability, which in the long term modulates the evolution to higher risk values. It was found that the likelihood of flood reports in the increases over time as a result of a higher vulnerability and not always due to more intense rainfall activity. Therefore, if increasing flood activity is to be explained, one must necessarily include the modulating effect of vulnerability. Moreover, in Tapachula or Acapulco, there is a trend toward more extreme precipitation events also contributing to the higher flood risk in recent decades (forty years). This effect may be associated with the trend to a higher incidence of tropical cyclones along the Mexican Pacific coast in recent decades (http://weather.unisys.com/hurricane/e_pacific/index.php).
One may even consider critical risk values for the probability of flood to be high, i.e., when more than one flood event occurs in a location. In recent years, the critical flood-risk value (around 0.3) has been surpassed more frequently. This risk condition may set a value for a Flood Early Warning System to be implemented. It may also serve to set vulnerability goals under climate change scenarios aiming at disaster prevention. Therefore, risk quantification is necessary for developing risk management actions, and vulnerability factors and indicators support actions that are deemed necessary to define efficient disaster prevention practices.
In most of these locations, the number of flood disasters has grown, especially in Boca del Río and Acapulco, where the respective basins have been affected primarily by changes in land use. Our results indicate that the probability of floods grows as risk increases. In Monterrey, the hazard activity has not increased in recent decades, but risk has risen due to the increased vulnerability. In 2008, two flood events were reported in this location even when the hazard activity was low. The clearest example of the risk-modulating effect is in Boca del Río, where even when the hazard activity remains almost constant, the modulating effect of vulnerability increases the flood-risk value, just as the flood activity increases.
It is clear that the risk model may be improved by including additional elements in the vulnerability analyses. For instance, the increased amount of sediments in the riverbeds or the actual soil moisture conditions prior to the flood may contribute to make a region more vulnerable for river flooding. This requires finding creative ways to represent this effect when insufficient data is a limitation. Even more, to better define regions that mostly contribute to increase vulnerability to intense rainfall, the risk analysis requires constant updates in time, with a frequency tailored to the evolution rate of the vulnerability factors.
c) Floods in Acapulco
In Acapulco, vulnerability and hazard increased in recent years, and hence the frequency of flood events (Fig. 10d). The presence of tropical cyclones nearby constitutes a major natural hazard to the coastal cities of the southern Mexican Pacific coast. Tropical cyclone Paulina in 1997 resulted in numerous fatalities (120 deaths) and significant economic losses (300 million pesos) for Acapulco (Matías Ramírez, 1998). Hurricane Manuel in 2013 caused 100 human losses and 23,000 million pesos in damages (CENAPRED, 2013). Pauline in 1997 was a much stronger tropical cyclone than Manuel in 2013, but vulnerability was higher in recent years, which led to a more intense flood disaster. Acapulco has undergone rapid urban growth in recent decades, particularly over the mountains surrounding Acapulco Bay (Fig. 11). The index of vulnerability to heavy rainfall in 1970 rose from low or average values to high and very high vulnerability values over most of the coastal region and lowlands, particularly near Laguna de Tres Palos, in the southwest of the domain.
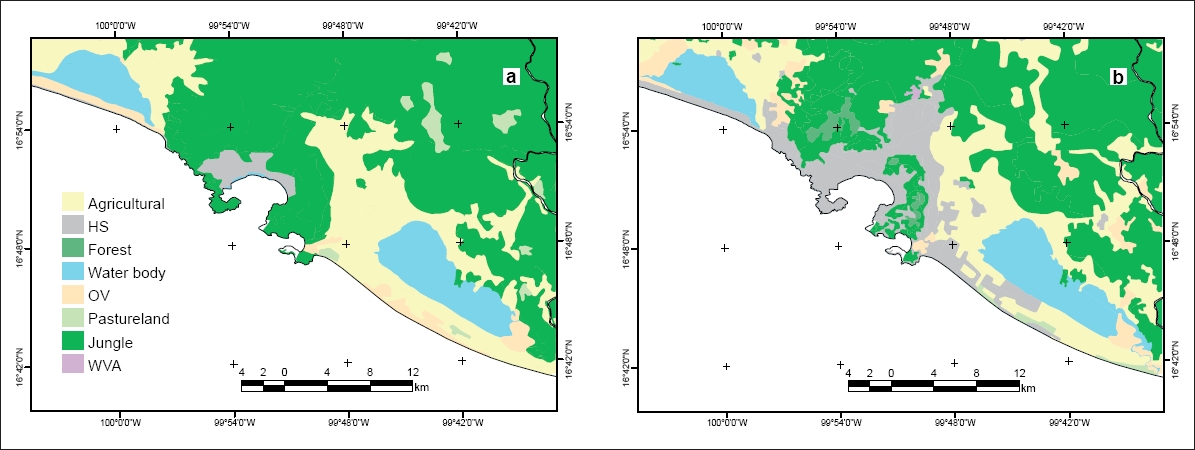
(INEGI, 1970 and 2010)
Figure 11 Land-cover change around in the Papagayo basin and Acapulco Bay in a) 1970, and b) 2000. HS (human settlement), OV (other type of vegetation) and WVA (without apparent vegetation)
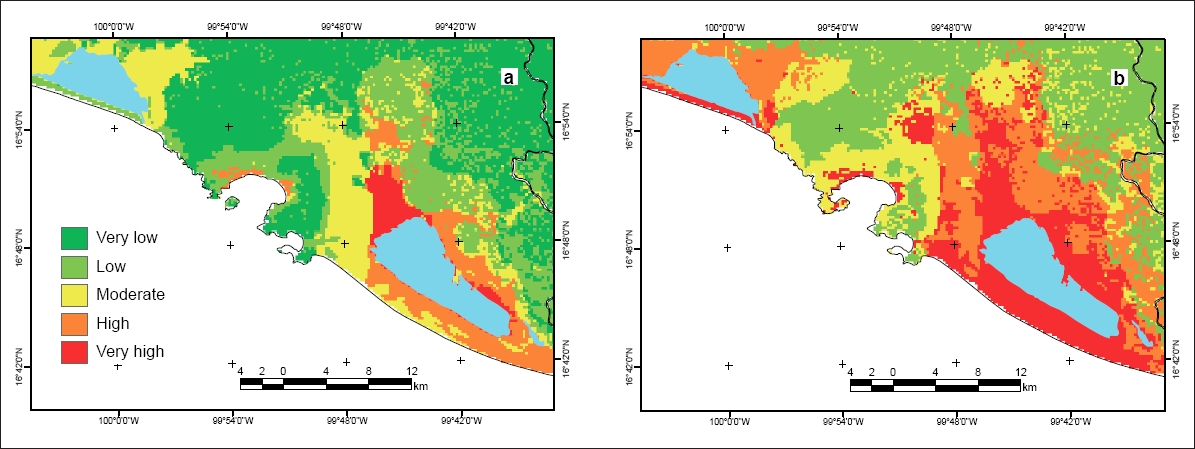
Between 1970 and 2010, approximately 110 km2 of natural vegetation were transformed in the Acapulco Bay region. If flood-risk index values are divided into five equal categories, from very low to very high, it is found that the Acapulco area changed from low flood risk in approximately 30% of area, to high and very high flood risk in approximately 40% of the area, particularly near Laguna de Tres Palos and around Laguna de Coyuca (Fig. 12).
In September 2013, the region surrounding Acapulco experienced a major flood event in relation to the intense rainfall produced by tropical cyclone Manuel (Pedrozo-Acuña et al., 2014 and 2015). Precipitation rapidly exceeded 100 mm in a single day and more than 500 mm in three days in the Papagayo basin. The region most affected by floods was around Laguna de Tres Palos (Fig. 13), where the risk to heavy rainfall has increased in recent decades, mostly in relation to the deforestation process in the Acapulco mountainous region.
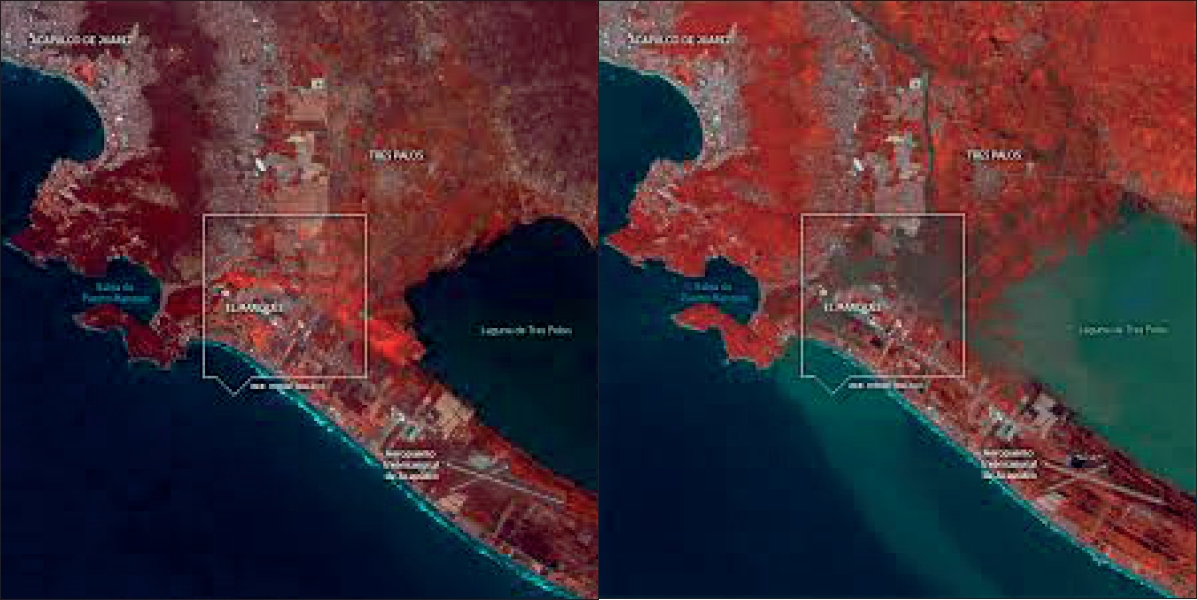
(source: Rapideye Image)
Fig.13 Satellite image a) for a period prior to 15 September 2013, and b) a few days after the flood event of September of 15 September 2013
In recent decades (forty years), the number of floods in the state Guerrero have at least doubled. The municipalities most affected are Chilpancingo and Acapulco, where much of the population of the state of Guerrero lives.
Conclusions
The rapid transformation of the Mexican territory during the twentieth (past) century has led to significant vegetation losses (Mas et al., 2004). The change in the frequency of heavy rainfall and a higher vulnerability of watersheds to intense rainfall have increased the risk of flooding in various parts of central southern Mexico. From a risk management perspective, reforestation and rehabilitation of ecosystem services at the basin level constitute adequate structural measures to prevent flooding activity and become adapted to climate change in the coming years. Heavy rainfall, represented by the P95 of daily precipitation, is more intense and frequent now than in previous decades, partially in relation to more tropical cyclones, as in the northeastern tropical Pacific.
On the other hand, the dynamics of vulnerability of watersheds to heavy rainfall is becoming higher due to continuous changes in land cover and, consequently, the risk of floods has risen. The number of floods (Last forty years) is higher in regions where physical vulnerability, related to the local orography and the presence of rivers, results in larger runoff. Therefore, more floods are largely the result of human activities, given the important land-cover transformations. The naturalistic focus, which tends to explain the occurrence of disasters only in terms of natural hazards such as intense rainfall, is not adequate to explain the increased frequency of hydro-meteorological disasters, at least for the case of Mexico.
There are other factors that increase the risk of flooding, which have not been examined here but that require special consideration. Sediments from deforested areas that are carried into riverbeds reduce streamflow capacity and results in more frequent floods in river meanders. These factors should be considered as part of a comprehensive flood risk analysis in order to reduce the negative impacts of floods on a more exposed society. The quantification of risk and the identification of critical or intolerable risk levels can guide some of the risk management options to reduce the occurrence and costs of floods. Structural vulnerability reduction measures would result in benefits for several region and communities, not only by reducing the number of natural disasters, but also by achieving sustainable development goals. To this end, however, authorities and society should:
leave behind the naturalistic focus to explain disasters:
use a risk analysis methodology to understand the dynamics of disasters; and
promote prevention by means of structural measures after identifying the vulnerability factors.
The present study describes a methodology to quantify vulnerability and construct a risk model that spatially and temporally explains floods in recent decades. It may take some time to reduce vulnerability effectively by means of robust structural measures, but in the mean time, early-warning systems referred to critical risk levels could be useful to reduce the impacts of floods on society.

