


 nueva página del texto (beta)
 Inglés (pdf)
 Artículo en XML
 Referencias del artículo
 Enviar artículo por email
 Citado por SciELO
  Similares en
SciELO
Similares en
SciELO 
 Permalink
Introduction
The analysis of human-environment interactions (Turner, 2002) has been a recurrent topic in geomorphological inquiry in different environments world-wide (Campos et al., 2012; Knight and Harrison, 2013; Migoń and Latocha, 2013). Other studies have addressed the relation between cultural landscape features, such as land use, with fluvial landforms (Hudson et al., 2006). Specifically, most research has focused on geomorphic response to human-induced environmental change (Fang et al., 2005; Vanacker et al., 2005; Knox, 2006; García-Ruiz et al., 2010; Castaldi and Chiocchini, 2012; González-Abraham et al., 2015).
Understanding the way in which humans use fluvial landforms is important for maintaining vital environmental and social processes (Miller and Doyle, 2014).Geomorphological inventory and mapping, despite of a long standing tradition, may still be valuable tools to unravel the quantitative and functional relationships within landscape. Study cases depicting these links are especially important in highly complex geographical regions, particularly in tropical developing countries, where land management is badly needed (Paneque-Gálvez et al., 2013).
Usually, these spatial relationships are not of the one-to-one or one-to-many type. This implies that more than one landform map unit may be under more than one land use and vice versa. In other words, simple correspondence of a land use pattern to a landform unit hardly ever exists in the tropics, where mosaics of land use occupy different terrains. However, in many case studies (e.g., Bocco et al., 2001 and literature therein), these relationships are somehow arbitrarily simplified. In fact, the relations are established only by map overlaying in a geographic information system (GIS). This is a simple GIS operation where the landform map is overlapped by the land use map, both in the same geometry. The intersected area per map unit is calculated and results report the area of overlap per landform map unit. Nevertheless, every landform unit may be occupied by many land uses, and these may be present in many other landforms.
This research argues that the results of map overlaying need to be followed by statistical analyses to properly depict the nature of such complex relationships. The objective of the paper is to explore the quantitative relationship between fluvial landforms and land use in a highly geographically diverse region in the tropical dry Mexican Pacific coast using Correspondence Analysis. The ultimate goal is to strengthen mapping tools for land use planning purposes.
A landscape classification system was put together with special attention on the conceptual background regarding land use. We have focused on the land use concept as a part of the human dimension of landscape that is essentially different from land cover. Land use is functional; it implies a human activity as taking place in a given portion of land, whereas land cover encompasses the biophysical characteristics of the object occupying a certain tract of land (Rhind and Hudson, 1980; Foody, 1996; Bibby and Shepherd, 2000; Johnston and Sidaway, 2004; Latocha, 2009; Bakker and Veldkamp, 2012; Downs et al., 2013). Therefore, understanding land use trends implies depicting underlying functional process (Vitousek et al., 1997). To satisfy the research needs, land use map units relied on land cover units coupled to a participatory field survey involving local inhabitants of the valley area.
Method, data collection and techniques
Study area
The lower valley of the Nexpa river (ca 1,400 ha; Fig. 1) belongs to the Sierra Madre del Sur, a mountainous physiographic province that extends along the entire Pacific coast of Michoacan State (Fig. 2). Morphogenesis is complex because of the heterogeneous structural and lithological conditions of the Sierra. In addition, the climate varies from tropical to temperate with a seasonal rainfall regime following altitudinal change and distance from the coast (Krasilnikov et al., 2011).

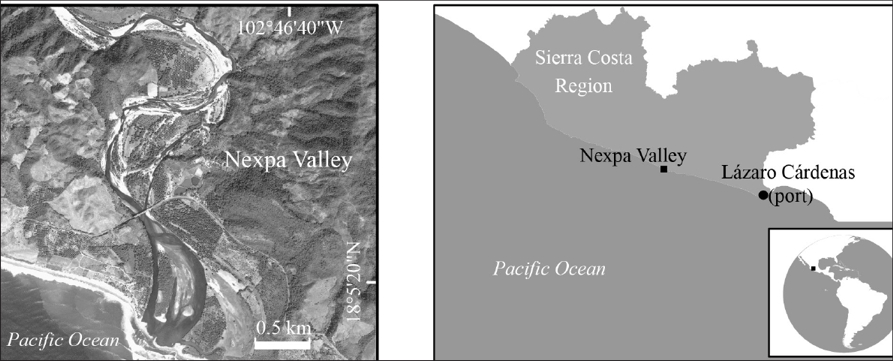
The Nexpa River discharges into the Pacific Ocean where the coastal plain interrupts the rocky, abrupt coast. Sedimentary environments within the fluvio-marine area include the beach, a spit-barrier and a coastal lagoon. The climate of the valley is tropical subhumid with an average annual temperature of 27.8 °C and a summer rainy season. Leptosols and Regosols are common on the Sierra slopes; Fluvisols are prominent in lowlands of fluvial origin (Ramírez-Herrera et al., 2012). During (dry) winters, water availability for crops and pasture is scarce and becomes a severe limiting factor for rural productivity. Land cover is dominated by tropical dry forests on the slopes and riparian vegetation on the valley bottom, while mangroves and coastal dune vegetation are present on the coastal plain.
Data collection
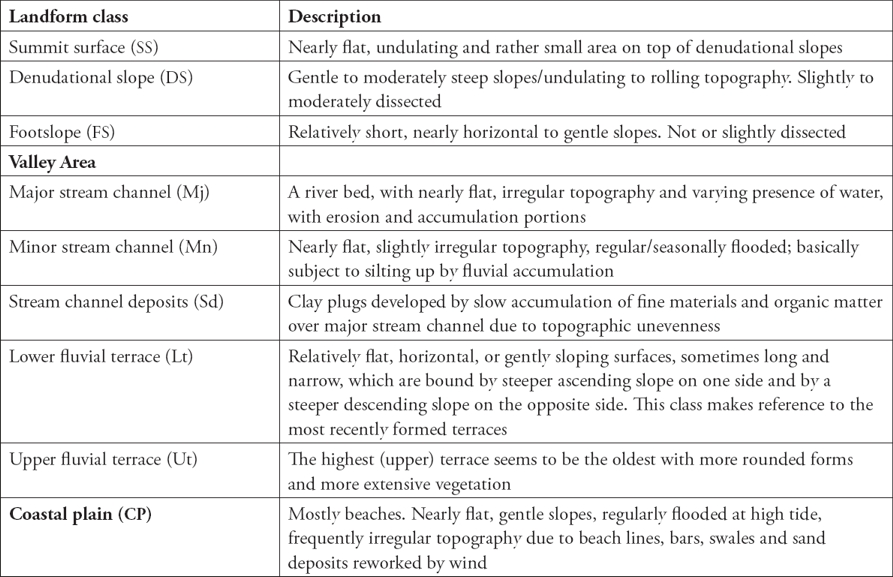
The strategy for data collection encompassed two phases: (1) preliminary satellite image stereoscopic interpretation using standard visual interpretation techniques, and (2) field verification and participatory land survey using basic ethnographic techniques. Both land cover and landforms were delineated on orthorectified, 0.6 m cell resolution, 2008 dry season Quickbird natural color stereopairs printed at a 1:10,000 scale. Resulting polygons were labeled according to categories of two hierarchical classification systems, one for land cover and the other for landforms. The landform classification scheme (Table 1) was based on criteria proposed by van Zuidam (1986) who used a terrain analysis mapping approach at different scales and level of detail (Bocco et al., 2001). The land cover classification system was based on Brown and Duh (2004) (Table 2). Both set of polygons were digitized and the two vectorial data bases were input to a geographic information system (GIS) (ArcGIS 9.3.1). Both maps were extensively field verified, together with local producers; particular attention was paid to polygon boundaries.

The land use data base was first determined from land cover information depicted on the satellite images, followed by an exhaustive, participatory field survey. This procedure fully involved local producers in semi-structured interviews, field recognition of land cover and terrain classes, and field mapping. The land cover classes thus determined are listed in table 3 as “dominant land cover type”, where land cover is given as a prevailing attribute of land use.

Data analyses
A matrix containing overlapping area values of landform and land use classes was created by map overlaying in the GIS (table 4). Correspondence analysis (CA) was used as the primary ordination technique mostly because it is simple and relatively easy to interpret. It is also a versatile tool that is useful for exploratory analyses of categorical data (Beh, 2007).
Table 4 Input matrix for Correspondence Analysis: area values (ha) shared between landform and land use polygons. A land use unit may contain one or more activities. Key (landform): CP: coastal plain; DS: denudational slope; FS: footslope; Lt: lower fluvial terrace; Mj: major stream channel; Mn: minor stream channel; Sd: stream channel deposits; SS: summit surface; Ut: upper fluvial terrace.

This type of multivariate statistical analysis serves the purpose of depicting landscape patterns and structure. The outputs are interpreted through an arrangement of data in a low-dimensional space where the similar entities are close and dissimilar entities are far apart (Gauch, 1982). In this low-dimensional space, dimensions are represented graphically by axes which simplify the interpretation of spatial patterns. CAtivariate statistical treatments have been applied in other studies to examine the relation between geomorphic and other environmental variables (Osterkamp et al., 1995; Lechterbeck et al., 2009; Castillo-Rodríguez et al., 2010; Zhao et al., 2015). To our knowledge, CA has not been used for the purposes of the present exercise.
In order to explore data grouping and potential relationships between landforms and land use classes, correspondence analysis (CA) was performed using R© 3.1.0 with the FactomineR package (Husson et al., 2007). The results produce a graphical output and a summary of indicators (contribution, square cosine and eigenvalues). The contribution indicates which classes are the most representative of each dimension while square cosine measures, in a scale from 0 to 1, indicates the quality of the representation of a particular class (Lê et al., 2008). Eigenvalues represent the proportion of variance that is explained by each particular dimension (Husson et al., 2010).
Results
Descriptive attributes of polygons and classes
Eighty-nine landform polygons were delimited; 42 out of them belonged to the summit surface class which happened to be, in area covered, one of the smaller categories. The denudational slopes and hills occupy the largest proportion of land (794 ha, 56.6%), followed by the coastal plain (317 ha, 22.6%). The valley area represents 14.7% of total surface (Fig. 3). Agriculture occurred in approximately 29.3% of the total area, whereas rain-fed agriculture occupied about 18.0% of the total area, and extensive irrigated agriculture occurred in 9.5%, and localized irrigated agriculture in 1.8 % (Fig. 4).

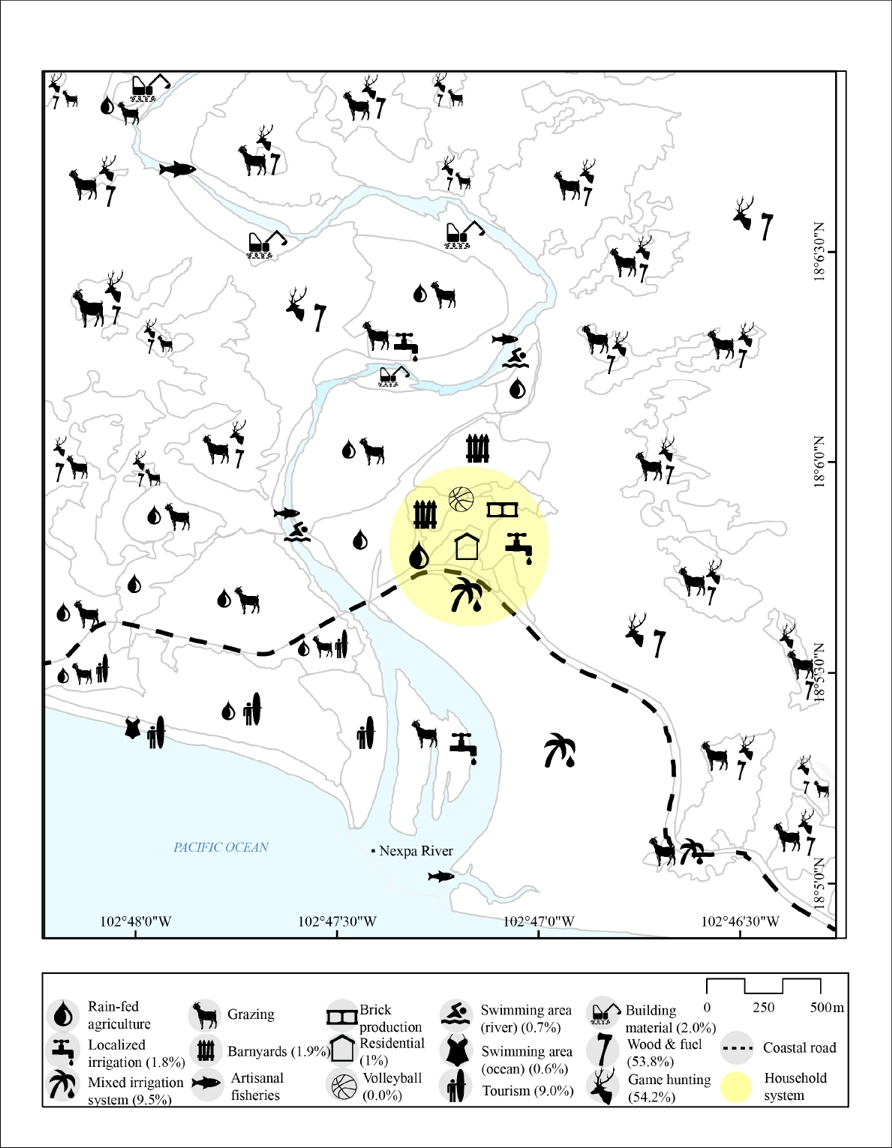
Figure 4 Land use map of the Nexpa Valley, southwest Mexico (See Table 3). Iconography from the Noun Project (https://thenounproject.com/). See the list of attribution per creator in the acknowledgement section below.
Correspondence Analysis
Correspondence analysis (CA) arranged entities based on their mutual correspondence. A first analysis, including all classes, produced unclear patterns of activity distribution over fluvial and denudational landforms (Fig. 5). The first three dimensions explain 75.5% of the total variance (Table 5). The results suggest that the major stream channel and coastal plain associate mostly with artisanal fisheries, swimming areas and tourism. While this statement seems accurate, it reveals that major stream channel and coastal plain are capturing too much variance in the analysis (Table 6). Thus, a second analysis was performed excluding both, major stream channel and coastal plain classes.
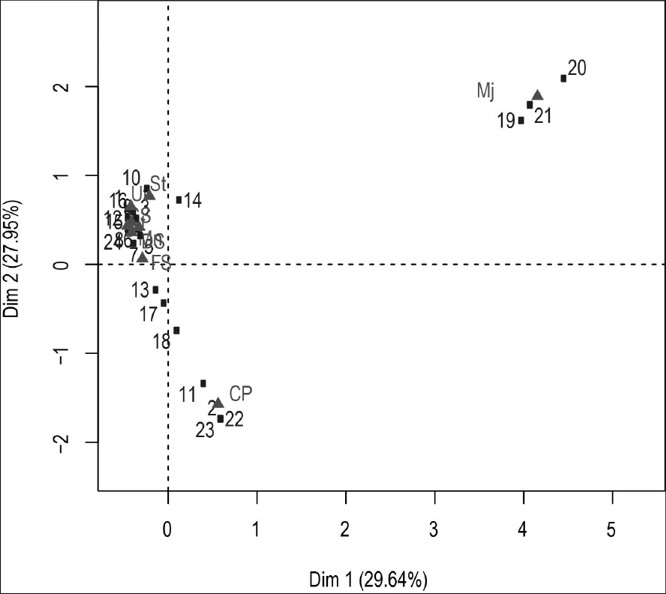
Figure 5 First Correspondence Analysis (CA) between landform and land use classes. Key (numbers): 1: barnyards; 2: swimming area (ocean) and tourism; 3: swimming area (river); 4: brick production; 5: building materials; 6: grazing, wood and fuel extraction and game hunting; 7: localized irrigation; 8: localized irrigation, barnyards, brick production and residential; 9: localized irrigation and grazing; 10: localized irrigation, grazing and tourism; 11: mixed irrigation system; 12: mixed irrigation system and barnyards; 13: mixed irrigation system and grazing; 14: rain-fed agriculture; 15: rain-fed agriculture, barnyards, brick production and residential (household system); 16: rain-fed agriculture and grazing; 17: rain-fed agriculture, grazing and tourism; 18: rain-fed agriculture and tourism; 19: artisanal fisheries (river shrimp, tilapia, catfish); 20: artisanal fisheries (river shrimp, tilapia, catfish) and swimming area (river); 21: artisanal fisheries (river shrimp, tilapia, catfish) and tourism; 22: artisanal fisheries (sea products); 23: tourism; 24: wood and fuel extraction and game hunting. Key (letters): CP: coastal plain; DS: denudational slope; FS: footslope; Lt: lower fluvial terrace; Mj: major stream channel; Mn: minor stream channel; Sd: stream channel deposits; SS: summit surface; Ut: upper fluvial terrace.
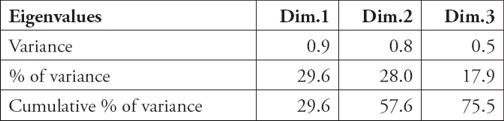
Table 6 Correlation values from the first CA including all categories. Key: Dim: dimension; ctr: contribution; cos2: square cosine

In this second analysis, the first three dimensions now explain close to 85% of the total variance (Table 7). The first dimension (axis I) indicates a difference between components such as the stream channel deposits and upper fluvial terraces, with footslopes, denudational slopes and hills, and summit surfaces; the second dimension (axis II) explains the variance between minor stream channel and lower fluvial terraces, with denudational slopes and hills, and summit surfaces (Fig. 6).

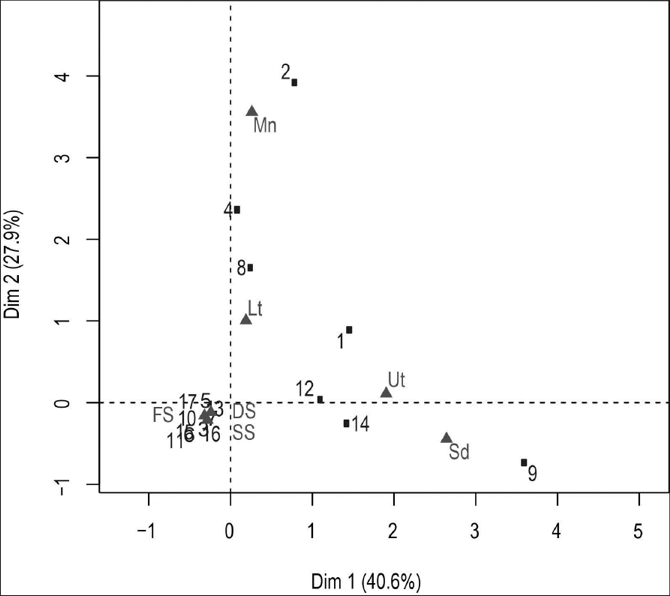
Figure 6 Second Correspondence Analysis (CA) axes 1 and 2 displayed (Dim1 and Dim2). Input data are from table 4. Key (numbers): 1: barnyards; 2: swimming area (river); 3: brick production; 4: building material; 5: grazing, wood and fuel extraction and game hunting; 6: localized irrigation; 7: localized irrigation, barnyards, brick production and residential activities; 8: localized irrigation and grazing; 9: localized irrigation, and tourism; 10: mixed irrigation system and barnyards; 11: mixed irrigation system and grazing; 12: rain-fed agriculture; 13: rain-fed agriculture, barnyards, brick production and residential activities; 14: rain-fed agriculture and grazing; 15: rain-fed agriculture, grazing and tourism; 16: rain-fed agriculture and tourism; 17: wood and fuel extraction and game hunting. Key (letters): see table 8 below.
Table 8 Correlation values from the second CA. Key: Dim: dimension; ctr: contribution; cos2: square cosine

Stream channel deposits are strongly correlated to localized irrigation, grazing and tourism; while the upper fluvial terraces are correlated to rain-fed agriculture and grazing (Table 8).The lower fluvial terraces associate with extraction of building material, localized irrigation, and grazing. The footslopes, denudational slopes and hills, and summit surfaces show a complex pattern of activities strongly associated with grazing, wood and fuel extraction and game hunting. These activities are consistently distributed outside the valley bottom.
The third dimension (16.3%) (Fig. 7) explains the variance within the valley components, specifically between the upper and lower terraces and the minor and main stream channel deposits. Productive activities such as localized irrigation, grazing or barnyard systems can be found in terraces whilst recreation and touristic activities are associated with minor and main stream channel deposits.
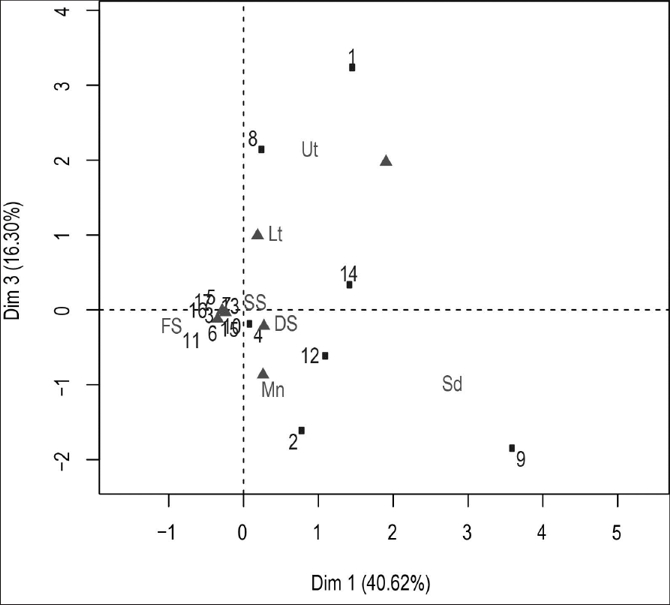
Figure 7 Second Correspondence Analysis (CA) of axes 1 and 3 displayed (Dim1 and Dim3).Input data are from table 4. Key (numbers): 1: barnyards; 2: swimming area (river); 3: brick production; 4: building material; 5: grazing, wood and fuel extraction and game hunting; 6: localized irrigation; 7: localized irrigation, barnyards, brick production and residential activities; 8: localized irrigation and grazing; 9: localized irrigation, and tourism; 10: mixed irrigation system and barnyards; 11: mixed irrigation system and grazing; 12: rain-fed agriculture; 13: rain-fed agriculture, barnyards, brick production and residential activities; 14: rain-fed agriculture and grazing; 15: rain-fed agriculture, grazing and tourism; 16: rain-fed agriculture and tourism; 17: wood and fuel extraction and game hunting. Key (letters): see table 8 above.
Discussion
The analysis has indicated a significant correspondence between geomorphic and land use patterns. There was a lack of correlation between land uses in the fluvial landforms at the valley bottom, and the denudational landforms. Within fluvial elements in the valley, the minor stream channel was significantly different from the lower fluvial terrace and the other fluvial entities. This suggests that the activities were well differentiated in terms of their correlation with the valley entities.
The distribution of land uses as related to landforms showed both simple and complex results. Land uses associated with fluvial landforms depicted rather simple associations. The upper fluvial terraces and stream channel deposits, for example, are clearly linked with agricultural practices (Kariya et al., 2005; Akça et al., 2008; Romic et al., 2012). This is due to the presence of relatively good quality, fertile soils with an adequate moisture regime. Lower fluvial terraces, on the other hand, were associated with material extraction because of the abundance of gravel and coarse sands in these locations along with an acceptable accessibility. In fact, this activity may be causing channel degradation and diversions, bank erosion, increased sediment loads, and new patterns of deposition (Erskine, 1990; Gaillot and Piégay, 1999). A more complex pattern of land use distribution occurred on denudational slopes and hills, and footslopes, which are difficult-to-access landforms covered by tropical dry forest and scrubland. Despite accessibility problems, land use patterns on steep lands are highly diverse and encompass rain-fed agriculture and grazing. In this case, adaptative, cultural and historical strategies rather than only land qualities (Hudson, 2004) seem to better explain land use occupation. Agricultural activities are being and have been developed over the area in both steep and gentle landforms for decades, as reported long time ago by cultural geographic surveys (Sauer, 1941).
In tropical regions, land use and land management are complex and so is their relationship with terrain itself. Remotely sensed land cover data is a good departing point to approach land use distribution, but it is not sufficient to fully understand the nature and dynamics of these human practices, particularly not in tropical rural mosaics. For example, non-timber forest management activities, such as game hunting and fuel extraction, seem to have promoted conservation of the tropical dry forest, but this observation needs further research. Quantitative analyses are useful to describe patterns while qualitative analyses derived from participatory field research are crucial to understand patterns. In this sense, CA yield best results when coupled to additional evaluations.
Conclusions
Correspondence analysis proved to be an effective tool to identify the spatial correlation of land use and landform entities. Through CA, the results of simple GIS map overlaying are further exploited to reach more robust outcomes. The complexity of land use and landform patterns is thus better described. Though this approach was tested at the local scale, this method could be also be applied, by providing properly gathered data, at a regional level. The classification schemes are as relevant as data analyses; field work, especially using a participatory perspective proved crucial. The results can be easily transferred to local decision-makers and rural producers; they are understandable, and refer to entities and relationships recognized by all stakeholders. In addition, this exercise allowed, with limited effort, the fast mapping of flooding prone areas based on land use and terrain delineations (Segundo-Métay and Bocco, 2015).
This approach could be effective for achieving sound rural land use planning in developing countries. The method is relatively simple and the participation of local producers in the definition of map units is insured. The spatial arrangement of human activities, that would otherwise remain invisible with mere remote sensing and a GIS-based approach, is cleared out.
Several limitations of this study may be considered for future research on the relationships between landforms and land use particularly in tropical dry regions. First, the boundaries of land use polygons may be transition zones which are not adequately represented by segments. A fuzzy classification (Gurnell et al., 1996; Thapa and Murayama, 2009; Da Silva et al., 2015) or a multi-point-and-attribute data structure (Huck et al., 2014) may help deal with this problem. A pixel-based classification instead of a vector data structure could also help this kind of analysis. Second, a historical appraisal of land use development over time would shed light on the analysis of the correlation with landforms (Briggs et al., 2006; Neil et al., 2014). This would provide more explanatory rather than exploratory results as was the case in our study.

