


 nueva página del texto (beta)
 Inglés (pdf)
 Artículo en XML
 Referencias del artículo
 Enviar artículo por email
 Citado por SciELO
  Similares en
SciELO
Similares en
SciELO 
 Permalink
INTRODUCTION
Satellite imagery allows an efficient coverage of large areas, with easy integration of these remotely sensed data into geographic information systems (Wulder, 1998), however, this is not the only way to survey extensive zones. In the last two decades, small-format high-resolution imagery has been used also for large-area coverage in an efficient and cost-effective manner, surveying areas ranging from 1 200 to 2 200 km2 with the main purpose of assessing natural resources (Prado et al., 2006). In general, high-resolution imagery is suitable for many applications, although in some cases the large number of images to be processed could be a disadvantage, because a larger number of lines should be handled to generate an orthomosaic. Nevertheless, with higher spatial and temporal scales, the structure, diversity and function of an ecosystem can be better characterized (Wulder et al., 2004), it is also useful in validation of land-cover maps and the interpretation of satellite data (Mas et al., 2002; Wulder et al., 2007). High-resolution imagery is particularly important in classification and assessment of changes in forest canopy density, and is a key indicator of possibly illegal logging (Azizi et al., 2008), individual tree classification, estimation of species composition, and biophysical parameters of vegetation (Gougeon and Leckie, 2006; Pouliot and King, 2005; Wulder, 1998; Schlerf et al., 2005). Imagery with 1 m resolution is optimal for individual tree categorization; however, greater scales provide direct identification of species, and additionally, inclusion of texture analysis increases the accuracy of classification (Sugumaran et al., 2003; Gougeon, 1995; Laliberte and Rango, 2009; Levesque and King, 2003).
In recent years, new platforms and new systems, aerial and space based, have achieved greater spectral and spatial resolutions; even so, use of manned aircraft for aerial photography is highly flexible, with its option of stereo-pairs acquisition and its ability to establish all surveying parameters, such as pixel size on the ground, overlap, etc. (Booth and Tuller, 2003; Prado et al., 2006). Automated methods to assess forest canopy density have been developed, in most cases related to volume estimations, tree detection and counting, etc. These methods has improved on traditional expensive and time-consuming photointerpretation techniques (Leckie and Gillis, 1995), however, when no automated process or high-resolution satellite imagery is available, traditional photinterpretation methods remain an option. High-resolution and stereo-pairs availability are key factors to perform this task, however, orthomosaic generation is very useful in the assessment of changes in forest, and comparison of multi-temporal imagery gives a long-term view of the vegetation status and health (Sheng et al., 2003; Tanaka and Nakashizuka, 1997; Key et al., 2001; Rango et al., 2008). From 1997 onwards, these photographs have been readily available in our University (Peralta et al., 2001) and very soon they demonstrated their value for studies mainly related with natural resources assessment (Prado and Peralta, 2005). Traditional photointerpretation was performed in biennial periods, combined with particularly adapted digital photogrammetric techniques.
The metric used in this paper to monitor changes in forest cover is forest canopy density (FCD), defined as the proportion of the forest floor covered by the vertical projection of the tree crowns (Jennings et al., 1999) or the ratio of vegetation to ground as seen from the air (ESRI, 2014). Estimation of FCD has become an important parameter in forest inventories and aerial photography and satellite imagery have proved effectively its suitability for automatic mapping at regional scales employing different indexes, including temperature, shadow, evapotranspiration and other parameters (Mon et al., 2012). Other automated methods using multispectral images have been developed using the indexes: Advanced vegetation (AVI), bare soil (BI), shadow (SI), and thermal (TI) obtained from Lansat-5 Thematic Mapper (TM) which have been employed to obtain an estimation of FCD in a deductive approach (Rikimaru, 1996). Some other methods include neural networks and fuzzy logic in this assessment, as a continuous variable from the seven bands of Landsat-7 Enhanced Thematic Mapper Plus (ETM+) (Gopal and Woodcock, 1996; Boyd et al., 2002). Regression techniques have been used also to model the relationship between spectral response and canopy closure in conifer forest (Iverson et al, 1989). One example of comparison of methods predicted forest canopy density from a Landsat-7 ETM+ image by means of artificial neural networks, multiple linear regression, the forest canopy density mapper, and a maximum likelihood classification method; in this case, the regression model performed significantly worse than the others (Joshi et al., 2006). These examples illustrate the efforts of groups around the world to assess changes in canopy density. Most of these approaches employ multispectral satellite imagery, and the overall accuracy in estimation of forest canopy density is 84-92%.
The objective of this paper is to describe a method of assessing changes in forest canopy density in a temperate zone using orthomosaics as base maps, constructed from high-resolution small-format photographs.
MATERIALS AND METHODS
Study area: The Monarch Butterfly Biosphere Reserve (MBBR)
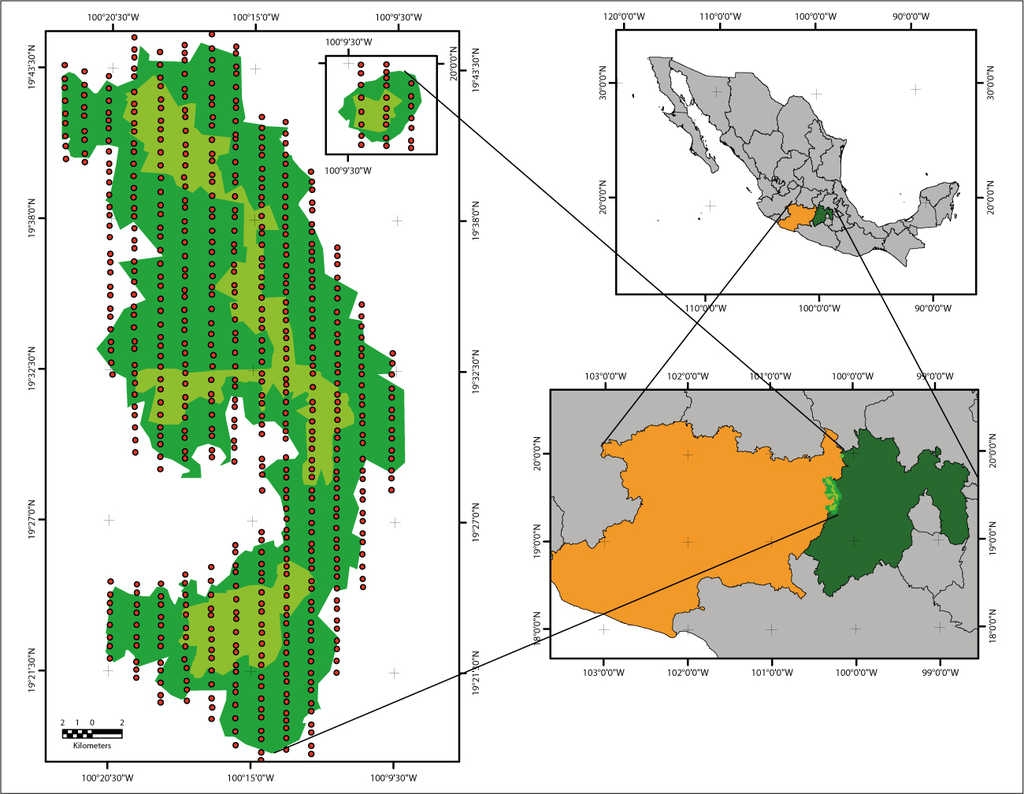
The MBBR is in the Neovolcanic-belt mountain range of Mexico, where temperate forest occupies 56 259 ha within the states of Mexico and Michoacan (Figure 1). This is an ecologically important zone, because of the environmental services it provides, and also because it is where the Monarch Butterfly (Danausplexippus, L.) hibernates. Every year in October and November, Monarch Butterflies migrate to Mexico from the Big Lakes and the Canadian Rockies, and the eastern USA (Calvert and Brower, 1986). The main vegetation types in the Reserve are coniferous forest (including combinations of fir, pine, and oak forests), anthropogenic grassland, and Quercus forest. Forest species include Abies religiosa, Pinuspseudostrobus, P montezumae, P oocarpa, P michoacana, and Quercus leiophylla, Q. laurina, Q. obtusata, and Q. rugosa.
How was established the MBBR?
In 1999, the first aerial survey of the zone was carried-out using small-format digital cameras to establish the preservation status of the vegetation, mainly from a qualitative point of view. These photographs served to generate a semi-controlled mosaic; in this case digital images were not orthorectified, but were spatially arranged over a digital base map using only ground control. This type of mosaic uses tie and control points but does not employ a digital elevation model to adjust the scale; hence, there is control only in the X, Y plane (Wolf and Dewitt, 2000). Once the first semi-controlled mosaic had been generated, it was entered into a GIS to observe the characteristics of the zone: forest status, human settlements, and agriculture or sheepherding areas. This study was used in combination with other parameters such as historic hibernation sites of the butterflies, topography, and altitude; altitude was determined by crossing the mosaic with a DEM. This combination allowed the definition of a new Reserve (Brower et al., 2002). Altitude is very important, because some other parameters such as temperature, humidity, precipitation, and evapotranspiration are linked to it. Multidisciplinary work and discussions with local communities resulted in the natural protected area that the Monarch Butterfly inhabits, and in this manner the zone was expanded from 16 100 to 56 259 ha by 2000. To ensure their protection, a presidential decree designated the Monarch Butterfly Biosphere Reserve, whose surface was divided into 13 580 ha of core zone and 42 679 ha of buffer zone (DOF, 2000). The MBBR consists of 93 properties: 59 ejidos (a class of communal land), 13 indigenous communities and 21 small properties. In the main area, the core zone, where most of the butterfly colonies have been reported in recent years, 21 properties are ejidos, 7 indigenous communities and 3 small properties (SEMARNAT, 2001). In recent decades, the MBBR has been affected by illegal logging; this has created the need to establish measures to reduce its impact, through the setting up of an economic support program by the Mexican Fund for the Conservation of Nature (FMCN, 2000). This program is directed at encouraging the concessionaires and land owners to avoid wood extraction and turn to conservation work. The method presented in this paper was applied to assess changes in land use, but above all to quantify variations in the forest canopy density. This information has been used to establish the appropriate payment for environmental services in the MBBR (Honey et al., 2009; López, 2009).
Small-format digital photography
Because of its low cost, its high spatial and temporal resolution, and the possibility for stereoscopic viewing, small format digital photography was selected to assess the changes in the forest canopy density of the MBBR. The average cost of each flight campaign, mosaic generation, and interpretation was 20 000 USD. In comparison, images covering the same 550 km2 by Ikonos(tm) satellite, for instance, would cost 49 000 USD (2012 cost) with a resolution of 3.2 m, and without the availability of stereo pairs. Aerial surveys used off-the-shelf professional cameras (Table 1), employing different resolutions along time in response to technological improvements (Figure 2). Unfortunately, in 2000, 2002, 2004, and 2007 aerial surveys were attempted without success, owing to air traffic issues or adverse weather conditions.
Table 1 Small-format cameras used on diferent aerial surveys and their spatial resolution. The approximate coverage was 1 770 x 1 140km on each image.
| Camera | Lens | Year | No. of M pixels | Pixel size on the ground (m) |
|---|---|---|---|---|
| Kodak DCS 420 | Sigma 14 mm F 2.8 | 1999 | 1.54 | 1.12 |
| Nikon D1 | Nikkor 17-35 mm F 2.8 | 2001 | 2.66 | 0.85 |
| Nikon D1X | Nikkor 17-35 mm F 2.8 | 2003 | 6.00 | 0.60 |
| Kodak DCS l4n Pro | Nikkor 35 mm F 2.8 | 2005 | 12.21 | 0.40 |
| Nikon D2X | Nikkor 24 mm F 2.8 | 2006 | 12.40 | 0.40 |
| Nikon D2X | Zeiss ZF 25 mm F 1.4 | 2008 | 12.40 | 0.40 |
| Canon EOS IDS Mark II | Canon 35 mm F 1.4 "L" | 2009 | 16.61 | 0.30 |
| Nikon D3X | Nikkor 35 mm F 2.8 | 2010 | 24.40 | 0.30 |
| Nikon D3X | Nikkor 35 mm F 2.8 | 2011 | 24.40 | 0.30 |
| SPOT-5 image has a coverage of 60 x 60 km, with three multispectral bands: B1 (0.50-0.59 μm), B2 (0.61-0.68 μm), and B3 (0.79-0.89 μm) with 10m resolution, and also has a panchromatic band in the range of (0.51 - 0.73 μm) with 2.5 m resolution. |
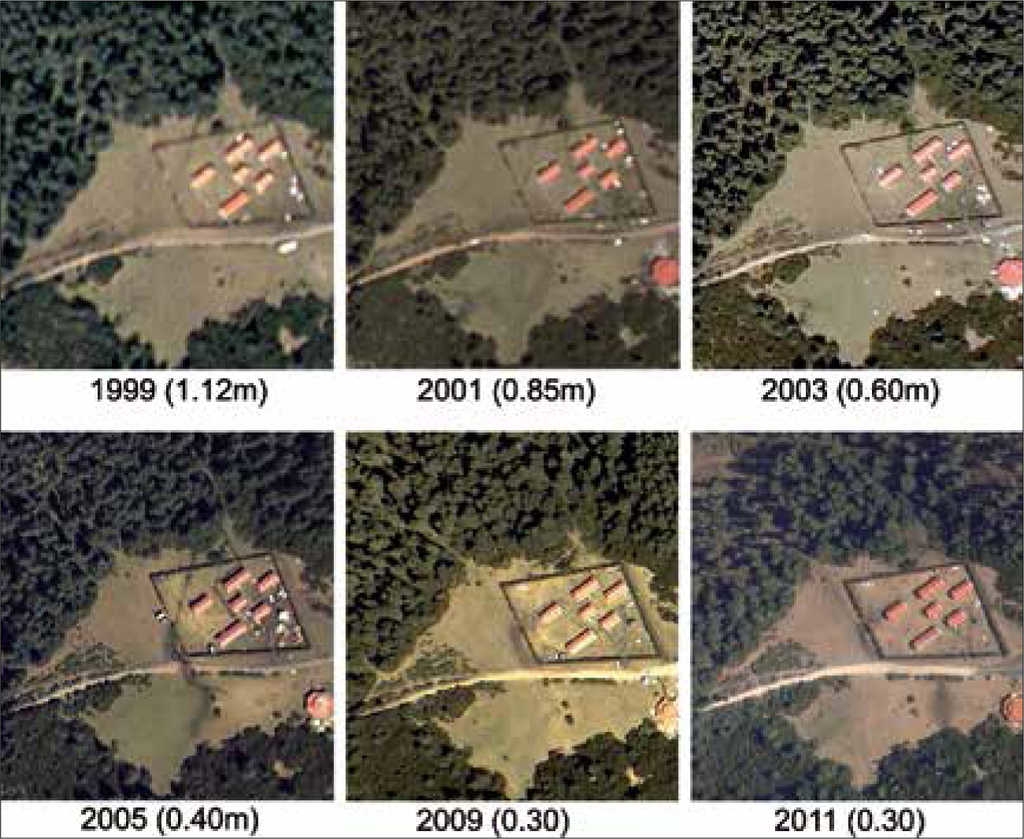
Figure 2 Evolution of image quality with time, mainly regarding pixel size, starting with 1.2 m/pixel in 1999 imagery, and ending with 0.30 m/pixel in 2011.
Contrast, brightness, and color balance of the photographs were improved through histogram manipulation, and no particular adjustment curve was used; these processes were carried-out by "eye", ensuring that in every adjustment the characteristics of the vegetation were highlighted, particularly contrasting trees against the soil. Gradient function was applied to reduce differences in illumination due to unavoidable delays between flight paths during the aerial survey. With these procedures, images with better characteristics for a more accurate photointerpretation were obtained (Figure 3).
Aerophotographic survey planning
Annual aerial surveys were conducted in selected years from 1999 to 2011, always in February and March; for the core zone, this yielded on average 210 color digital photographs, with a pixel size ranging between 1.12 and 0.30 m (Table 1). The same flight plan was used on every campaign, overflying the same 11 lines and applying the same conventional technique as in photogrammetric imagery for mosaic generation and stereo viewing, thereby guaranteeing an overlap of 30% laterally and 65% longitudinally. Cameras were mounted in a Cessna 206T aircraft adapted for photographic work. Flights were made at 5 332 m a.s.l. (17 500 feet) at a speed of 80 knots, covering a surface of ~550 km2 on each campaign. The image acquisition system in its minimum configuration consists of one color and one IR small-format cameras, a laptop computer, a hand-held GPS receiver, and an intervalometer as triggering device for the cameras. At the beginning of the flight campaign both cameras and the GPS receiver are set at the same time. GPS receives data every second, and after the flight a software routine reads the time of acquisition of each image and then finds the corresponding coordinates (i.e. latitude, longitude, and altitude) that best match this time. In this way, each image is assigned a corresponding set of coordinates, thereby obtaining the first approach to a ground reference. Software developed in-house supports flight plan generation, as well as image acquisition and storage (Prado et al, 2006).
Orthorectified mosaics
Four orthorectified mosaics were generated to quantify changes in forest canopy density in the core zone of the MBBR. With these maps, measurements were made to establish changes between two or more years. For their construction some standard photogrammetric methods were adapted: camera calibration, mosaic generation, and polygons of changes transferred from the acetate sheets to the orthomosaic (Prado et al., 2003; Ramírez, 2010). Each image was orthorectified with consideration of traditional parameters, elements of internal and external orientation (there was an exception explained later), a digital elevation model, and at least nine control points on the ground. Distortions in the photographs were corrected by considering radially symmetrical distortions caused by the lens, deviation of the central point, and calibrated focal distance of the lens, distortions caused by aircraft movements (roll, pitch and yaw), and distortions attributed to relief displacements. In order to obtain internal orientation elements, a calibration procedure for the camera was implemented (Prado et al., 2003).
Regarding the elements of exterior orientation, the geographic position of the center of every photograph was acquired through a hand-held GPS receiver, assigning a coordinate to the central point of each image and thereby obtaining an initial georeference for the incoming map. Deviation angles of each image (omega, phi, and kappa) during flight were not obtained; instead, at least nine ground-control points per image were employed to carry out the resection process, using ERDAS IMAGINE(tm) ver. 8.4 software. At the beginning of this process, omega, phi, and kappa angles were all declared null. No ground-control points were collected in the field; they were obtained from 14 orthoimages with 2 m pixel size, all of them belonging to the year 1994, supplied by the National Institute of Statistics, Geography and Informatics, and not employed in any other part of the study (INEGI, 1994). Mosaicking was followed by automatic tie-point generation, and this process was completed with a digital terrain model with level curves spaced every 20 m according to typical aerotriangulation and orthorectification procedures (Ramirez, 2010).
METHOD TO ASSESS CHANGES IN FOREST CANOPY DENSITY
This procedure was developed and adapted over time, evolving mainly in accordance with the particularities of the zone, and on-the-ground resolution of the imagery, becoming an almost unequivocal separation into density categories. This statement is demonstrated in the error matrix, and it is related with the high capacity of interpreters to classify density classes, reaching 95.29%. Key factors were a periodical analysis of changes and an extensive knowledge of the zone on the part of the photointerpreters.
Use of a minimum mappable area of 400 m2 was in accordance with the scale of the work, and also with the delimitations of areas of change at an average scale of 1:5000, the maximum scale at which interpretation on the screen of a PC was validated as a part of the transfer process; this is explained later. After map comparisons, any resultant polygons of less than 400 m2 were not considered separately but were integrated into the nearest polygon.
Aerial images were prepared for photointerpretation starting with aerial digital imagery printed on paper, using in most cases an approximate scale of 1:10 000. With the support of the flight index, photographs were sorted by line, selecting those that were included within the core zone of the MBBR. A transparent acetate sheet was placed in front of the photograph. Pictures were interpreted by traditional means, previously establishing the principal point of each picture and delineating the photointerpretable areas.
Baseline orthorectified mosaics
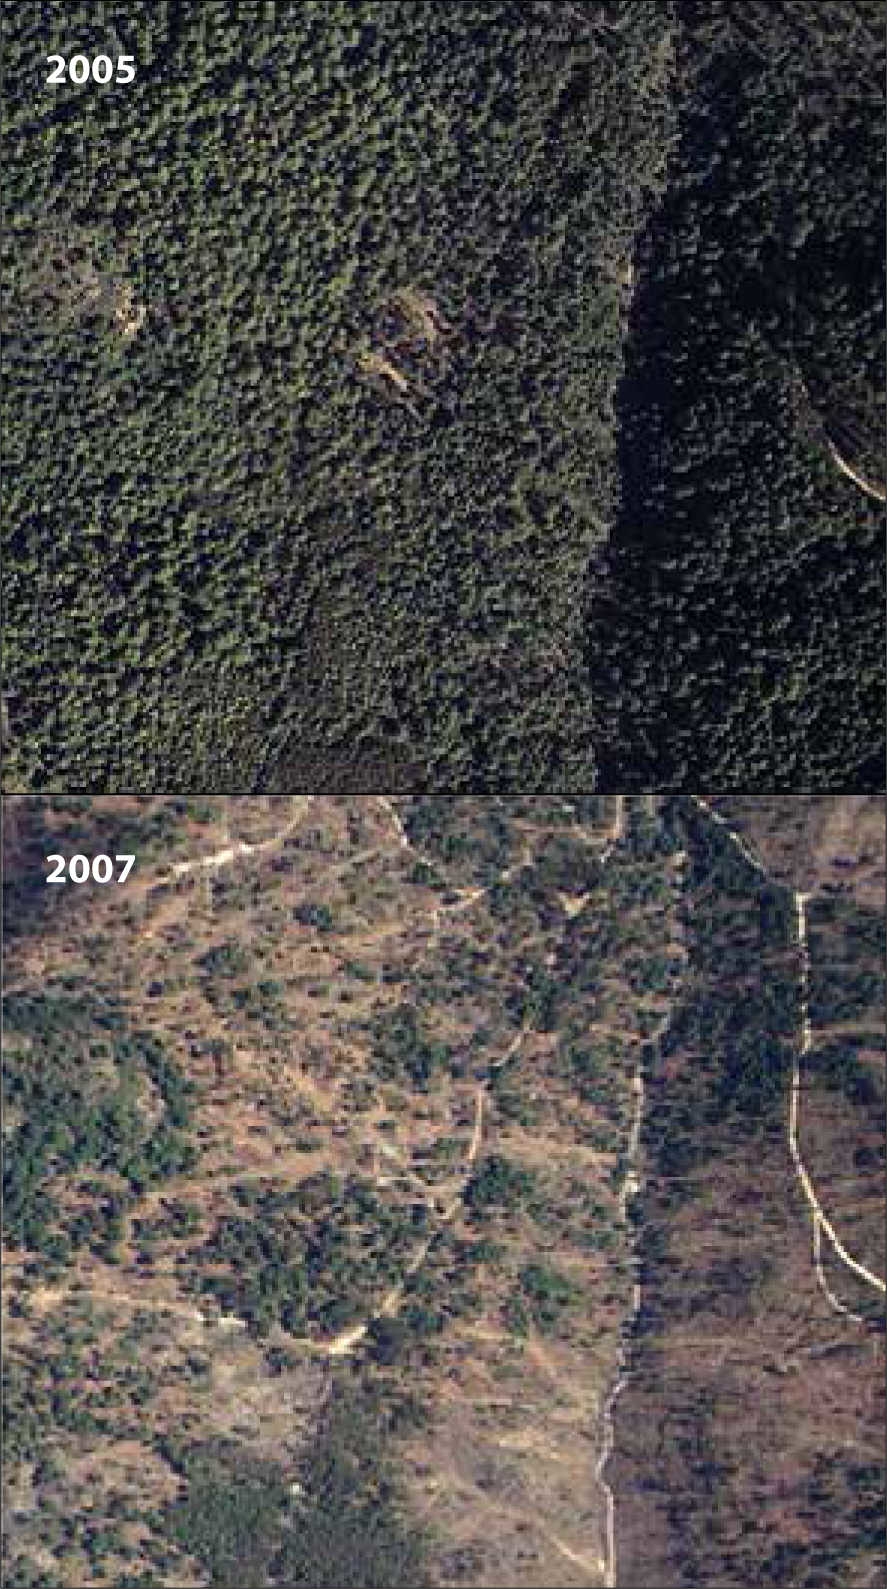
The 2003 orthomosaic, with a rms error of 7 m and a pixel resolution of 1 m, was used to evaluate the results of the photointerpretation, and also served as a qualitative reference to establish the status of the forest canopy density along time. Subsequent biennial evaluations employed this method until 2006, when a new mosaic was generated although the mode of working remained unchanged. In 2009 and 2010, new orthomosaics were created. Mosaic generation was not possible for each epoch, because no photographs were available. Comparative photointerpretation was carried out in the years 2003-2005, 2006-2007 (with SPOT-5 image), 2006-2008, 2008-2009, 2009-2010, and 2010-2011. For comparative photointerpretation, and owing to unavailability of high-resolution photographs, in 2007 an SPOT-5 satellite image was used with a scene covering 60x60 km with 10 m resolution on multispectral and 2.5 m on panchromatic. In 2008, interpretation again used high-resolution photography, which revealed some discrepancies for the period 2006-2007, and indicated that high-resolution imagery achieves a better classification of forest canopy density.
Comparative photointerpretation
The FCD was classified into five categories that were interpreted over the central part of the photograph (Figure 4); these five categories were based on the proportion of the forest floor covered by the vertical projection of the tree crowns observed in the stereoscopic model, so that photointerpreters were taking into account dominant canopy layer and also including understory. The categories were as follows: 1, closed > 75%; 2, semi-closed 51-75%; 3, semi-open 26-50%; 4, open 10-25%; 5, deforested < 10%. The closed class was formed by trees whose crowns were touching (UNESCO, 1973), and which could also be in a good state of conservation. Deforested for class use the criterion of FAO (FAO, 2010). The variation reflected in the classification could be associated with a process of degradation (López, 2011; Manzo, 2013).
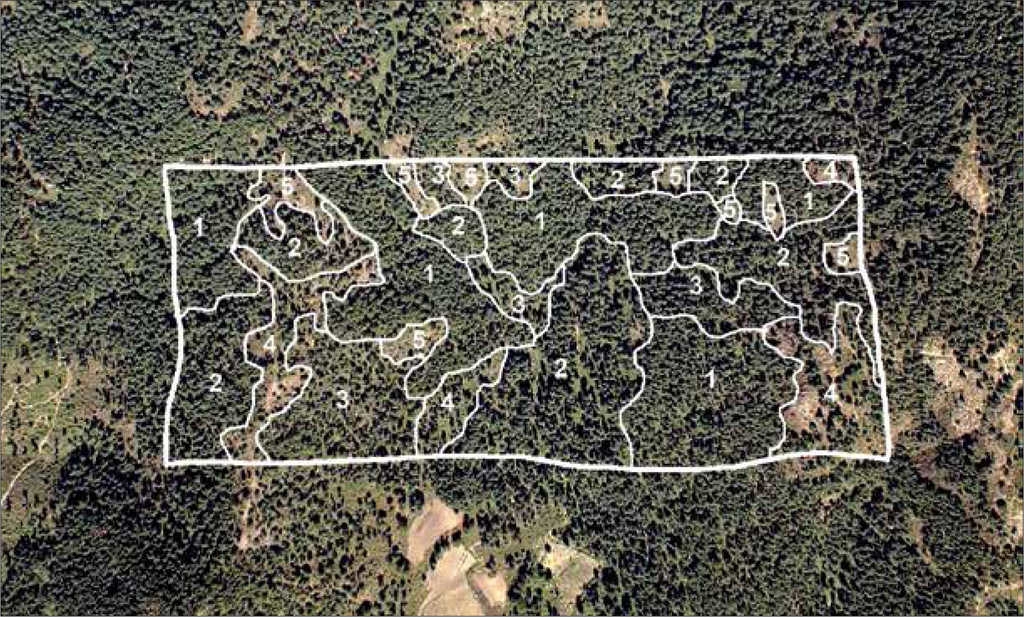
Figure 4 The central part of the image is the photointerpretable area, separating densities of forest cover: 1 closed, 2 semi-closed, 3 semi-open, 4 open and 5 deforested.
Since each aerial survey followed the same flight lines, area coverage was similar throughout. The area on every photograph was approximately 1 770 x 1 140 km, and the central point of each image was close to its predecessor in a previous year. This aided comparative interpretation, consisting in the construction of a stereoscopic pair with images of the same area in different years, and having the parallax condition that is indispensable for stereoscopic observation. This procedure detected any areas with changes in forest canopy density, so that they could be defined in detail over the picture and assigned the corresponding degree of change, thereby creating a polygon of changes. The procedure was carried out every two years in accordance with image availability.
Transferring polygons by radial triangulation
This is the process of transferring photointerpreted polygons into a base map, passing from a central projection of the picture to an orthogonal one. It uses the property of aerial vertical pictures, where the measured angles centered at the nadir point in the picture and in the field are identical (Pandey, 2007; Wolf and Dewitt, 2000). It is also based on the location of vertices of triangles in the aerial digital photographs and the same points in the photomosaic. This operation was supported by converting the polygons to a digital format, conveying the photointerpreted areas from the acetate sheets to the orthomosaic by the use of three control points (for instance, points a, b, c in Figure 5), and the principle of radial triangulation, adjusting then the scale and correcting deformations caused by relief. In this manner, transferred polygons maintain their accuracy. After that, the mouse cursor is used to digitize the polygons in a new layer (red polygons depicted in Figure 5), and a new polygon is transferred, for instance, using points a, b, f. These new polygons (i.e. polygons of change) are employed to quantify the areas where changes have occurred. These transferred polygons will be used in the next year's photointerpretation process, thereby reducing the possibility of carrying errors. Should errors be detected in a given year, these can be fixed, and potential subsequent errors will be automatically corrected. A 1:5000 working scale was employed over the digital base map, averaging the scale for each picture. Thus, information contained in each triangle is transferred with the correction of deformations and scale differences on the polygons through its unification inside the orthomosaic. In this way, georeferencing and orthocorrection of images throughout the zone is completed. An example of this procedure is a comparison between the baseline orthomosaic of 2003 and images corresponding to 2005 (Figure 5), which reveals differences in forest canopy density. This period was selected arbitrarily for demonstrative purposes.
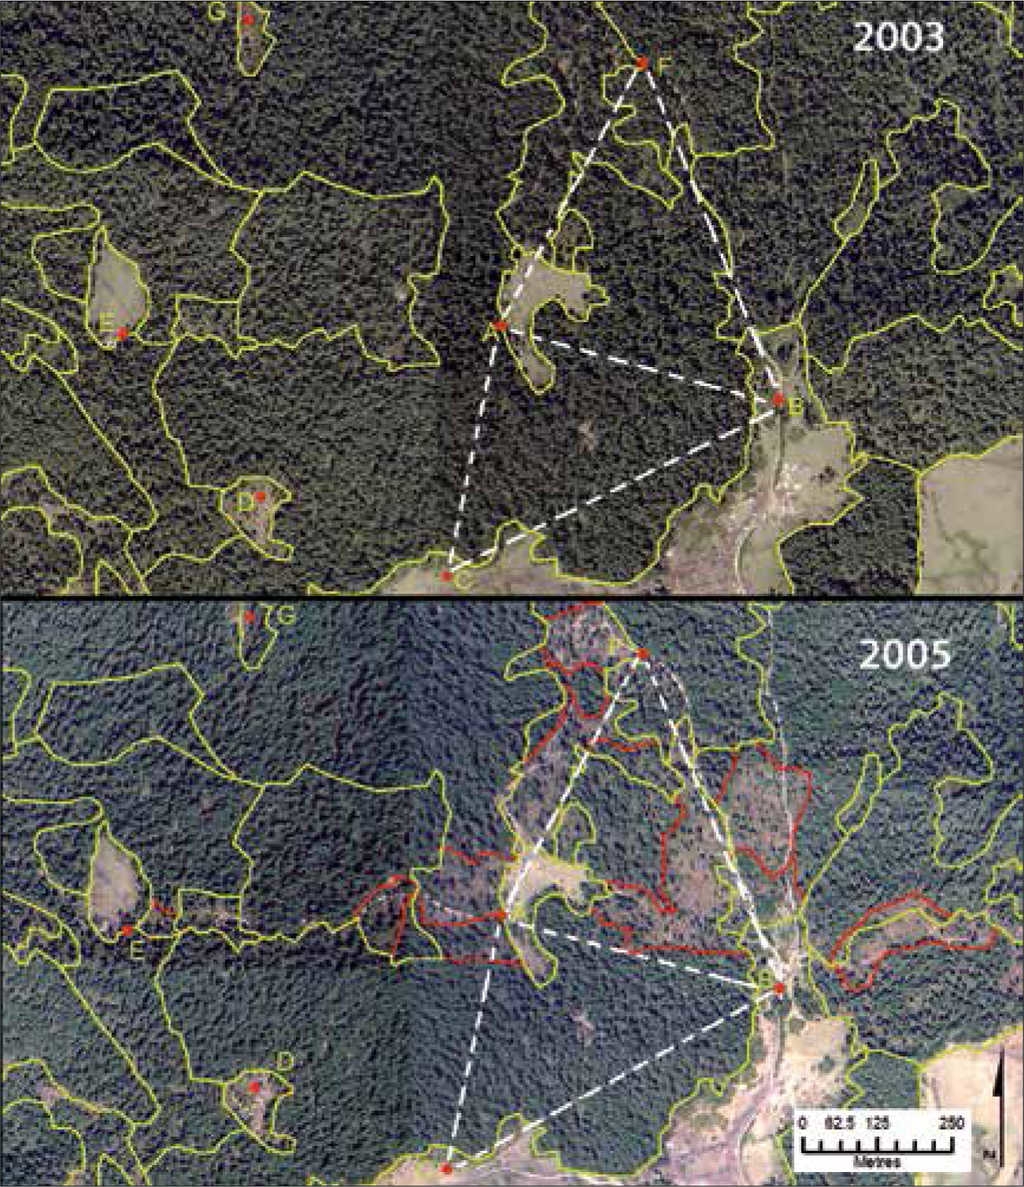
Figure 5 Changes in forest canopy density monitored by comparison of photographs of 2003 with the 2005 orthorectiied mosaic.
A comparison of polygons where changes have occurred can be expressed in a map of changes (Figure 6). The information is exported to a Microsoft Excel(tm) database, in which a dynamic table can be created to analyze the data and generate matrices of changes.

ERROR ANALYSIS
For many years it was assumed that photointerpretation was very accurate; however, an intrinsic non-objective bias is introduced by the photointerpreter, and an error is always present (Congalton, 1991). The method employed here to assess changes in forest canopy density has shortcomings due to its qualitative character, since the density classes make it only partially reliable; however, the aim of this project in the MBBR is not to perform exhaustive and accurate assessments; it is to assist conservation. Hence, an assessment of its overall accuracy is sufficient to indicate whether the method can be useful in future studies in the same area (i.e. buffer zone of the MBBR). In the photointerpretation process, polygons of changes were generated and the five levels of forest canopy density were assigned, and with this information an error matrix was created (Table 2).
Table 2 Error matrix of sample counts of the diferent intervals of classes. Map categories are in the rows while the reference categories are the columns. Wi are the percentages of the areas of map categories.
| Canopy changes | (ha) | |
|---|---|---|
| Forest Degradation | Closed to Semiclosed | 62 |
| Closed to Semiopen | 69 | |
| Closed to Open | 32 | |
| Semiclosed to Semiopen | 39 | |
| Semiclosed to Open | 23 | |
| Semiopen to Open | 23 | |
| Deforestation | Closed to Deforested | 43 |
| Semiclosed to Deforested | 19 | |
| Semiopen to Deforested | 62 | |
| Open to Deforested | 94 | |
| Total | 466 | |
Field sampling
This important part of the assessment process used a stratified random sampling scheme in which all density classes are represented (Congalton, 1988; Banko, 1998). In designing this scheme, 110 points within the Reserve were selected to ensure a balance between assessing objectives, economic resources, and statistically representative analysis. Over a circular area of 1 000 m2 around each sample point, a record was compiled of the number of trees, their heights and diameters, and their condition (healthy, unhealthy); these data were then extrapolated to 1 ha, which is the unit area handled in the project. Field work was carried out over the past five years. There were not enough personnel or resources for this to be performed in a single year, but each sample was matched with the year that the polygon was generated; this avoided significant differences between the dates of photointerpretation and of field condition. In the field sampling scheme, four sites were located in the edges of the units and then changed to a different place, trying to maintain a balance in the number of samples per unit. Mapped areas were adjusted to eliminate bias attributed to map classification errors. Area proportions of the map categories (Wi) were incorporated to account for different sampling intensities in different strata (Olofson et al., 2013).
The high overall accuracy obtained in this part of the process (i.e. 95.29%) is due to experienced photointerpreters who gave this confidence level (Table 3); however, the different categories have the next distribution. The number of trees per hectare (trees ha-1) within each category was compared with forest canopy densities, and their corresponding average densities were established as follows: 600 ± 75 closed, 375 ± 42 semi-closed, 190 ± 23 semi open, 98 ± 12 open, and < 70 (trees ha-1) deforested. With the number of trees per ha established in the sampling process, an average of extracted trees in the Reserve can be calculated; however, with the density classes handled this result is difficult to validate. These are partial results, and an extended assessment is being performed with an increase in the number of samples to 245; with this new field work it is hoped to achieve a better estimation of the photointerpreter's accuracy in density classification, and also in the quantification of trees per ha. With better field work the photointerpreter's accuracy in density classification will be improved; however, to increase overall accuracy is mandatory to redefine the density classes in order to reduce the range of percentages within each class.
Table 3 Estimated error matrix obtained from table 3 including estimated proportions of area. Accuracy measures have a 95% conidence interval.
| Class | Closed | Semi-closed | Semi- open | Open | Deforested | Total | Map Area ha | Wi |
|---|---|---|---|---|---|---|---|---|
| Closed | 20 | 1 | 0 | 0 | 0 | 21 | 7383 | 0.5665 |
| Semi-closed | 1 | 21 | 0 | 0 | 0 | 22 | 1919 | 0.1472 |
| Semi- open | 0 | 1 | 23 | 0 | 0 | 24 | 1665 | 0.1277 |
| Open | 0 | 0 | 1 | 22 | 0 | 23 | 713 | 0.0547 |
| Deforested | 0 | 0 | 0 | 1 | 19 | 20 | 1351 | 0.1036 |
| total | 21 | 23 | 24 | 23 | 19 | 110 | 13031 | 1 |
RESULTS AND DISCUSSION
Comparative analysis
The map of forest canopy density in 2003 served as the first baseline for comparative analysis, and one of the first analyses compared this 2003 orthomosaic with 1999. The main changes in the core zone between 2003 and 2005 were in the Federal property (201) in the northern part of the Reserve, and in the indigenous communities Crescencio Morales (504) in the middle, and Nicolas Romero (519) in the southern part. Successive changes were determined from the maps of vegetation coverage until 2005. To assess the changes during 20052007, it was necessary to use a SPOT5 satellite image, resampled to a spatial resolution of 3 m per pixel. For 2007-2009 the SPOT5 image was again used to make the comparison, but the results of the photointerpretation were not reliable. Instead, the photogrammetric analysis compared 2005 and 2009 using small-format photography. From 1999 to 2011, high-resolution images were compared in order to obtain a historic evolution of the zone, and this gave a long-term panorama of the forest canopy density in this important area.
The changes during each biennial interval were expressed in Figure 6, and changes during the 12 years from 1999 to 2011 are shown in Figure 7. The long-term data are valuable for registering changes, losses, and even recoveries, and hence for giving a more accurate perspective of the processes involved in the zone; illegal or authorized logging, reforestation programs, and natural changes, are all easily seen from the map.
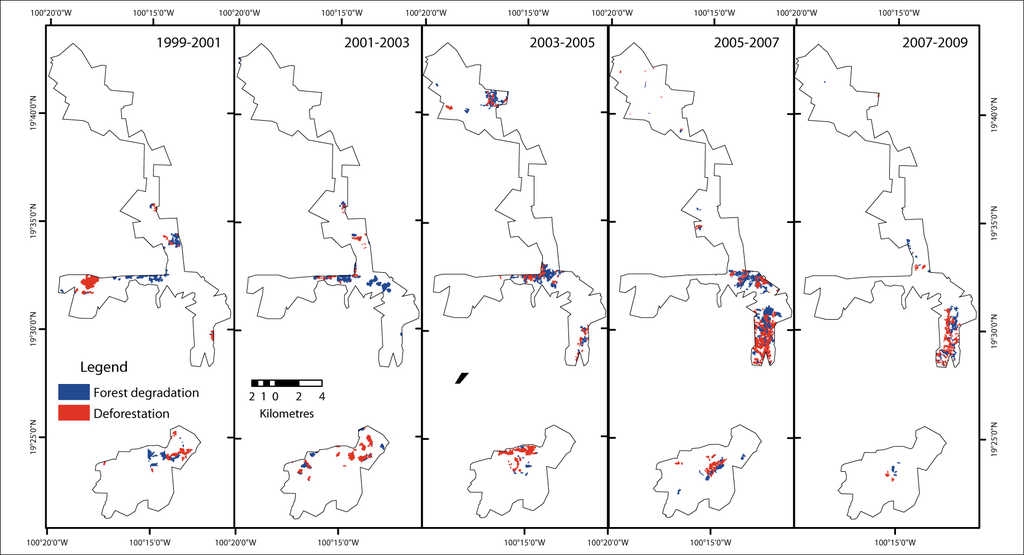
The most important changes regarding degradation, and deforestation in the core zone had occurred as follows (see Figure 7): Federal property with 75 ha in the north; in the ejidos La Mesa (309) with 129 ha, Francisco Serrato with 109 ha, and Crescencio Morales with 982 ha) all in the middle of the zone; and in an indigenous community Nicolás Romero, with 264 ha, and the ejido Nicolás Romero, with 82 ha in the southern part.
The changes in the core zone of the MBBR from 1999 to 2011 involved 3081 ha (Table 4). The cells in the upper part of the diagonal indicate forest degradation meanwhile cells in the lower part of the diagonal denote recoveries. The deforestation or forest degradation of 2 354.07 ha is attributed to illegal logging by organized groups; other, more gradual changes are attributed to occasional loggers or to periods of droughts, and to a particular storm that occurred in February 2010 (Alcántara et al., 2012). Reforested areas, mainly achieved under various reforestation programs, represent 726.94 ha. The general tendency is for forest degradation and deforestation to decrease, with the two conditions evolving in parallel, with proportional dimensions. This was first noticeable since 2007; the assessment of the 2009-2011 period confirms this trend, with the most important effects being produced by the above-mentioned storm in February 2010.
Table 4 Matrix of changes in the period 1999-2011, in core zone, expressed in ha.
| Class | Closed | Semi-closed | Semi-open | Open | Deforested | Total | User's accuracy | Producer's accuracy | Overall acuracy |
|---|---|---|---|---|---|---|---|---|---|
| Closed | 0.5394 | 0.0269 | 0 | 0 | 0 | 0.5665 | 0.952 | 0.987 | 0.9529 |
| Semi-closed | .0066 | 0.1405 | 0 | 0 | 0 | 0.1472 | 0.954 | 0.839 | |
| Semi-open | 0 | 0.00532 | 0.1223 | 0 | 0 | 0.1277 | 0.957 | 0.981 | |
| Open | 0 | 0 | 0.00237 | 0.0523 | 0 | 0.0547 | 0.956 | 0.911 | |
| Deforested | 0 | 0 | 0 | 0.0051 | 0.0984 | 0.1036 | 0.049 | 1.0 | |
| Total | 0.546 | 0.1674 | 0.1246 | 0.0574 | 0.0984 | 1 |
DISCUSSION
Long-term data sets are important in the fields of ecology, hydrology, rangeland science, and geography (Rango et al., 2008); nevertheless, few multitemporal studies have used high-resolution digital images to analyze long-term vegetation dynamics in large areas (Tanaka and Nakashizuka, 1997; Key et al., 2001; Rango et al., 2008), because the cost and processing requirements involved can be prohibitive (Latifovic et al., 2005; Gougeon and Leckie, 2006). In the present case, flight campaigns, orthomosaics generation, and interpretation of changes in the forest canopy density were achieved at an average cost of 20 000 USD. For twelve years, significant efforts were made to perform aerial surveys with high-resolution digital imagery in the study zone. Photographs obtained in different aerial surveys constitute very important material in the assessment of changes in forest canopy density, giving the possibility of reinterpreting some specific years; specifically, six biennial analyses of changes were made and reported here. The use of these photographs with a pixel size from 1.12 to 0.3 m (between 1999 and 2011 respectively) allowed an extension to a scale of 1:2000, with good quality. Nevertheless, for practical reasons pictures were printed at 1:10 000, demonstrating that this scale can assist in the generation of digital cartography to assess changes in forest canopy density.
The use of these aerial digital photographs and their manual interpretation offers the prospect of achieving greater detail and precision in the delimitation of forest cover units. The general tendency in recent years has been a reduction in deforestation. However, in 2007 assessments of deforestation rate and forest degradation indicated a drastic reduction in forest canopy density, a tendency that would lead to loss of the entire forest in 2050 if the current rate continued; fortunately, the trend was reversed. An explanation of this problem was the logging that was authorized for ten years from 1999 to 2008. In 2007, there was extensive legal and illegal logging in both authorized and unauthorized zones, including the areas near access roads.
Technology can provide very sophisticated methods for assessing changes in forest canopy density; however, this task must be accompanied by social work, integrating all the communities in conservation programs, and leading to satisfactory results as in the case presented here.
CONCLUSIONS
Conventional and adapted techniques of photogrammetry and photo-interpretation were employed, together with small-format high-resolution aerial digital photographs to assess changes in forest canopy density. These photographs allowed for a detailed delimitation of the boundaries between altered zones resulting in accurate polygons of changes. A working scale of 1:10 000 gives an effective separation between forest density units. Extraction of forest canopy density from aerial imagery must be carried-out by experienced specialists; however, this approach is an option when neither more sophisticated methods nor high-resolution satellite imagery (at competitive costs) are available.
The results of periodical assessments have been expressed in maps, and this information has been used by the Monarch Foundation to assign payment for environmental services, and for conservation; this has achieved a reduction in degradation and deforestation within the whole MBBR, thereby accomplishing the main objective of this project.

