


Services on Demand
Journal
Article
 English (pdf)
 Article in xml format
 Article references
 Send this article by e-mail
Indicators
-
 Cited by SciELO
 -
 Access statistics
Related links
-
 Similars in
SciELO
Similars in
SciELO
Share

 Permalink
Investigaciones geográficas
On-line version ISSN 2448-7279Print version ISSN 0188-4611
Invest. Geog n.78 Ciudad de México Aug. 2012
Geografía física
Study of thermal comfort in the City of São Paulo using ENVI-met model
Estudio del confort térmico en la ciudad de São Paulo utilizando el modelo ENVI-MET
Ana Claudia Carfan* Emerson Galvani* Jonas Teixeira Nery**
* FFLLCH USP, 338, Professor Lineu Prestes Avenue, Cidade Universitária, ZIP CODE 05508-000, São Paulo, SP, Brazil. E-mail: acarfan@usp.br; egalvani@usp.br
** Ourinhos UNESP, 1500, Vitalina Marcusso Avenue, Ourinhos, São Paulo, SP, ZIP CODE 19910-206, Brazil. E-mail: jonas@ourinhos.unesp.br
Received: 4 August 2010.
Final version accepted: 27 October 2011
Abstract
This study is aimed to analyze the thermal comfort in different areas in the city of São Paulo. Two different areas were selected, a densely built (Consolação district) and the other was Fontes do Ipiranga State Park (FISP), an area with only a few buildings and reduced impermeability. A micro-climatic ENVImet was used to simulate the interaction surface-atmosphere in the urban environment. The model resolution is between 0.5 and 10m. This model was developed by Bruse and Fleer (1998) and Bruse (2004). Through the thermal comfort index PMV (predicted mean vote) and MRT (mean radiant temperature) provided by the model, it revealed that the State Park displays PMV values close to comfortable compared to the other studied area. The analysis of thermal comfort index and the Wind flow showed the influence of high buildings in the local climatic environment.
Key words: Thermal comfort, ENVI-met, urban climate.
Resumen
En este estudio se analizó la comodidad termal en distintas áreas en la ciudad de São Paulo. Dos áreas diferentes fueron seleccionadas, densamente construido (Consolação) y el otro fue en el Parque de Estado de Ipiranga (FISP), un área con solo unos edificios e impermeabilidad reducida. Un microclimático ENVI - encontrado fue usado para simular la atmósfera superficial de interacción en el ambiente urbano. La resolución del modelo está entre 0.5 y 10 m. Este modelo fue desarrollado por Bruse y Fleer (1998) y Bruse (2004). Por el índice de comodidad termal PMV (voto medio predicho) y TMR (significan la temperatura radiante) proporcionado por el modelo, esto reveló que el Parque Estatal muestra valores de PMV cerca de cómodo comparado con la otra área estudiada. El análisis del índice de comodidad termal y el flujo de viento mostró la influencia de edificios altos en el ambiente climático local.
Palabras claves: Confort térmico, ENVI-met, clima urbano.
INTRODUCTION
Several studies have shown the interference of buildings, soil sealing and the absence of vegetation on local climate. The growth of urban population is fast taking the necessity of seeking alternatives, making it possible the life in the cities in good living conditions. The increased heat in the city changes the movement of wind, humidity and even rain. Impervious, as asphalt and concrete make the rainwater to evaporate from the soil quickly, reducing the cooling. The particles released into the atmosphere by cars and industries provide an increased amount of clouds and hence rainfall. The replacement of natural materials for urban causes changes in the characteristics of the local atmosphere. Temperature rise in large cities can be observed, a phenomenon known as 'heat island'. The effects of heat islands are good examples of changes in the atmosphere caused by humans. The heat island tends to achieve higher temperatures when the sky is clean and clear and the wind calm. The height, density and shape of buildings change the morphology of urban land, influencing the angle of incidence of solar radiation, so it can decrease or increase the reception of energy in certain areas of the city. In the Southern Hemisphere, inclined surfaces to the south during the year receive less energy than those northward because of apparent sun movement. The more inclined the surface, the less sunlight it receives. The lack of radiation is conducive to the proliferation of fungi and respiratory illnesses that can reach people who live and work in such areas. Since industrialization, urban growth was disorganized and unplanned, which resulted in increasing problems, especially in large cities. In Europe the process of urbanization began in the nineteenth century after the Industrial Revolution. In Brazil, this process is closely linked to industrialization, which has developed since 1950, after the accumulation of capital caused by coffee agriculture. The rural exodus has also contributed to the growth of cities. In the 70s, with the mechanization of rural activities, the resulting unemployment and the search for better living conditions have caused much of the population migration to the cities. The city of São Paulo was the main center of attraction in Brazil for this migration. The first studies of thermal comfort were made in closed areas (workplaces), in order to provide greater income to the employee.
Ahmed (2003) made a study of the tropical urban environment in Dkaha, Bangladesh and noted that this relation, internal and external environment must be studied. According to the author, comfortable open spaces have a significant influence on the comfort of indoors. The great interest in the search for comfort conditions in buildings is due to external uncomfortable conditions. In this sustainable building design context, which promotes constructions of low power consumption, a comfortable urban microclimate might be considered as an important agenda for future urban initiatives.
According to the author to provide a microclimate comfort is linked to urban design (geometry and orientation of building, building materials, vegetal mass, and water bodies) and power saving.
In July and August it was made temperature and humidity measurements in different areas of the city, such as: areas of low and high residential e industrial construction density. According to the author, a microclimate comfort is connected to the urban design (geometry and building orientation, building materials, vegetal mass as well as water bodies) and power saving.
Emmanuel et al. (2007) conducted a study of urban microclimate in Colombo, Sri Lanka, using the ENVI–met model to simulate the effect of different design areas, in temperature and thermal comfort. On this study the author used the PET (physiologically equivalent temperature). PET is an index of thermal comfort for external areas, which is based on radiant temperature, as well as on the air, humidity and the wind. Emmanuel relates the height ratio (h)/width (w), i.e., the height divided by width, of so called urban 'canyons' with values of temperature, whereas the daily maximum temperature decreases with the increase in the ratio h/w. Thermal comfort is therefore directly linked to urban design, since an increase in the rate of 1 to 3 makes the PET index drop by about 10.0ºC.
Gaitanis et al. (2005) studied the thermal comfort in open spaces in the Athens area using two thermal comfort indices, namely comfort formula, called COMF Brown and Gillespie, 1995. This formula is based on the person's energy conduction and surface temperature (ST), which is based on the satisfaction or dissatisfaction of pedestrians in outdoor environments. These indices were calculated for two different environments, where the first is a built conventional space and the second one built according to bioclimatic principles. Both indices showed that the second area presented better comfort conditions due to the existence of green areas, water bodies and construction materials with low values of Albedo.
Fahmy and Sharples (2009) studied the influence of urban form on thermal comfort in Cairo, Egypt. Were analyzed the urban structures with its green areas and street orientation, which may influence the decrease of temperature and increase or decrease in the wind.
Bueno-Bartholomei (2003), Guerra e Cunha (2009) evaluated the attenuation of solar radiation by different species of trees and the thermal comfort provided by such trees in Campinas, SP. Thermal comfort was evaluated using the Predicted Mean Vote (PMV) proposed by ISO 7730, 1994. The species with the best performance in reducing the radiation was the Jambolão, although the shading of the tree has not reduced the values of PMV, to levels of comfortableness.
Gomes and Amorim made a study of thermal comfort in urban space in the city of Presidente Prudente - SP. The authors used the effective temperature index developed by Thom (1959), which defines areas of comfort with data of dry bulb temperature and wet bulb. The areas of study with a larger arborization were shown to be thermally comfortable compared to those without arborization.
This study aims to compare the thermal comfort presented by two areas with different construction and forestation density within the city of São Paulo. To that, we used the model microclimatic ENVI-met to calculate the thermal comfort index PMV (Predicted Mean Vote), developed by Fanger (1972) and medium radiant temperature (MRT). The vertical profiles of air temperature, wind speed and number of Richardson for the analysis of turbulence in the boundary layer were also analyzed.
AREAS STUDIED
The city of São Paulo is located in southeastern Brazil in a recessed compartment in the Atlantic plateau. According to the IBGE (2007) it has an area of 1523 km2 and an estimated population of 10 886 518 inhabitants. According to Valente de Macedo (2009) environmental characteristics are defined by its geographic situation with rugged hills ranging between 650 and 1 200 m. The proximity of the Atlantic Ocean strongly influences the pattern of atmospheric circulation in this city, which has 77 different climates as a result of the ways urban space are occupied (FAPESP magazine, 2004). The climate is tropical wet because of the São Paulo plateau altitude, according to Tarifa et al. (2001), with average temperatures around 19.3ºC, and the average maximum of 24.9º C and average minimum next 15.5º C. The total annual rainfall varies between 1 250 and 1 450 mm.
The two areas chosen for the analysis of thermal comfort are the Consolação quarter and Fontes do Ipiranga State Park. Consolação district in the city of São Paulo is part of the Sé sub-town hall and is located in the downtown area (Figure 1). To perform the simulation were used four blocks, with dimensions of 540 x 540 m, Consolação district (23o 32'S, 46o 39'W). This is a densely built, with tall buildings, some with over 15 floors and little vegetation on the sidewalks (Figure 2).

According to Lombardo (1985) the central region of São Paulo, where is located the District of Consolation, displayed temperatures above 10.0º C than its surroundings. The study was based on satellite thermal images and displayed the existence of islands of heat with different intensities and seasonal extensions.
According to Tarifa and Azevedo (2001) the district displays a small percentage of green areas with prevailing temperatures of 28.0º C in the months of September and April.
Figure 3 refers to the grid input model for the Consolação region. The resolution of the grid is: x = 4.5 m, y = 4.5 m and Z = 6.0 m and was generated within the model itself. The edge of the model (boundary conditions) shown in Figure 3 (yellow) should not be analyzed because the model does not perform the calculations in this region.

The second area chosen, Fontes do Ipiranga State Park (23º 39'S, 46 37'O) is located in the Agua Funda District, about 10 km from downtown, in Sao Paulo. The Parque Estadual (Figure 4) has the largest concentration of Atlantic forest in an urban area, with more than 500 hectares and is home to the headwaters of the Ipiranga river. The area has few buildings, vegetation and large bodies of water. Model ENVI-met not adequately simulate regions of lakes and seas. In the park areas, where bodies of water are found, we chose to consider them soggy soil region, and therefore can not provide actual values of thermal comfort.

Still according to Tarifa and Azevedo (2001), the region of the park displays predominant temperature of 26.0º C in the months of September, varying from 25.0 to 28.0º C.
In the months of April the prevailing temperature is 23.0º, with thermal amplitude of 5.0º C.
Figure 5 represents the grid of model input for the Park and has a resolution of: x = y = z = 4.5 m.

METHODOLOGY
In this work the model ENVI-met version 3.0/3.1 was used. The micro-climate model is designed to simulate three-dimensional, using Cartesian coordinates, interaction surface - plant - atmosphere in the urban environment, with a resolution between 0.5 and 10 m. This model was developed by Bruse and Fleer (1998) and Bruse (2004).
The ENVI-met works with two physical systems (land surface and atmospheric) up to an altitude of 2 500 m. The terrestrial surface is treated as a multilayered, where the vegetation and soil are treated separately. The model for the soil is composed of 14 layers, narrower near the surface and larger to a depth of 2.0 m. Due to the simplicity, only on the exchange of heat and moisture the equations of Fourier and Richards are used. In the calculations of soil hydraulic parameters are used the classifications by Clapp and Hornberger (1978). Thermal conductivity and diffusivity are calculated using the formalism of Pielke (1984) and Tjernström (1989), respectively, in Bruse (2004). The turbulent fluxes at the soil (2004). The turbulent fluxes at the soil surface are determined by the theory of similarity of Monin/Obukhov, which takes into account the atmospheric stability.
Also the vegetation is treated as a system of multiple layers, with their own radioactive exchanges, energy balance and average temperatures. It is also important to mention that the first layer above the surface is divided into five sub-layers in order to best represent the radioactive exchange and turbulence near the surface. Because it is a model for urban areas, the radiation transfer in vegetation is very simple, several assumptions are made, for example, the diffuse radiation is not attenuated by the leaves.
The initial vertical distribution of leaves is described by the leaf density (LAD), given as medium values. The model does not consider a canopy and the vegetation takes as homogeneous, which means that only one type of vegetation can be considered vertical. In the horizontal direction can be used various kinds of vegetation.
The latent heat influx produced by the turbulence and the radiant energy available at each layer are calculated based on stomata and aerodynamic resistance, as well as temperature and humidity in the environment. In the leaves are considered only the exchange of heat and humidity, which means that the flow of CO2 are not represented. The CO2 in the integration soil-atmosphere and soil-vegetation, is also neglected.
The atmospheric system is very complex compared to soil and vegetation, as it involves Reynolds and Navier-Stokes equations average. Three main variables are calculated with these equations: wind speed, air temperature and humidity. The calculation of the turbulence is based on the E-e model (Launder, Spalding, 1974), which calculates the turbulent kinetic energy (E) and its dissipation rate (e). Note that all these equations are used for vegetation, using source/sink in the calculation of heat, moisture and momentum exchange. These 'sources' take into account mainly the LAD and the gradient of the variables involved (wind speed, humidity and temperature). The initial conditions of the atmosphere and soil profiles consist of constant or linear dependent variable predicted and calculated in accordance with the work of Bruse and Fleer (1998) and Samaali (2002).
According to Bruse information (website. http://www.envi-met.com) every numerical model, especially 3D models such as ENVI-met is not working properly at their model borders and at the grids very close to them. So the best you can do is to move these borders away as far as possible from your area of interest in the core area. The reason for these problems is resulting from the fact, that the model cannot calculate real values for grid points along the borders (and especially not for grid points that are the border). As these points are missing at least one neighbor grid, only simple assumptions can be used here to obtain values that can be used in the model. This simple assumption can be that the values are constant at these grid points (so called closed boundary conditions or forced bc) or that values from inner grid points are copied to the grids on the border (open boundary conditions). A third method also offered in ENVI-met is to copy the values from the outflow boundary back to the inflow boundary (cyclic boundary conditions-LBC).
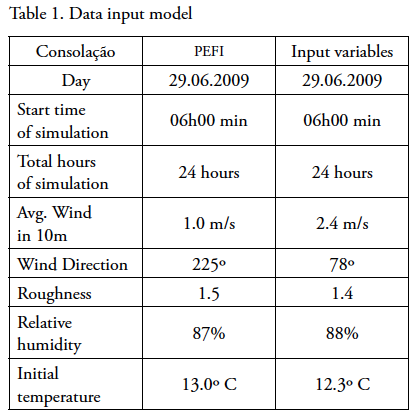
The input data of the model (Table 1) are: air temperature, direction and wind speed, specific humidity and relative humidity and were obtained from the site Time Now. The simulation time was 24 hours, starting at 6 am. The date chosen for the simulation was 29/06/2009, so a winter day in the region, according to the Center Integrated Information agro meteorological (CIIAGRO) filed this day, average maximum temperature maxT = 25.5ºC, average minimum temperature minT = 13.4ºC and no rain.
Through the model were calculated surface temperatures and thermal comfort index PMV (predicted medium vote) developed by Fanger (1972). Fanger conducted researches examining the conditions of temperature, humidity and air velocity in climate-controlled environments, where people stayed for some time and answered questions about their perception of thermal comfort. Fanger established in the PMV a model of correlation between the subjective human perception, expressed through the vote of comfort on a scale ranging from -3 (very cold) to +3 (very hot) and the difference between generated heat and heat from the human body.
The PMV index varies according to the scale below:
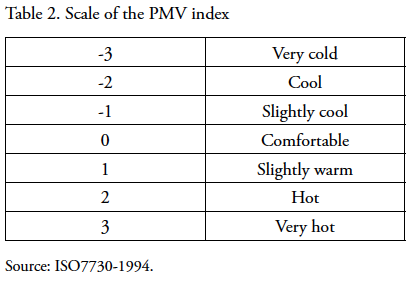
This work for the calculation of PMV were considered the following variables:
- Activity: walking on the horizontal v = 0.88 m/s
- Metabolism = 116 W/m2
- Mechanical Efficiency = 0
- Thermal resistance index = 0.5 Clo (thermal isolation of clothing used - ('clo' of clothes, 1Clo = 0.155 m2K / W).
According to ISO7730, international standard that establishes criteria for assessing the thermal comfort, the recommended values of PMV are between -0.5 < PMV < +0.5.
The TMR (mean radiant temperature) is defined as the temperature of an imagery blackbody that produces the same heat loss by radiation as in a real location and includes the flow of short and long wave radiation, both direct and reflected. It is one of the most important parameters in the energy balance and human thermal comfort and it is used to calculate the loss of sensible heat (H) in the equation of PMV. An individual who is directly exposed to solar radiation may be subject to a much higher TMR at room temperature, reaching differences above 25.0ºC in the case of a person sitting with the whole body exposed to maximum solar radiation.
The medium radiant temperature for a condition of comfort, according to ISO 7730 should be between 10.0 and 40.0ºC so that humans do not feel uncomfortable.
With data generated by the model mean radiant temperature graphics were made mean radiant temperature (MRT) and the PMV index for the two studied areas (Figure 2 and 4) and calculated the coefficient of determination (R2) between these two variables (Figure 10 and 11).


For the analysis of speed and direction of wind flow and turbulence were made graphs of vertical cuts in the grid of the studied area (Figures 13 and 14) and vertical profiles of air temperature, wind speed and number of Richardson at central points in two regions (Figure 5).


Terms of atmospheric stability or instability are detected through the Richardson number (Ri). Pereira (2000) brings the limits of the stability parameter Ri as follows: Ri > 0 characterizes conditions for stable atmosphere, convection deleted, Ri > 0.21, characterizes almost flow - laminar, Ri = 0 indicates neutral atmospheric conditions, Ri > -0.03, indicating instability with forced convection and Ri < -0.03 indicate free convection.
RESULTS AND DISCUSSION
Figure 6 shows an index PMV between -1.5 and -1.0, values considered outside the limits of thermal comfort (-0.5 < PMV < +0.5). These figures are in both surface area and paved with concrete (paving). Values between 1.5 and 2.0 (red) in Figure 6, are also outside the comfort zone, tending to warm. These are areas outside the shade with radiation directly reaching the surface, thus more heated. These results show that the shading, together with increasing albedo and decreasing the density of construction, has been an alternative for the mitigation of mean radiant temperature.
Much of the area studied had values of PMV between -1.0 and - 0.5. These values allow the inference that this area is uncomfortable for people to exercise daily activities, being necessary to increase other sources of energy (not natural) to create favorable conditions for the performance of people who frequent this space.
At Parque Estadual, Figure 7, the area beneath the canopy showed a PMV between -1.5 and -1.0, i.e., thermal discomfort tends to cold. The asphalt surfaces also showed discomfort with index between 0.5 and 1.0, (feeling slightly warm). Surface with asphalt, concrete and gravel have high specific heat resulting in heating up late, not resulting in the maximum radiation, which occurs around 12h, bodies of water, naked soil and creeping vegetation presented indices between -0.5 and 0.5 and are within the comfort zone.
Although the use of soil in two regions, Consolação and Parque Estadual, are very different, they presented thermal discomfort tending to cold. This is due to shadowing caused by buildings in the case of Consolação, which shows that not always a high density of construction brings an increase in medium radiant temperature, resulting in a more heated environment. The deep shade and the emergence of canyons, due to the presence of corridors of high buildings, are real situations in the city of São Paulo, in some areas. The combination of these two things creates in the population, situations of discomfort, despite the city of São Paulo is located in a hot region, i.e., be a tropical city. This is the situation that is reflected in the Consolação district, by presenting dense residential areas and high sealing its soil.
At Consolação district, the TMR values were between 20.0 to 25.0º C at 15:00, in 29/06/2009, Figure 8. It is observed that in non-shaded displays the TMR presents values above 60.0º C. This temperature range in a relatively small area shows that for a city the size of São Paulo exceptional thermal values will be presented throughout the day, resulting in thermal discomfort to the population and causing excessive expenditure of energy, to generate adequate working conditions for this population.
Thus we can see that in the Consolação district, the surface is waterproof, lined with concrete and asphalt, but the height of buildings has a significant role in cooling the air and in the thermal comfort in this area.
The MRT for the Parque Estadual displays values above 50.0ºC for paved areas, bodies of water and creeping vegetation. The wooded area has values between 25.0 and 30.0ºC or 5.0ºC above the value of TMR in the area built in the district of Consolação. Through analysis of the two areas it is observed that both have thermal discomfort, and the district of Consolação showed higher thermal discomfort to the day considered. This is due to the density of residential areas, the lack of green areas, and the lack of spacing between buildings, to generate ample avenues allowing greater penetration of solar energy in this environment.
At Consolação district the coefficient of determination was 0.98 and at the Park was 0.90, indicating that more than 90% of PMV can be explained by TMR showing that the correlation is statistically significant (p < 0.05).
This can be explained simply as urban comfort being expressed in PMV, here being dependent on the area of green cover, the number of urban trees, the shape and characteristics of foliage, the orientation of the urban model, and the degree of compaction, lack of green urban and built area. This equation shows the reunion of all parameters for each situation presented in Figure 10 and 11, needed to study the planning of a new urban climate, and for one area of study, some parameters having more significance in relation to another area analyzed.
The Figure 12 and 13 represent the vertical section of Consolação and Parque Estadual areas respectively, generated by the model.
In Figure 12, section made at y = 60 (270 m), one can observe that the wind speed has vertical gradient with lower values near the surface. The wind speed near the buildings ranges from 0.2 to 1.5 m/s. The predominant wind direction in the region at that time is southwest, above the canopy (surface layer near the top of buildings). Near the building the flow suffers turbulence and changes its direction according to the local architecture.
On the wall of the building (toward x = 70), the windward side, there is a divergence of the wind flow. From 42 m high (z = 7) to the surface, the flow is downward which can cause problems in the dispersion of pollutants. In this situation, if the flow is convergent, the accumulation of pollutants can result in chemical reactions generate new pollutants, secondary pollutants.
It is also observed a downward flow between the buildings (x = 55 x = 59), although the speed is below 0.5 m/s. This downward flow is observed in most of the windward wall except at x = 50 m, where the flow is upward. The profile analysis showed winds of looping type, which would be expected for wind flow along the high buildings.
In the boundary layer conditions that favor the dispersion of pollutants are the strong instability and a deep mixed layer, which usually occurs during the summer in the region. Although a winter day, in Figure 14, there is the vertical profile of temperature and note that there is no heat exchange in the two areas of study. Despite presenting calm winds in both areas, Consolação (Figure 12) and Parque Estadual (Figure 13) they show little turbulence and instability.
The wind speed within the urban boundary layer is small compared to rural areas, due to surface roughness. Often the so called 'urban canyons', characterized by the ratio of building height/width of streets, are favorable, since they intensify the wind speed favoring the comfort and dispersion of pollutants. The average height of buildings along the streets and blocks studied was around 40 m, so the ratio of height to width remained about 4, which does not cause a large concentration of flow. When comparing the wind speed near the surface, intense winds are observed over the Parque Estadual compared to Consolação (Figure 14). In two cases this process can be reversed: when the wind suffers deflection and forms a jet along the street or when regional winds are calm (presence of anticyclones), which does not apply to the studied areas.
It can be seen in Figure 13, a speed reduction near the buildings and all flows tend to rise when they encounter the barrier of the buildings, which in the area are few and large distances between them. The wind speed decreases with the buildings ranging between 0.2 and 0.5 m/s and remains constant above 1.0 m/s, near the trees. In the lee of vegetation is also expected wind like looping and although the park's vegetation is dense, wind speed was small, for this phenomenon. Consolação showed a vertical profile of temperature ranging between 15.5ºC near the surface and 14.8º C in the first 100 m. In Parque Estadual the temperature ranged between 14.7º C on the surface and 13.7ºC to 100 m (Figure 14). The change in wind speed near the boundary layer takes place only by surface roughness since the thermal exchanges are too small as shown in the vertical gradient.
After the 100 m the wind speed tends to decline in both areas and there may be a thermal inversion. The output of the model for the vertical profile of air temperature and wind speed reaches 120 m or so.
The model provides Richardson number to a height of 2 500 m. The Richardson number were higher than 0.21 throughout the vertical profile. This value indicates almost laminar flow or low turbulence for the two areas studied.
CONCLUSION
The model simulated satisfactorily the temperature and wind speed parameters for the two different chosen areas, enabling the use of the same generation to other climate parameters such as thermal comfort index PMV and mean radiant temperature. The model provided an overview of the urban climate and was used to point out problematical areas within the city and thus seek solutions to minimize the entropic effects and improve the quality of life.
An analysis of the PMV at 15:00 showed that only the Parque Estadual features comfortable areas. These are the areas that receive direct sunlight and do not suffer the action of shade trees. In the Consolação district the thermal sensation of discomfort is slightly cold, it suffers the shading effect of tall buildings. This situation was expected because it is a winter day. A small strip in the Consolação district receives direct radiation and has an uncomfortable tending to hot, showing that in the absence of tall buildings we would have an opposite situation to that presented.
The analysis of the winds showed an unfavorable situation in the Consolação district, which presented in the areas close to buildings, downward flow. This picture is disturbing, when one takes into account the dispersion of pollutants. Although not done a study of air quality, this configuration shows that pedestrians may suffer the effects of pollution by the non-dispersion of pollutants.
The wind turbulence is also a factor of concern, not only the issue of air pollution in the city of São Paulo, but for the discomfort it causes on people traveling in these areas.
REFERENCES
Ahmed, K. S. (2003), 'Comfort in urban spaces: defining the boundaries of outdoor thermal comfort for the tropical urban environments', Energy and Buildings, no. 35, pp.103-110. [ Links ]
Bueno-Bartholomeu, C. L. (2003), Influence of vegetation on thermal comfort in urban and built environment, Thesis (Ph.D.), Faculdade de Engenharia Civil, Universidade Estadual de Campinas. [ Links ]
Bruse, M. and H. Fleer (1998), 'Simulating surfaceplant- air interactions inside urban environments with three dimensional numerical model', Environmental Modeling and Software, v. 13, pp. 373-384, 998. [ Links ]
Bruse, M. (2004), ENVI-met [http://www.envi-met.com; acess in July 2010] [ Links ].
Science and Technology in Brazil (2004), FAPESP, São Paulo Special 450 years, São Paulo. [ Links ]
Emmanuel, R., H. Rosenlund and E. Johansson (2007), 'Urban-shading the design option for the tropics? A study in Colombo, Sri Lanka', International Journal of Climatology, vol. 27, issue 14, pp. 1995-2004. [ Links ]
Fanger, P. O. (1972), Thermal comfort: analysis and applications in environmental engineering, McGraw-Hill Book Company, USA. [ Links ]
Fahmy, M. and S. Sharples (2009), 'On the development of an urban passive thermal comfort system in Cairo, Egypt', Building and Environment, volume 44, Issue 9, September, pp. 1907-1916. [ Links ]
Gaitanis, N., M. Santamour and G. Mihalakakou (2005), 'Thermal comfort conditions in outdoor spaces', International Conference 'Passive and Low Energy Cooling for the Built Environment', May, Santorini, Greece. [ Links ]
Gomes, M. A. S. and M. C. C. T. Amorim (2003), 'Afforestation and thermal comfort in urban space: a case study in public squares of Presidente Prudente (SP)', Paths of Geography, v. 7, no. 10, September, São Paulo, pp. 94-106. [ Links ]
Guerra, A. J. T. and S. B. Cunha (orgs.; 2009), Environmental impacts in urban Brazil, Bertrand Brazil, Rio de Janeiro. [ Links ]
Pererira, A. R. (2000), Introduction to Micrometeorology, Departamento de Ciências exatas da ESALQ, Piracicaba. [ Links ]
Tarifa, J. R. and T. R. de Azevedo (orgs.; 2001), The weather in São Paulo: theory and practice, Geousp - Universidade São Paulo (Collection New Ways, 4), São Paulo. [ Links ]
Thom, E. C. (1959), 'The discomfort index', Weatherwise (V), no. 2, pp. 57-60. [ Links ]
www.prefeitura.sp.gov.br accessed on 20/11/2009. [ Links ]
www.ciiagro.sp.gov.br accessed on 27/06/2009. [ Links ]
www.tempoagora.uol.com.br accessed on 29/06/2009. [ Links ]

