


Servicios Personalizados
Revista
Articulo
 Inglés (pdf)
 Artículo en XML
 Referencias del artículo
 Enviar artículo por email
Indicadores
-
 Citado por SciELO
 -
 Accesos
Links relacionados
-
 Similares en
SciELO
Similares en
SciELO
Compartir

 Permalink
Investigaciones geográficas
versión On-line ISSN 2448-7279versión impresa ISSN 0188-4611
Invest. Geog no.76 Ciudad de México dic. 2011
Geografía física
Erosion and marginalization in Pahuatlán municipality, Puebla: A binomial of causality?
Erosión y marginación en el municipio de Pahuatlán, Puebla: ¿Un binomio de causalidad?
Rosalía Castelán Vega*, Gladys Linares Fleites*, Víctor Tamaríz Flores*, Jesús Ruiz Careaga*
*Departamento de Investigación en Ciencias Agrícolas, Benemérita Universidad Autónoma de Puebla, 14 Sur 6301, Col. San Manuel, 72570, Puebla, Puebla, Mexico. E–mail: crumara@hotmail.com; gladys.linares@icbuap.buap.mx; jtamariz@siu.buap.mx; jruiz@siu.buap.mx
Received: 27 January 2010
Final version accepted: 30 May 2011
Abstract
An understanding of the interaction between deterioration of the environment and marginalization of communities is essential in order to formulate public policies that will combine social and environmental objectives. The aim of the present study was to explore the relationship between erosion and marginalization in the municipality of Pahuatlan, Puebla, Mexico. The erosion was assessed by the methods developed by FAO and Ruiz et al. Marginalization was determined by the Consejo Nacional de Población (CONAPO) method using Instituto Nacional de Estadística, Geografía e Informática (INEGI) indicators. The relationship was established by a simple correspondence analysis and was confirmed by Pearson's Chi–square test. Erosion could be assigned to one of three grades: moderate, severe and very severe. In the 32 towns that constitute the municipality, marginalization was moderate in 5, severe in 14 and very severe in 13. The correspondence analysis and the Chi–square test showed a causal relationship between erosion and marginalization, although it was not possible to detect with certainty which is the cause and which the effect. However, the results can contribute to the design of sustainable strategies for the municipality.
Keywords: Erosion, marginalization, causality.
Resumen
Entender la interacción entre deterioro ambiental y marginación es esencial para formular políticas públicas que combinen objetivos sociales y ambientales. Por lo que este trabajo tiene como objetivo contribuir al establecimiento del vínculo entre erosión y marginación en el municipio de Pahuatlán, Puebla. La erosión se evaluó según la metodología de la FAO y Ruiz y colaboradores; la marginación se determinó con la metodología del Consejo Nacional de Población (CONAPO) e indicadores del Instituto Nacional de Estadística, Geografía e Informática (INEGI). La relación se estableció con un análisis de correspondencia simple y se confirmó con la prueba chi cuadrada de Pearson. Los resultados demuestran que el municipio presenta tres grados de erosión: moderada, fuerte y muy fuerte; de las 32 localidades que lo conforman, cinco presentan marginación media, 14 alta y 13 muy alta. El análisis de correspondencia y la chi cuadrada muestran la relación entre las variables; por lo que se concluye que existe relación de causalidad entre las variables erosión y marginación; no obstante, no es posible discernir de manera concreta cuál de ellas actúa como causa y cuál resulta ser el efecto; sin embargo, los resultados sirven como herramienta objetiva para el diseño de estrategias sustentables del municipio.
Palabras clave: Erosión, marginación, causalidad.
INTRODUCTION
Erosion is one of the most serious environmental problems at present confronting Mexico, above all in the mountainous zones whose soils are particularly vulnerable and are transported by the runoff that affects various of their ecosystems (Maass, 1998; Becerra, 1999; Carabias, 2001; SEMARNAT, 2003). According to data supplied by the Ministry for the Environment and Natural Resources (SEMARNAT, 2004), 64% of the country's soils show signs of this process, with Puebla being the third most affected State owing to its geographic position and characteristics. Within the State, the municipality of Pahuatlán in the Sierra Norte is particularly noteworthy for its severe erosion problems (Ruiz et al., 2001). Previous studies (Castelán, 2003 and 2009) have shown that this process is favoured by a combination of natural factors including the mountainous relief, the high rate of precipitation and the introduction of traditional crops such as maize and beans without conservation measures, but also by the high marginalization of the population and the social and economic inequality in the region, expressed by the inequitable distribution of land to the conspicuous disadvantage of the 49% of the population who are indigenous peoples (INEGI, 2005). Despite this situation, there have been no studies to test the causality of this relationship. Hence, the principal objective of the present study was to establish the relationship between various grades of erosion and the degrees of marginalization in this municipality.
MATERIALS AND METHODS
Study area
The municipality of Pahuatlán is in the north–western part of Puebla State (Figure 1), lying on a small plain on the slopes of Ahila Hill, at 20°13'12" to 20°21'98" N, and 98°04'18" to 98°12'12" W. It is bordered to the north by Tlacuilotepec and Hidalgo State, to the south by Naupan and Hidalgo State, to the east by Naupan and Tlacuilotepec, and to the west by Honey and Hidalgo State. With an area of 80.37 km2 it is the 140th largest municipality of the State, and has 32 towns or villages organized within ten local authorities (INEGI, 2000b).
It is part of the eastern Sierra Madre and belongs to the subprovince of Carso Huasteco (Consejo de Recursos Minerales, 1995); a small area in the west has a temperate sub–humid climate with summer rains, but the bulk of the municipality has a temperate humid climate with abundant summer rain; mean annual precipitation varies between 1500 and 2000 mm. The dominant vegetation is mesophyll mountain pine–oak woodland. It is a zone of mountains and low ranges (Figure 2) with pronounced gradients (Figure 3). The soils are cambisols, calcisols and leptosols (Fuentes, 1972; INEGI, 2000b).
Edaphic characteristics
An edaphic survey established 31 sampling sites. The description of the profiles, the setting and the degree of erosion followed the methods of FAO (1980) and Ruiz et al. (1999); the best conserved profiles, i.e. those that have suffered the least effects of erosion, were designated 'Reference Profiles' and were representative of the study area in terms of soil. A detailed knowledge of their morphological characteristics allowed them to be compared with the profiles of the sites described in order to identify the losses suffered. Erosion was then categorized according to the following classification: none, light, moderate, severe and very severe.
Defining the marginalization
At the same time as the soil sampling, there was a direct survey of 288 rural workers selected randomly in the 32 towns of the municipality.
The survey was designed so that the individual responses could be compared by locality, and so that a database could be created (Azorín and Sánchez, 1996; PRECESAM, 2002). The activities undertaken in the plots and/or units of production were identified in terms of deforestation, productive systems, agricultural practices and backyard practices, socio–economic status and the various means of earning income (León, 2002).
The information generated was analysed and compared with indicators supplied by INEGI (2000a) and CONAPO (2001). Marginalization in the 32 towns was then classified according to the following grades: low, medium, high and very high (CONAPO, 2001).
Relationship between the degrees of erosion and marginalization
Finally, the information collected was subjected to a simple correspondence analysis and a Pearson's Chi–square test in the MINITAB 15 (Linares, 2006) statistical program.
RESULTS
Edaphic characteristics
The municipality includes various sectors with moderate, severe or very severe degrees of erosion, as follows (Figure 4).
Sectors with moderate erosion. These lie within the north–western, western and eastern parts of the municipality and are characterized by marked gradients that constitute a potential risk factor for erosion, since the gradients are about 25%. The vegetation is remains of pine–oak woodland with signs of secondary growth; years ago, an intense deforestation favoured the loss of a great quantity of soil, so that there is still moderate erosion in these sectors. However, the period of exploitation to which they were subjected lasted only a short while, and this allowed the rapid development of dense vegetation that is responsible for intercepting the drops of rain and decreasing the rate of flow of the runoff; other benefits that this vegetation has conferred on the system are the improvement of soil aggregation and porosity as a result of the action of the roots and plant remains, as well as enhancement of the water storage capacity by lowering the soil humidity through transpiration (Gliessman, 1998). It is even possible to see profiles that retain their upper horizon, although in most cases they have lost some of their original depth.
The representative profiles of these sectors are in the village of Acahuales, and in terms of their edaphic characteristics they are the most conserved soils in the study area, so they are considered as Reference Profiles. They have the following characteristics of soils developed under wooded conditions: horizon A with a depth equal to or greater than 50 cm, a granular structure, friable consistency and sandy texture; and horizon B with root decomposition, a mean depth of 1.55 m and a clayey texture.
Sectors with severe erosion. These lie within the western and eastern parts of the study area. An aspect that has contributed to the erosion in these sectors is the steepness of the gradient, this being up to 50% in some areas. However, this factor would not be manifested in erosion if there were not almost complete deforestation of the land with the aim of using it for agricultural crops such as maize, beans and chili. These are sown intensively without any conservation practices, so that the particles are swept along by the rainwater and the erosive process accelerates (Porta et al., 1999).
Maize is the principal crop sown in these sectors, since it is used not only for family consumption but also for feeding cattle, birds and other domestic animals. However, the continuous cultivation of maize without applying means of protection has accelerated the erosion even more and, given their requirements for light, water and nutrients, the plants are sown sparingly to avoid competition. In addition, weeds are removed and the resultant paucity of plant cover brings an increased susceptibility to erosion, increasing the loss of topsoil to the detriment of agriculture (Worthen and Aldrich, 1990). In the municipality, the monoculture of this species leads to the gradual impoverishment of the land, exacerbating even more the degradation of this resource. Hence, at present the soils of these areas have completely or at least partially lost their upper horizon and part of horizon B, leading to a decrease in harvest yields and favouring soil degradation and the poverty of the population.
The representative profile of this degree of erosion is on the way to Tlaltengo and has the following characteristics: absence of litter layer, loss of horizon A, horizon B 30 cm thick, medium or large subangular blocks, lightly compacted and with a clayey texture.
Sectors with more severe erosion. These are in the north, south and west of the municipality and are characterized by the presence of extended slopes with a gradient that can exceed 70%, also by high rainfall (2500 mm), which under conditions of deforestation is considered to be a factor in erosion (Morgan, 1997; Becerra, 1999). There has been a drastic change in soil use in these sectors; gradual disappearance of the woodland has led to degradation, destroying the fragile equilibrium established over the course of centuries.
The elimination of this plant cover had as its objective the exploitation of the land with subsistence crops such as maize, beans and chili; these have been sown in agricultural systems that are unsuitable for the slopes. The technological naivety of the agricultural workers has led them to apply the same concepts of sowing and working as those applicable to flat regions, where there is not a high danger of erosion; widespread among these workers is the practice of slash and burn, which in only a few years causes a severe mineralization of the organic matter and, added to the high rainfall and the steep slopes, unleashes destruction of the physical, chemical and biological properties of the soil owing to erosion by water (Gleissman, 1998). Harvests start to decline and the farmer abandons the plot of land in order to use fallow land or to remove more trees; in some cases not only is there no fallow period but, on the contrary, the land continues to be exploited in an irrational manner until the resource is completely degraded, so that the soils of these sectors have now lost their horizon A. Another factor driving the erosion process has been the increase in population density, which has exerted great pressure on the natural resources and impeded the natural regeneration of the system.
One of the representative profiles of these sectors is in Atla. Its principal characteristics are as follows: absence of the litter layer, loss of horizon A, a 20 cm thickness of horizon B, subangular block structure, compact consistency and clay–sand texture.
Of the whole area of the municipality, 19% has moderate erosion, 29% has severe erosion and 52% has very severe erosion (Figure 5).

Defining the marginalization
The information amassed from the surveys and complemented with the indicators given by INEG (2000a; 2005) and CONAPO (2001) shows that the population of the 32 localities in Pahuatlán in 2005 was 18,287, concentrated in the administrative centre (Pahuatlán de Valle, 3050 inhabitants), San Pablito (2760 inhabitants), Xolotla (2390), Atla (1685) and Tlalcruz de Libres (1002); the other localities had fewer than 1000 inhabitants each.
Its population grew by 1970 inhabitants between 2000 and 2005, this being a 2.1% rate of annual growth. 32.8% of the inhabitats are illiterate and 49% (8987 inhabitants) speak an indigenous language (Náhuatl or Otomí). The large proportion of indigenous peoples in the municipality indicates that it is a place where the traditional cultural values have been transmitted and preserved. It is an environment where clothing, mystic and religious beliefs, crafts and use of plant medicines have for centuries resisted the powerful cultural influences from elsewhere (Valderrábano et al., 2004).
It is a young population structure, since 44.4% of the inhabitants are less than 15 years old, a fact that is related to emigration, since 10% of the population have left in search of a better quality of life. The municipality has a birth rate of 32.7%, a death rate of 6.6% and an infant mortality rate of 15.6%.
Of the 3877 dwellings in the municipality, 69.7% have a supply of drinking water and 86.4% have electricity, but only 44.4% have drainage and 41.3% have a laid floor; 67.5% of the dwellings are overcrowded.
The economy of Pahuatlán is based mainly on primary activities, with 84.3% of the economically active population being involved in this sector. There is a high subdivision of the land, with the data from the last two agricultural censuses (INEGI, 1970 and 1991) showing an unequal size distribution of the production units; in 1970, 90% of the workers were small producers and owned 26% of the productive land. In contrast, the owners of areas exceeding 5 ha represented 10% of the owners and owned 74% of the arable land. In 1990, the number of smallholdings grew to 5% more than were recorded in 1970 (95% of the agricultural areas). The parcels of land exceeding 5 ha at present are continuing to concentrate the greater percentage of cultivated land (64%) in few units (18%). The productive units have increased by 70% in the past decade at the expense of the forested area; this is considered to be a response to the pressures of population growth and to the conditions attendant on the struggling economy. If the process of land fragmentation continues it could contribute to a greater impoverishment of the population, since the parcels of land will not allow the family units to be self–sufficient. It will also encourage emigration and the spread of land exploitation which will lead to deforestation and deterioration of the environment.
In 30 of the 32 localities there is a critical situation in the consumption of wood, since the already high number of users of this resource for domestic purposes is increasing even more. The environmental effects of this activity can be important; however, the surveys show that clandestine felling for commercial gain causes more deterioration of the forest resource, since the gathering of firewood concentrates on collecting branches, dead wood and oak species that can regenerate vegetatively from their stumps. The municipality has been characterized since the colonial era by a pattern of scattered settlements where most of the inhabitants are engaged in agriculture, a situation that in responding to economic and environmental conditions is also linked to the cultural patterns of the ethnic peoples (Rojo, 2007).
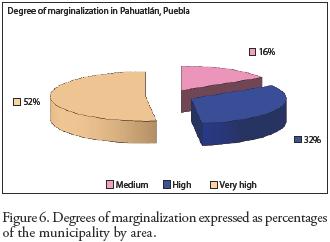
The conditions of marginalization in the municipality are evident. There is a severe lack of services that meet the basic needs of the population, so that marginalization is medium in five of the localities (1799.95 ha), high in 14 (2824.31 ha) and very high in 13 (5084.99 ha) (Figure 6). The spatial distribution of this social marginalization was mapped (Figure 7).
STATISTICAL ANALYSIS OF THE RELATIONSHIP BETWEEN EROSION AND MARGINALIZATION
A cross–classification of the 32 localities (Table 1) investigates the relationship between the degrees of erosion and marginalization in the municipality; 31.3% of the localities with very high marginalization are in areas with very severe erosion, 21.9% of those with high marginalization are in areas with severe erosion, and only 9.4% of those with medium marginalization are in areas with moderate erosion.
Figure 8 shows graphically the number of localities according to the degree of marginalization and erosion; when the erosion is very severe there is the highest number of localities with very high marginalization, in the areas with severe erosion the populations with high marginalization predominate, and with moderate erosion medium marginalization predominates.

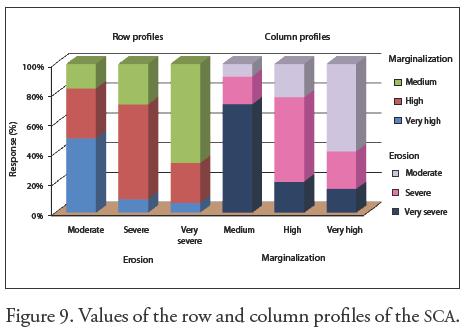
Simple correspondence analysis (SCA) helps to establish more clearly the relationship between the variables evaluated, and to show the graphic representation of the phenomenon (Linares, 2006). The results of this statistical analysis are presented below.
Figure 9 shows the values of the row profiles and the strong association between moderate erosion (50%) and medium marginalization, between severe erosion and high marginalization (63.6%) and between very severe erosion and very high marginalization (66.6%). The column profiles (Figure 9) again show the link between the two phenomena, since when marginalization is medium 60.2% of the erosion is moderate, when marginalization is high 53.8% of the erosion is severe, and when marginalization is very high 71.5% of the erosion is very severe.
A two–dimensional solution explains 100% of the variation (Table 2). The rates of inertia of the two dimensions are 67.81% and 32.19%, respectively.
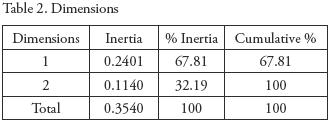
Table 3 shows that in the row profiles moderate erosion contributes 65.9% of the inertia in the first dimension while very severe erosion contributes 33.5%. Since its coordinates have opposite signs, this is interpreted as 'moderate erosion is opposed to very severe erosion'. Similarly, severe erosion contributes 65% of the inertia of the second dimension while very severe erosion contributes 19.6%. In this dimension, severe is opposed to very severe, since the coordinates have opposite signs. With regard to the quality of the representation, the first dimension represents very well the degrees of moderate and very severe erosion. In the second dimension there is an almost perfect representation of severe erosion, and their association with this is close, so that the interpretation of the second dimension is reduced to severe erosion.
Table 4 shows that in the column profiles the degree of medium marginalization contributes 62.7% of the inertia of the first dimension while very high marginalization contributes 35.6%, and the two are opposed since their coordinates have opposite signs. High marginalization contributes 57.7% of the inertia of the second dimension while medium marginalization contributes 21.6%. With regard to the quality of the representation, the first dimension respresents medium marginalization with 85.9% and very high marginalization with 78.4%, so that the two are associated with this dimension. In the second dimension high marginalization is associated almost perfectly with 94.3%.
A spatial representation of the information and results of Tables 4 and 5 yields a perceptual map (Figure 10) showing the relative proximities of the degrees of marginalization and the degrees of erosion. Medium marginalization is associated with moderate erosion, very high marginalization with very severe erosion, and high marginalization with severe erosion.

In order to confirm the above interpretations, the Chi–square test of independence (Infante and Zárate, 2000) took as decision rule the following: the null hypothesis of independence between erosion and marginalization is not rejected if the calculated Pearson Chi–square statistic is less than the value assigned by the tables, according to a significance value (α) of 0.05; in the opposite case, the hypothesis is rejected.
Table 5 shows the contributions of the Chi–square test, establishing that the high values of the medium–moderate, high–severe and very high–very severe indicate the strong relationships in these pairs of variables. The value of the Chi–square total calculated is 11.29 and the value in tables with four degrees of freedom and significance level at 0.05 is 9.4877, so that the Chi–square value calculated is greater; hence, according to the decision rule the null hypothesis is rejected and the alternative hypothesis is accepted. This proposes that there is a statistical relationship between the degree of erosion and the degree of marginalization in the municipality of Pahuatlán, Puebla.
CONCLUSIONS
On the basis of these results it is concluded that the municipality shows evidence of various degrees of erosion owing, among other things, to the poor management to which the soils have been subjected for decades, added to the mountainous conditions of the region and the intense deforestation prompted by the clandestine sale of timber, the collecting of firewood and the introduction of agricultural activities. Some zones originally deforested have developed secondary vegetation that decreases the erosion process. The principal limiting factors for agricultural use of the soils and the ecosystem of the municipality are the marked gradient, the great extent of deforestation, the high rainfall, the pre–sent erosion and the use of methods of exploitation that are unsuitable for slope ecosystems, as well as the increase in population density, since this increases the pressure for physical space, forcing the rural workers to use lands that are unsuitable for agricultural use and to overwork them in order to obtain the greatest possible returns, accelerating even more the erosion process. Under these conditions there are diminished returns, greater marginalization and more migration, since they undermine the existing way of life and the future opportunities for subsistence for a significant part of the population that lives in the study area; the soil degradation constitutes a leading obstacle to the increase of agricultural productivity that should represent the foundation of the subsistence of the rural workers in the region and the corner–stone of the strategies of reduction of poverty and marginalization of any population.
Of the 32 localities of the municipality of Pahuatlán, 30 are considered to be rural, and 41% of these have very high marginalization, 44% high and 15% medium. 47% are in zones with very severe erosion, 34% with severe erosion and19% with moderate erosion. 65.75% of the economically active inhabitants receive less than the minimum salary, a fact that has encouraged emigration from the municipality. The marginalization that prevails in the region is associated with a fragile environment under constant erosion, which exacerbates their socio–economic vulnerability. The main crops are maize, beans and chili, and these are sown without the use of soil conservation measures even though 43% of the persons surveyed were aware of these.
The statistical analysis reveals a relationship between the degree of erosion and the degree of marginalization in the municipality. It is also shown by the nearness of the points of the variables in the graphic representation of the simple correspondence analysis and this is confirmed by Pearson's Chi–square. Nevertheless, a causal relationship can not necessarily be assumed, since a correlation must not be confused with causality. This is not to say that causality does not exist, since fundamentally there are many cases in which marginalization causes erosion and vice versa; they are cause and effect at the same time, making it difficult to discern which of these phenomena acts as cause and which as effect. The key is that, in fact, there is no one unequivocal relationship between marginalization and erosion; there are many factors that intervene, such as the cultural traditions, the system of access to the land, the population density and, most particularly, production methods that are inappropriate for the mountainous ecosystem of the region. For this reason, these factors should be analysed from a holistic point of view.
In addition, the lack of public policies appropriate for the conditions of the population and the region impedes investment in works of soil conservation and improvement, accentuating this vicious circle in Pahuatlán, where the deterioration of the natural resources generates more marginalization and this in its turn further degrades the environment. Hence, once this relationship has been demonstrated, it is imperative that effective strategies be designed that generate a real impact on the environment and on the quality of life of the population, in order to achieve the sustainable use of the resources of the region.
REFERENCES
Azorín, F. and C. Sánchez (1996), Métodos y aplicaciones del muestreo, Ed. Alianza Universidad, España. [ Links ]
Becerra, M. A. (1999), Escorrentía, erosión y conservación de suelos, Universidad Autónoma de Chapingo, Mexico. [ Links ]
Carabias, J. (2001), "Conservación de los ecosistemas y el desarrollo rural sustentable en América Latina: condiciones, limitantes y retos", La transición hacia el desarrollo sustentable, INE, México, pp. 257–280. [ Links ]
Castelán, V. R. (2003), Diagnóstico de la erosión de los suelos rojos del Noroeste de la Sierra Norte de Puebla. Alternativas de manejo, Masters Thesis, Departamento de Investigación en Ciencias Agrícolas, Benemérita Universidad Autónoma de Puebla, México. [ Links ]
Castelán, V. R. (2009), Estrategia de manejo integral de los recursos naturales de la subcuenca del río San Marcos, Puebla: enfoque para un desarrollo sustentable, Doctoral Thesis, Departamento de Investigación en Ciencias Agrícolas, Benemérita Universidad Autónoma de Puebla, México. [ Links ]
CONAPO (2001), Metodología de estimación del índice de Marginación, Consejo Nacional de Población, México. [ Links ]
Consejo de Recursos Minerales (1995), Monografía geológico–Minera del estado de Puebla, SECOFI, México. [ Links ]
FAO (1980), Metodología provisional para la evaluación de la degradación de los suelos, Roma. [ Links ]
Fuentes, P. (1972), Regiones naturales del estado de Puebla, UNAM, México. [ Links ]
Gliessman, S. (1998), Agroecología, Edit. CATIE, Costa Rica. [ Links ]
INEGI (1970), V Censo Agrícola, ganadero y ejidal, Instituto Nacional de Estadística, Geografía e Informática, México. [ Links ]
INEGI (1991), VII Censo Agrícola, ganadero y ejidal, Instituto Nacional de Estadística, Geografía e Informática, México. [ Links ]
INEGI (2000a), Censo general de población y vivienda 2000, Instituto Nacional de Estadística, Geografía e Informática, México. [ Links ]
INEGI (2000b), Síntesis geográfica del estado de Puebla y anexo cartográfico, Instituto Nacional de Estadística, Geografía e Informática, México (cd–rom). [ Links ]
INEGI (2005), II Conteo de Población y Vivienda 2005, Instituto Nacional de Estadística, Geografía e Informática, México. [ Links ]
Infante, G. S. and G. Zárate de Lara (2000), Métodos estadísticos. Un enfoque interdisciplinario, Trillas, México. [ Links ]
León, M. A. (2002), "Diagnóstico socioeconómico de comunidades indígenas", Reporte Técnico de avances de Investigación del Subproyecto Evaluación Socioeconómica del Proyecto Manejo Sostenible de Laderas (PMSL), IV Reunión del Comité Técnico de Coordinación y Seguimiento del Proyecto Manejo Sostenible de Laderas (PMSL), Colegio de Postgraduados, Banco Mundial, SAGARPA y Gobierno del Estado de Oaxaca, Montecillo, Estado de México, pp. 57–82. [ Links ]
Linares, F. G. (2006), Análisis de datos multivariandos, Edit. BUAP, Facultad de Computación, México. [ Links ]
Maass, M. M. (1998), "Erosión de suelos en México", Destrucción del hábitat, PUMA–UNAM, pp. 271–285. [ Links ]
Morgan, R. P. C. (1997), Erosión y conservación del suelo, Edit. Mundi–Prensa, Madrid. [ Links ]
MINITAB Release (2005), Statistical Software, Minitab Inc. [ Links ]
Porta, C. J., R. M. López Acevedo and C. Roquero (1999), Edafología para la agricultura y el medio ambiente, 2a. edición, Edit. Mundi Prensa, España. [ Links ]
PRECESAM (2002), Encuesta nacional a hogares rurales de México, Ed. Programa de Estudios del Cambio Económico y la Sustentabilidad del Agro Mexicano, México. [ Links ]
Rojo M., G. E. (2007), Reseña de "Enfoques de la pobreza rural en México", de Estrella Chelín, N., B. Ramírez Valverde y A. González Romo, Ra Ximhai, septiembre–diciembre, vol. 3, núm. 3, pp. 831–836. [ Links ]
Ruiz Careaga, J., E. Calderón and V. Tamariz (1999), Manual para la descripción de perfiles de suelos y evaluación del entorno, Textos BUAP, Puebla, México. [ Links ]
Ruiz Careaga, J., V. Tamariz and E. Calderón (2001), La erosión de los suelos en la Sierra Norte de Puebla, Textos BUAP, Puebla, México. [ Links ]
SEMARNAT (2003), Informe de la situación del medio ambiente en México, Compendio de Estadísticas Ambientales, SEMARNAT, México. [ Links ]
SEMARNAT (2004), GEO México, Perspectivas del medio Ambiente, Edit. INE, México. [ Links ]
FAO (1980), Metodología provisional para la evaluación de la degradación de los suelos, Roma. [ Links ]
Valderrábano, A. M. L., R. Hernández, M. Rebollar, U. Maza, V. Oliva and R. Durán (2004), "Pahuatlán: armonía con la naturaleza en peligro", CONVERSUS, IPN, noviembre, pp. 1–7. [ Links ]
Worthen, E. and S. Aldrich (1990), Suelos agrícolas, UTHEHA, México. [ Links ]

