


Serviços Personalizados
Journal
Artigo
 Inglês (pdf)
 Artigo em XML
 Referências do artigo
 Enviar este artigo por email
Indicadores
-
 Citado por SciELO
 -
 Acessos
Links relacionados
-
 Similares em
SciELO
Similares em
SciELO
Compartilhar

 Permalink
Investigaciones geográficas
versão On-line ISSN 2448-7279versão impressa ISSN 0188-4611
Invest. Geog no.70 Ciudad de México Dez. 2009
The heat spells of Mexico City
Las ondas de calor en la Ciudad de México
Ernesto Jáuregui*
* Centro de Ciencias de la Atmósfera, Universidad Nacional Autónoma de México, Circuito Exterior, Ciudad Universitaria, 04510, Coyoacán, México, D. F. E–mail: ejos@atmosfera.unam.mx.
Abstract
The warning of urban air has been documented to increase in intensity and area as cities grow (Oke, 1982). As the cities grow the so called "heat island" tends to increase the risk of more frequent heat waves as well as their impacts (IPCC, 2001). Threshold values to define a heat wave vary geographically. For the case of Mexico City located in a high inland valley in the tropics, values above 30° C (daily maximum observed for three or more consecutive days and 25° C or more as mean temperature) have been adopted to define the phenomenon. These events occur at the end of the dry season during March to May when afternoon relative humidity is quite low (~20%) and thus reducing the stress. Maximum temperature data from the Observatory of the National Meteorological Service were used. Results show that during the second half of the XXth century the frequency of heat waves as defined above has doubled from 6 events/decade to 16/decade in the 1990s with a marked increase in the last third of the last century when population of the city grew from 8.5 to 18.5 million (CONAPO, 2000). During this time the average urban/rural contrast grew considerably from about 6° C to 10° C (Jáuregui, 1986). While these heat waves may be considered as "mild" they receive attention from the media and prompt actions by the population to relieve the heat stress. Application of heat indices based on the human energy balance (PET and PMV) result in moderate to strong heat stress during these events. Because climate change is expected to raise nighttime minimum temperatures more than daytime highs (as suggested by the IPCC, 2001) urban heat islands and their related heat waves are likely to be a significant health concern in days to come in large urban centers especially in the developing countries.
Key words: Heat waves, heat island, tropics.
Resumen
El calentamiento de aire urbano se ha documentado ampliamente tanto en el aspecto de su intensidad como en la extensión del fenómeno (Oke, 1982). A medida que crecen las ciudades se experimenta un aumento en la temperatura. Las ondas de calor tienden a aumentar el riesgo de una mayor morbilidad en la población urbana (IPCC, 2001). Los valores límite para definir una onda de calor varían geográficamente. Para el caso de la Ciudad de México (que se encuentra a 2 250 msnm en los trópicos) se ha adoptado 30° C como valor límite cuando se presente durante tres días consecutivos o más y una temperatura mínima de 25° C como promedio. Estos eventos ocurren al final de la estación seca durante los meses de marzo a mayo, cuando la humedad relativa alcanza un mínimo (~20%), lo cual favorece el estrés por calor. En este trabajo se han utilizado datos de temperatura máxima del Servicio Meteorológico Nacional (SMN). Los resultados muestran que durante la segunda mitad del siglo XX la frecuencia de los eventos de ondas de calor se incrementó de 6 a 16 en los años noventa, con un marcado crecimiento de la población de la capital de 8.5 a 16.5 millones de habitantes (CONAPO, 2000). Durante este tiempo el contraste promedio urbano/rural se consideraba de 6 a 10° C (Jáuregui, 1986). La aplicación de índices de calor basados en el balance energético (PET, PMV) señalan que el impacto a la población puede ser de ligero a moderado durante estos eventos. Ya que el cambio climático global va a significar un aumento en las temperaturas nocturnas (IPCC, 2001), es probable que aumente la incidencia de estos fenómenos.
Palabras clave: Ondas de calor, isla de calor, trópicos.
INTRODUCTION
The warning of the urban atmosphere is a universal phenomenon that has been shown to increase in intensity and extent as cities grow (Oke, 1982). As noted by Oke (1993) the observed changes in the thermal climate of cities (or heat island effect) have to be intimately linked to global climate change. The combined global/local climate change will have diverse impacts health —most of them on the negative side—. Changes in the frequency of extreme heat together with local air pollution, a common case in large cities of the developing world, would affect population health disorders. Since the impact of these events is multifactorial it is rarely correctly reported.
If heat waves increase in frequency, as is the case in this paper, the risk of death and serious illness is likely to increase mainly in older age groups and especially in the urban poor who constitute a large sector of the population in Mexico City. While the greatest increase in thermal stress is expected for mid–latitude cities, thermal stress mortality in cities located in the tropics may be also significant. However, there has been little research in such populations.
In this paper, after a characterization of a heat wave is proposed, a climatology of such events occurring in a large urban area located in the tropics is made.
THE DATA
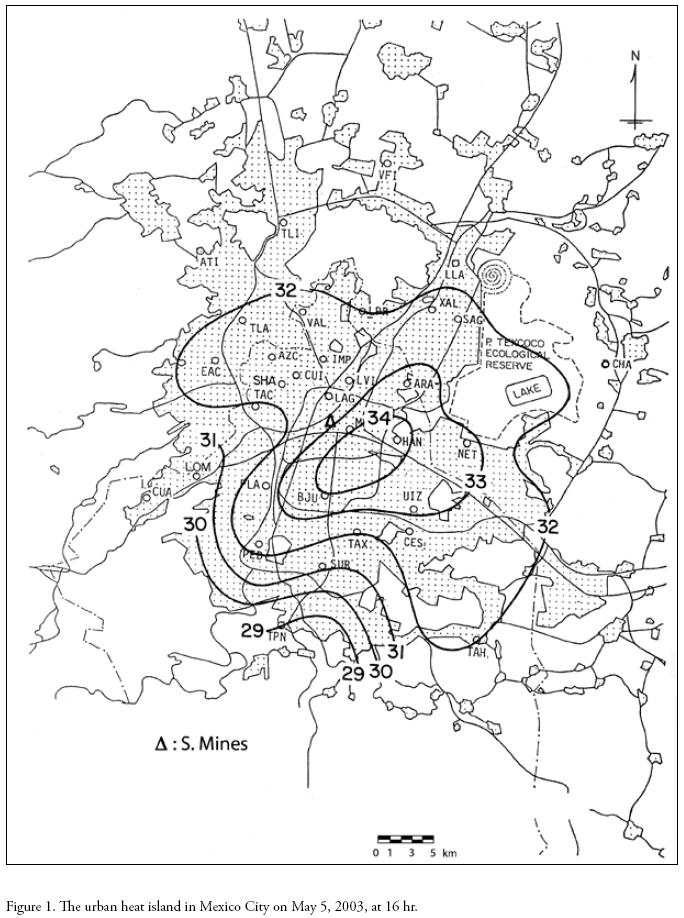
Daily maximum temperature series registered at the Tacubaya Observatory located to the west of downtown were used for period 1877–2000. Another climatological data series from a station situated in the old central quarters (School of Mines) were used for period 1995–2004 (see Figure 1 for location).
THE CLIMATE AND METHOD
Mexico City is located in the tropics (19° 30' N) in an elevated (2 250 masl) inland valley. The climate is subhumid tropical tempered by altitude. Typical anticyclonic weather prevailing during the dry period (November to April) contributes to frequent surface inversions. Dust storms and warm temperatures characterize the climate during March to May when relative humidity is markedly low allowing relatively free perspiration.
Threshold values to define a heat wave vary geographically. The definition of a heat wave adopted by WMO is a 3–or–more–day hot spell of 32.2° C (90° F) or higher. For the Mexico City case this definition was not suitable because it occurs too infrequently in the maximum temperature series. From the author's experience the population begins to take actions to relieve the heat stress when the thermometer reaches 30° C. Therefore values above 30° C observed for three or more days and a mean daily temperature equal or greater than 24° C have been adopted to define the phenomenon.
This proposal is identical to the one adopted by the Atmospheric Environment Service for Toronto, Canada (Lewis, 1993) having both definitions the limitation of not taking directly into account the effect of humidity in determining the heat stress produced by a heat spell.
Not withstanding the above mentioned limitation, 'heat waves' so defined are likely to produce a considerable heat stress (as measured by widely applied bioclimatic comfort indices) in Mexico City, as will be illustrated in this paper.
RESULTS
a) Frequency and duration of heat spells.
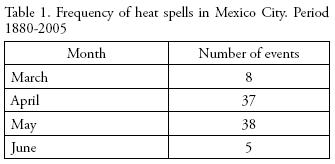
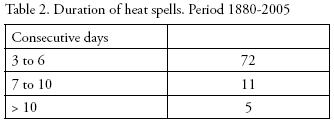
Table 1 shows that heat spells are more frequent during the April–May period, while they mostly lasted from 3 to 6 days (Table 2).
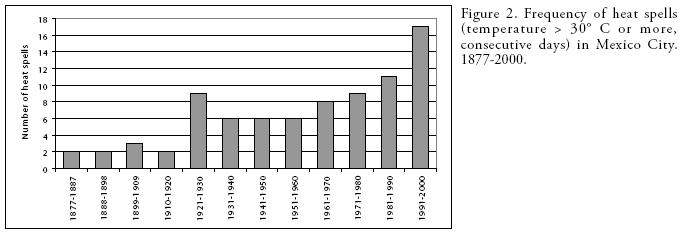
b) Long–term trend of heat waves.
Figure 2 shows that the decadal frequency of heat waves in Mexico City displays a marked increase particularly during the second half of the 20th century when the capital city experienced an accelerated growth.
c) Geographical extent covered by the heat island during a heat spell.
Figure 1 shows the maximum temperatures observed at 4 pm during the May 5th event in year 2003. Isotherms are drawn using the air quality monitoring network operated by the city's Environmental Agency.
d) Some case studies to illustrate the characteristics and impact of heat spells on the population.
In order to evaluate the degree of stress related to hot spells in Mexico City two widely applied indices based on the human energy balance were applied: Fanger's PMV (1972) and the physiological equivalent temperature or PET proposed by Hoeppe (1999). Personal variable were adapted to local conditions as follows (Tabla 3).
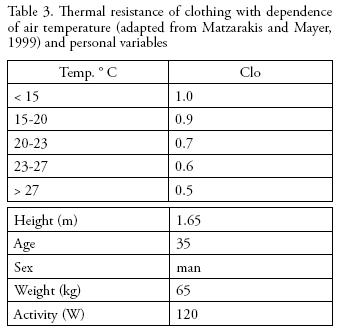
Medium level of activity was fixed at 120 W for a person walking in an open suburban space during around maximum temperature occurrence (around 15:00 hr local time). Clothing was adjusted according to prevailing meteorological conditions with temperature as controlling factor.
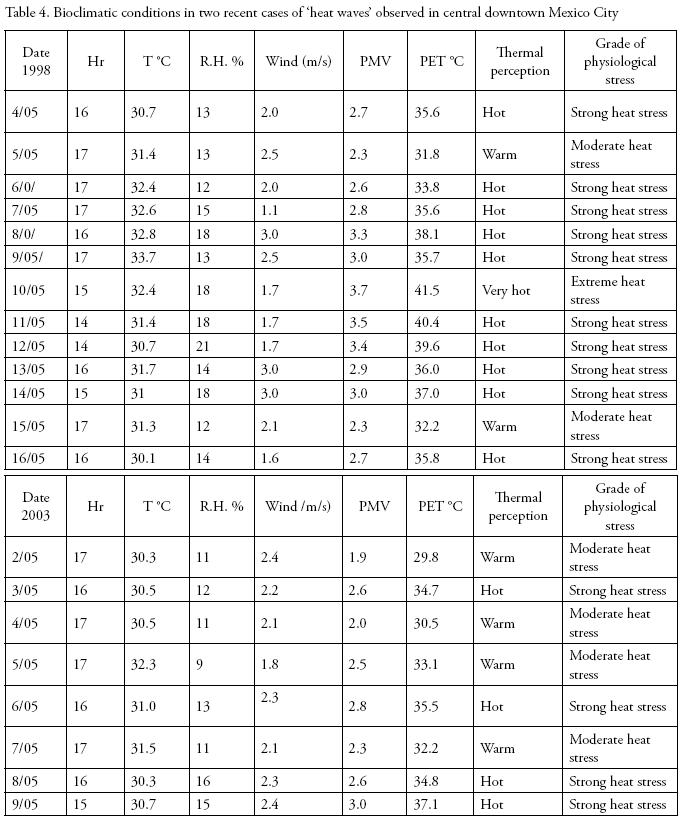
Table 4 describes the characteristics of two typical recent heat waves as observed from the station School of Mines located close to the heat island chore. While maximum temperatures remain around 30 to 32° C, the very dry air and light wind, the thermal perception according to PET and PMV comfort indices varies from warm to hot leading to moderate to strong heat stress during most events.
CONCLUDING REMARKS
Warm weather occurs in Mexico City in the last months of the dry season. In order to characterize the heat spells, a definition of a heat wave has been adopted as a period of three or more consecutive days with a maximum temperature greater than or equal to 30° C and a mean temperature >24° C. This definition is similar to the one developed by Lewis (1993) although applied to a location having quite a different climate. Using the above definition a considerable large number of heat spells were identified to occur in the century long temperature series available. Decadal analysis of heat spells indicate that these events increased from 6/decade in the 1950s to 16/decade in the 1990s. The longest (15 day long) heat spell event was observed in the El Niño year of 1998 (Table 4) which was globally the warmest year of the 1990s decade (WMO, 1999). While these events may be considered as mild (maximum temperatures do not reach beyond 35° C in dry air) moderate to strong physiological heat stress, result when applying universal comfort indices (eg. PET, PMV) to the heat wave data. It is suggested that the observed change in the frequency of this heat spells is linked to increasing urbanization, the quasi–periodic ENSO phenomenon and to global climate change.
ACKNOWLEDGMENTS
The authors is grateful to Elda Luyando for the calculation of thermal indices and heat wave data, Mario Casasola for data processing and Alfonso Estrada for drawing the map.
REFERENCES
CONAPO (2000), Consejo Nacional de Población, Secretaría de Gobernación, México. [ Links ]
Fanger, P. O. (1972), Thermal comfort, Mc Graw–Hill, New York. [ Links ]
Hoeppe, P. (1999),"The physiological equivalent temperature", Int. J. Biommeteorology, no. 43, pp. 71–75. [ Links ]
IPCC (2001), Climate change: impacts, adaptation and vulnerability, WMO/UNEP, Cambridge, UK. [ Links ]
Jáuregui, E. (1986), "The urban climate of Mexico City", WMO Proceedings of Tech. Conf. on Urban Climatology and it s applications with special regard to tropical areas, no. 652, pp. 63–86. [ Links ]
Lewis, P. (1993), "Defining and measuring the intensity of heat waves —the incorporation of the humidity factor", Proceed. 13th Int. Congress Biometeorology, Calgary, Canada, pp. 540–553. [ Links ]
Matzarakis, A., H. Mayer and M. Iziomon (1999), "Application of a universal thermal index", Int. J. Biometeorology, no. 43, pp. 76–84. [ Links ]
Oke, T. R. (1982), "The energetic basis of the urban heat island", Quart. J. Royal Meteorol. Soc., no. 10, pp. 1–24. [ Links ]
Oke, T. R. (1993), "Global change and urban climates", Proceed. 13th Int. Congress of Biometeorology, Calgary, Canada, pp. 123–124. [ Links ]
WMO (1999), WMO statement on the status of the Global Climate Change in 1999, WMO No. 913, Geneva. [ Links ]

