


Servicios Personalizados
Revista

Articulo
 Inglés (pdf)
 Artículo en XML
 Referencias del artículo
 Enviar artículo por email
Indicadores
 Citado por SciELO
 Links relacionados
-
 Similares en
SciELO
Similares en
SciELO
Compartir

 Permalink
Investigaciones geográficas
versión On-line ISSN 2448-7279versión impresa ISSN 0188-4611
Invest. Geog no.58 Ciudad de México dic. 2005
Geografía física
Analysis of the short term geo-environmental evolution of an endorreic basin using satellite images: the case of Tecocomulco Lagoon, Mexico
Análisis de la evolución geoambiental de corto término de la cuenca endorreica usando imágenes de satélite: el caso del Lago de Tecocomulco, México
Guadalupe de la Lanza Espino* y Gabriela Gómez Rodríguez**
* Instituto de Biología, UNAM, Cd. Universitaria, Circuito Jardín Botánico, 04510, Coyoacán, México, D. F. E-mail: gdele@servidor.unam.mx
Recibido: 4 de noviembre de 2004
Aceptado en versión final: 23 de junio de 2005
Abstract
The Great Basin of the Valley of Mexico was composed of several lagoons that have disappeared due to their geologic evolution and anthropogenic activities. The Tecocomulco lagoon, Hidalgo, is a relict of that basin and has undergone extreme changes in its size and water composition during geologic periods; however, climatic changes, the deforestation of the sub-basin and the agricultural activities have modified its morphology, area and depth, leading to a great accumulation of sediments that fill up the lagoon. The estimate of changes in the lagoon's surface through five decades (1975, 1985, 1990, 2001, 2002) was the objective of the present work using satellite images, jointly with an environmental interpretative analysis. The factors that have modified the Tecocomulco lagoon are: climate, the contribution of a high load of sediments to the sub-basin, agricultural activities and their interaction, to such a degree that its disappearance is very likely, following the same trend as other lagoons of the Great Basin of Mexico.
Key words: Tecocomulco lagoon, satellite images.
Resumen
La Gran Cuenca del Valle de México estuvo formada por diferentes lagunas que han desaparecido en su evolución geológica y por actividades antropogénicas. La laguna de Tecocomulco, Hidalgo, es un relicto de aquella cuenca, que ha experimentado cambios extremos en sus dimensiones y composición hídrica durante periodos geológicos; sin embargo, cambios climáticos, la deforestación de la subcuenca y la agricultura han modificado ampliamente su morfología, superficie y profundidad, consecuencia del gran aporte de sedimentos y el azolvamiento lacustre resultante. La estimación de los cambios en la superficie del lago en cinco años de diferentes décadas (1975, 1985, 1990, 2001, 2002) fueron el objetivo de este trabajo, para ello se utilizaron imágenes de satélite, conjuntamente con un análisis ambiental interpretativo. Los factores que han modificado a la laguna de Tecocomulco son: clima, aporte de sedimentos de la subcuenca y agricultura que se sinergizan, al grado de su posible desaparición, como ha sucedido en los otros lagos de la Cuenca del Valle de México.
Palabras clave: Lago de Tecocomulco, imágenes de satélite.
INTRODUCTION
The Great Basin of the Valley of Mexico wasconstituted by several lagoons and lagoons;being some of the most important: Texcoco,Xaltocan, Zumpango, Chalco, Xochimilco,Apan, Tochac, Tecocomulco, among othersmaller ones which have already disappeareddue to many natural and human related causes.
Tecocomulco Lagoon is a relict of that greatbasin with dynamic geological and hydrological characteristics that have caused manyimportant changes since > 42 000 years before present times (BP) (Caballero et al. unpublished): there have been cold, wet and dryperiods, the forest composition has sufferedmany changes as has quite conspicuously, the level of the lagoon.
According to Caballero et al. (unpublished), the lagoon originated after a devastating eruption approximately 50 000 BP, anduntil around 42 000 years BP it was moderately deep, with fresh slightly acidic water,abundant aquatic vegetation and surroundedby large conifer forests (Pinus, Alnus and Abies)in a damp and cold climate. Between this lastdate and 25 000 years BP, there were periodswith opposite characteristics: the lagoon became shallower, the water became slightlyalkaline, the weather turned warm and even dry, and the forest with a dominance of herbaceous species reduced in area. Based onpalynologic records, these authors indicatethat there is no information for some periodsdue to the absence or scarcity of pollen in thestratigraphic column. They also mentionthe tendency to a reduced tree coverage during the time when the level of the lagoon washigh, indicating there was human influencein the area during the Early Medium Formative Period (1 500 – 500 BP).
According to Ruiz-González (2000), theexogenous processes that give shape tothe actual landscape are:
1. Water erosion:
a) laminar, in flat areas and slopes with vegetation
b) lineal, in furrows and abundant gullies.
2. Wind erosion, which affects the whole subbasin.
3. Anthropogenic erosion, which is the mostactive.
According to this author, erosion is heterogeneous depending on the region. Areaswith vegetation and a slope less than 2%, canloose 0.2 cm/year of soil, on the other hand,those with no vegetation and slope above 2%can reach linear erosion values of 3.6 cm/year.A model of the average value of soil loss in theentire sub-basin would reach 40 000 tons that could be transported by different erosiveagents to the flood plain of which the lagoonis part. Considering the current depth of thelagoon (60 cm) and a rate of 3.6 cm/year, itcould become completely silted in around 18years. The author also indicates that this period of time could vary because the erosiveprocess varies depending on the precipitationand evapo-transpiration intensity which canbe different every year. Moreover, the agricultural management of the lagoon must beincluded, because water extracted for cropirrigation, reduces the area of the lagoon thatcould eventually recuperate, both in surfaceor depth.
The wide variations in water table and in the reservoir expansion are the result notonly of the lagoon's own evolution, but of climatic changes on a small (inter-annual) andlarge (geological periods) scale; today, humanactivities have also accelerated the sedimentation rate and, consequently, the rapid disappearance of the lagoon. Nevertheless, thissedimentation enlarges the areas predisposedto be covered by water during the rainy season, flooding surfaces that go beyond thelagoon's littoral, just as Ayala-Castañares et al. (1969) have stated occurs in other aquaticsystems, a fact that is more notorious duringclimatic events that include very high precipitation rates or during extreme droughtsby erosion and wind transportation (Ruiz-González, 2000).
This research analyzes changes that havetaken place, at a small time scale, on the surface or cover of Tecocomulco Lagoon, usingsatellite images from the years 1973, 1985,1990, 2000 and 2002.
STUDY SITE
Tecocomulco Lagoon is located on the northeastern region of the Great Basin of the Valleyof Mexico and represents 5.59% of its totalarea, as part of a sub-basin measuring564 km2 (Comisión Nacional del Agua, CNA,for its initials in Spanish, 2002; Figure 1, 2),located between 19° 53' N and 98° 21' W (central parallel and meridian), within a basinfound at 19° 03' - 21° 11' N and 98° 11' - 99° 30' W, in the central-eastern part of the TransMexican Volcanic Belt (Alatriste-Vilchis et al., unpublished). This basin has a tectonic volcanic origin, bordered by several faults thatrun in a NNE – SSW direction (García Palomoand Macías, unpublished). The bathymetryof the lagoon is flat, with high plasticity claysand dispersed hard clays, with surrounding volcanic structures which are the source of volcanic sediments: lava, breccias and ashes of lithologic composition that vary from basaltic to rhyolitic, with ages that range fromthe Late to the Recent Pliocene Period. Intemperism has taken place on the superficial rocks possibly facilitated by regional fractures moving on an E-W direction (CNA,2002).
The Tecocomulco sub-basin is endorreic, with a dendritic drains pattern, and fourmain fluvial contributions (rivers: Cuatlaco,Sarabia, Toronjil and Tepozan; Figure 3) whichdo not carry much water due to a low precipitation rate, high evaporation and soil permeability. There are several natural springsin the basin, located mainly in at the southeastern part (Ruiz-González, 2000). Most ofthe runoffs are intermittent, with heavy avenues carrying large amounts of sedimentsfrom the deforested mountain slopes. Tecocomulco Lagoon receives, in average, a meanvolume of water from runoffs of 1.4 million cubic meters from June to September, concentrating 88% of the drains. A decrease of 3.0 m,equivalent to a yearly average of 0.30 per year,was observed in the static level (CNA, 2002),from 1987 to 1999.
According to CNA calculations of 2002,with a precipitation of 669 mm and an infiltration rate of 2.8%, an aquifer area measuring 365.12 km2 would have an infiltrated volume of 6.83 Mm3/year, plus the infiltration ofsuperficial water which is 1.59 Mm3/year, resulting in a total volume of natural water recharge of 8.42 Mm3/year. In storage rate of theaquifer, the total input of water to the lagoonconsiders the 8.42 Mm3/year, and the horizontal flow of 19,35 Mm3/year, which results in avolume of 27.770 Mm3/year with the following losses or outputs: water pumped out, ,13.109 Mm3; natural discharges 0.50 Mm3, = 13.929 Mm3/year.
Inputs – outputs = storage rate of theaquifer
27.770 –13.629 = 14.141 Mm3 per year.
The lagoon has an elongated and irregular shape, and a variable surface; Ruiz-González (2002) calculates a surface of approximately 27 km2. Sediments have a volcanic, fluvial and windswept origin, a mixture that depends on the main activity (volcanicor weather related). The basin is surroundedby volcanoes, calderas, cinerític conus and the Tepozan and Chichicuautla Mountains (Figure 4).
There are four weather subtypes:
a) to the south, temperate sub-humidwith rain in summer.
b) to the northeast, temperate subhumid with rain in summer and a "canícula" (two rain periods separated by two dry periods).
c) to the southeast, temperate subhumid with rain in summer, and a slightly cold summer.
d) to the west, temperate sub-humidwith rain in summer, with a "canícula", slightly cold summer, isothermal (Ruiz-González, 2000).
The highest precipitation occurs from Juneto September (70%), with a yearly averageprecipitation of 550 mm (in the plains) to1 117 mm (in the mountains). Due to the climatic inter-annual variability and to the different methodologies used to calculate theevapotranspiration (which take into consideration: precipitation, humidity, temperatureand winds, and vegetation), results in general differ widely. Nevertheless, the CNA(2002) has calculated an annual potentialevaporation of 1 413 mm and a precipitationof 669 mm. Temperature varies according totopography: high in the plains and low in themountains, with a mean yearly average of13.5º C. The highest evapo-transpiration takesplace in spring and summer, with a meanannual rate of 550 mm and a maximum in the lower region.
In 1950, the Secretaría de Recursos Hidráulicos built a canal which nowadays issilted (allowing the lagoon to maintain itsvolume), originally designed to allow the flowof water only when there was an excess ofrain. Nevertheless, a study done by a company (Ariel Consulters, 2003) indicates thatthis canal still drains practically all yearround, except in February and March whenthere is no water flow. In July and August(rainy season) it reaches up to 240-260 l/s.Agricultural workers have also built canalsboth for irrigation and for draining the water out of their plots, as a consequence sedimentation was promoted and a water tabledecreased.
The mean flow at the San Jerónimo station (SW of the study area) has been calculated in 4 098 Mm3/year (0.130 m3/s), with arun off tendency to increase, not becausethere is more precipitation but because therehas been an increase in deforested areas that retain less water, causing the infiltrationto diminish and evaporation to increase(Huízar-Álvarez et al., unpublished). ROMACO (1999), indicates that the mean annualrunoff is 37 336.35 Mm3, minus the 2 718.24 Mm3 mean yearly that are drainedout, which leaves 34 618.11 Mm3 in the lagoon; if we subtract the amount that evaporates, which is 28,404.75 Mm3, the result is 6 213.36 Mm3 per year.
However, according to the ComisiónNacional del Agua (2002), the lagoon has atendency to recharge naturally from waterof the Tepozan Mountain; it is also estimatedthat the rate of recharge is higher than therate of extraction by agricultural activitiesand evaporation rates. The water table is located less than five meters deep and the staticdepth is shallow.
MATERIAL AND METHODS
Five satellite images corresponding to the dryand rainy seasons were used to analyze andquantify the changes in the surface of theTecocomulco lagoon. The Instituto de Geografía at the Universidad Nacional Autónoma de México (IGG-UNAM) provided threeLandsat MSS images (November 23, 1973,October 30, 1985 and November 21, 1990), afourth image −Landsat ETM + of March 21, 2001 (all images of dry seasons)− was also provided by IGG-UNAM, and the most recent one, of the Landsat ETM+ type, was acquired by the U:S. Department of the Interior,the U.S. Geological Survey (USGS; August2002). This last one was co-registered to the2001 image by means of the PCI 8.0 program.
The outline of the lagoon was drawn onscreen with the 73, 85, 90 and 2001 imagesusing Arcview GIS 3.2, then the surface of the water body in different years was calculated (Figure 5).
The 2002 image was first worked with analgorithm of principal components, and, subsequently, with a non-supervised classification, to obtain not only the lagoon's outlinebut also for to identifying and mappingaquatic vegetation and sediments. All thiswas done with the ENVI 6.0 program.
INEGI's digital elevation model (DEM),with spatial resolution of 100 m, was also usedto delimit the sub-basin. The flow's direction and accumulation were identified using theArc/Info 7.2 program.
Land use and vegetation map from INEGI (1976) and the National Forestry Inventory2000-2001 map were used to assess land use change.
The results were integrated using GIS Arcview 3.2.
a) Landsat Image MSS, November 23, 1973
b) Landsat Image MSS, October 30, 1985
c) Landsat Image MSS, November 21, 1990
d) Landsat Image ETM+, March 21, 2000
e) Landsat Image ETM+ August 2002
f) Landsat Image ETM+ 2002 classified
g) Map of change land use and vegetation, INEGI 1976, 2000-2001 for the sub-basin.
RESULTS AND DISCUSSION
Changes in coverage and water volume in Mexican lagoons and lagoons have been caused by their own geological origin and evolution, as well as to the world's climate change between Eras, and, at a different time scale due to inter-annual climatic variations. In some cases, the study of the Tecocomulco Lagoon has been based on the stratigraphic analysis of the geological, structural and mineral composition, as well as on the palynological composition, all of which have provided information about long periods of time (e.g., García-Palomo and Macías unpublished; Alatriste-Vilchis et al., unpublished; Caballero et al., 2002; Huízar-Álvarez et al., unpublished), which allow to infer that Tecocomulco originated as a paleolagoon during the Pleistocene Period (1.6 million years B.P.). Since 42 000 years B.P. it has experimented a series of great changes in its dimensions and the water's physical and chemical characteristics as a result of tectonics and weather.
Nevertheless, information acquired over short time periods (inter-annual) can indicate important changes in the geomorphology and dimensions of Tecocomulco lagoon, especially those related to weather and accelerated by human activities, as can be seen in four decades (Table 1).
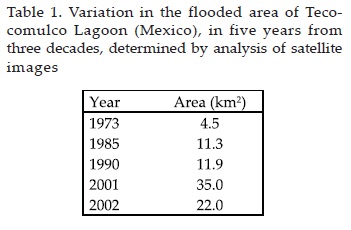
It is remarkable that in 1973 the area was six times smaller (4.5 km2) that the surface reported by Ruiz-González (2000) in 1999 (27 km2), with the lagoon presenting a very irregular configuration. Based on the morphology presented by this author, the 1973 image (Figure 5) indicates that the area which lost the highest volume of water and was most silted was the NW area, which corresponds to the foot of the mountain, between the "La Paila" and "Del Viejo" hills (both of which belong to the Chichicuautla Mountain), the most eroded section and the source of sediments (> 12 ton/km2/year, Huízar-Álvarez et al. unpublished), and the place where the lagoon receives more direct tributaries. It must be said that in 1972-73 there was a strong draught associated with the "El Niño" phenomenon, (maximum) according to the NOAA scales (2004) that affected the entire country; thus, it is possible to consider that this climatic phenomenon had to do with the significant decrease in the lagoon's water. In support of this, Ruiz-González (2000) indicates that during 1996 and 1997 there was almost no rain and that in 1998 the lagoon dried completely, El Niño occurred during these years and was considered one of the most severe events in the 20th century.
The loss of water from evaporation and evapo-transpiration in anomalous years, as El Niño, must be significant not only for the lack of rain but also for high temperatures, with increases of 1 to 3° Celsius in summer, depending on the site.
According to Ruiz-González (2000), from 1981 to 1994 there was a tendency of the drain to increase, although oscillations due to draughts and severe rainfall can be associated with phenomenon El Niño that have a certain periodicity, as can be seen in Figure 6.
According to NOAA (2004) the most important climatic events are:
• 1973 El Niño (strong), high evaporation rate with a decrease in precipitation and runoff (Figure 5a)
• 1982-83 El Niño (strong), high evaporation with a decrease in precipitation and runoff.
• 1984-85 La Niña (strong), increase in precipitation and runoff (Figure 5b).
• 1986-87 El Niño (from moderate to strong), evaporation > runoff.
• 1988-89 La Niña (strong), increase in runoff.
• 1990-93 El Niño (from moderate to strong), high evaporation rates with a decrease in precipitation and runoff (Figure 5c).
• 1995-96 La Niña (weak), increase in runoff (Figure 5d).
• 1997-98 El Niño (strong), high evaporation rates with a decrease in precipitation and runoff (Figure 5e).
• 1999-2001 La Niña (from moderate to strong), increase in runoff.
• 2002 El Niño (weak), increase in evaporation.
All this data can be compared to degree of desiccation and water cover in Tecocomulco lagoon.
The images for 1973, 1985 and 1990 (Figure 5) show that the desiccated areas which had a high degree of silting are associated with the two most important permanent rivers: the Tepozan to the east, with its water held by the Tezoyo Dam, and the Cuatlaco river to the southwest, which feeds the Benito Juárez dam. The Sarabia river, which passes through the El Viejo hill, is seasonal and feeds the lagoon only during the rainy season, as it infiltrates during the dry periods. It should be mentioned that there is a natural underground exit to the southwest, through faults and fractures.
It has been considered that the piezometric level has been variable, with zero depth at the level of the lagoon, becoming deeper as it moves away from it; this is, when the elevation increases. The Comisión Estatal del Agua del Estado de Hidalgo (2003) mentions piezometric depressions of the order of 14 cm/ year indicating that there was some slight water exploitation, or less rain, between 1990 and 1997 coinciding with Ruiz-González (2000) in the lack of rain, also as a consequence of the El Niño. Present CNA's calculations (2003) regarding the balance of underground water indicate a slight over exploitation, as is shown in Table 2, and is corroborated by the piezometric depressions.
In spite of Ruiz-González (2000,) who indicates that the Cuatlaco river is the only one feeding the lagoon throughout the year, the images for 1973, 1985 and 1990 show that the place where the river discharges is also where more surface has been lost; this can be the result of water management through the dam for agricultural purposes. In 1973, the advance of agriculture in terms of land was not evident as a cause for the reduction in the lagoon's surface for irrigation purposes or for gaining land from the lagoon's own body through the construction of small dams for future agricultural areas. Nevertheless, this study −based on INEGI's cartographies of 1976, and from the Instituto de Geografia of 2000 (Figure 7)− calculates an agricultural increase of 9.3%, as is shown in Figure 8 and, precisely the region where Ruiz-González (2000) indicates, is found the highest concentration of canals built to improve the drainage from agricultural areas and to stop the water from becoming stagnant. Agricultural workers have also built small dams to hold water for irrigation, and which, once dried, will provide extra land from the lagoon, as has happened in the northeastern area. This can be seen in the 1990 and 2000 images (Figures 5).
In the lagoon's southwestern area, there is another desiccated surface that can be associated to the canal built by the Secretaria de Recursos Hidráulicos in 1953 so the lagoon could drain out when the water level rose; this place is very close to the area that remains flooded even during dry years like 1973. It can clearly be seen in Figure 9, and it demonstrates the effect of building the canal and removing sediments on the bottom. The tendency of the surface to grow (expansion from flooding but with a smaller water table and transformed into marshland) has taken place towards the northeastern area, which has a higher alluvial surface used for irrigation and seasonal agriculture.
The tendency of the drain to increase, registered by Ruiz-González (2000) in a 14 year time lapse (Figure 6), from 1980 to 1994, can be corroborated with the tendency of the flooded area to increase from 1973 to 2002 (Figure 5), as can also be seen in figure 9. In 2000, considered as a La Niña year, the surface of the lagoon was calculated on the image, as having 35 km2, against the 27 km2, quoted by the author. It should be said, nevertheless, that the northeastern side had a low water table, referred to as a muddy area (Figure 10) and which borders with the high density (irrigated) agricultural area as well as with the area located to northwest, in the foot of the mountain at the Chichicuautla mountain, which is smaller and has seasonal agriculture. This last area coincides with the highest input of sediments from erosion (between 3.1 to 8.1-12.0 tons/km2, according to Huízar-Álvarez et al., 2003), seen desiccated in the 1973, 1985 and 1990 images, with high possibilities of flooding during periods of intense rainfall, and with shallow depths (muddy areas) as seen in the 2001 image (Figure 10). It is important to state that the heterogeneity in flooded and desiccated areas can be the result, among other things, of the sediments moving to form deltas at a sedimentation rate of 5.7 cm/year, as indicated by Ruiz-González (2000).
CONCLUSIONS
This study concludes that changes in morphology and surface of the Tecocomulco lagoon occur over short periods of time and are associated to weather variations and recurrent phenomena such as El Niño and La Niña; they are also a consequence of the origin of the sub-basin (volcanic), with faults and fractures that have caused a significant infiltration even before deforestation took place, and to the development (in present times) of agriculture, which has increased 9.3% in three decades. By using satellite images we were able to obtain detailed descriptions of the wide variation in the lagoon coverage (which has shifted from desiccation to increase over than eight times the minimum flooded surface), the vegetation cover, the silted areas, and the encroaching of agriculture, showing a precise technique, useful not only to record all of these changes but also useful in the hydrological management of endorreic basins.
REFERENCES
Alatriste-Vilchis, D. R., J. O. Campos-Enriquez, R. Huízar-Álvarez and R. Martínez-Campos (unpublished), "La estructura subsuperficial de la subcuenca de Tecocomulco (noreste dela Cuenca de México)", en Huízar-Ávarez, R. (comp.) Estudios para la conservación y el aprovechamiento sustentable en la subcuenca de Tecocomulco, Hidalgo, México. [ Links ]
Ayala-Castañares, A., A. Jr. García-Cubas, R. Cruz and L. R. Segura (1969), "Síntesis sobre los conocimientos sobre la geología marina de la Laguna de Tamiahua, Veracruz, México", en Ayala-Castañares, A. and F. B. Phleger (comps.), Coastal Lagoons a Symposium, UNAM-UNESCO; México, November 28-30, pp. 39-48. [ Links ]
Caballero, M., S. Lozano, B. Ortega, J. Urrutia and J. L. Macías (unpublished), "El Lago de Tecocomulco: su historia durante los últimos 50 000 años", en Huízar-Álvarez, R. (comp.), Estudios para la conservación y el aprovechamiento sustentable en la subcuenca de Tecocomulco, Hidalgo, México. [ Links ]
Comisión Nacional del Agua (CNA; 2002), Determinación de la disponibilidad de agua en el acuífero Tecocomulco, estado de Hidalgo, México. [ Links ]
Comisión Estatal del Agua, Estado de Hidalgo (2003), Análisis del crecimiento poblacional y económico en la zona aledaña al acuífero de Tecocomulco y sus requerimientos de agua, Informe Técnico, México. [ Links ]
García-Palomo, A. and J. L. Macías (unpublished), "Estratigrafía y geología estructural de la región de Apan: subcuenca de Tecocomulco, estado de Hidalgo", en Huízar-Álvarez, R. (comp.) Estudios para la conservación y el aprovechamiento sustentable en la subcuenca de Tecocomulco, Hidalgo, México. [ Links ]
Huízar-Ávarez, R., O. Campos-Enríquez and L. M. Miltre-Salazar (unpublished), "Evaluación hidrogeológica de la subcuenca de Tecocomulco, estados de Hidalgo, Puebla y Tlaxcala, México", en Huizar-Álvarez, R. (comp.), Estudios para la conservación y el aprovechamiento sustentable en la subcuenca de Tecocomulco, Hidalgo, México. [ Links ]
Huízar-Álvarez, R., G. de la Lanza-Espino, J. Ruiz-González and S. Hernández-Pulido (2003), "Azolvamiento del Lago de Tecocomulco, México, por cambios en el uso del suelo no planificado. Una propuesta de manejo", Tercer Congreso Latinoamericano de Manejo de Cuencas Hidrográficas, Libro de Resúmenes, Arequipa, Perú, 8-13 de junio de 2003, INRENA-FAO-Ministerio de Agricultura-Embajada Real de los Países Bajos. [ Links ]
NOAA (2004), www.srh.noaa.gov/tbw/information/nino.htm. [ Links ]
ROMACO (1999), Recopilación y Análisis de Información para la Cuenca Hidrográfica para la Laguna de Tecocomulco, Construcciones, Mantenimiento y Proyectos, México. [ Links ]
Ruiz González, J. E. (2000), Evaluación de la erosión en la subcuenca de Tecocomulco, estados de Hidalgo, Puebla y Tlaxcala, México, tesis de Licenciatura, Facultad de Filosofía y Letras, UNAM, México. [ Links ]

