


Serviços Personalizados
Journal
Artigo
 Inglês (pdf)
 Artigo em XML
 Referências do artigo
 Enviar este artigo por email
Indicadores
-
 Citado por SciELO
 -
 Acessos
Links relacionados
-
 Similares em
SciELO
Similares em
SciELO
Compartilhar

 Permalink
Investigaciones geográficas
versão On-line ISSN 2448-7279versão impressa ISSN 0188-4611
Invest. Geog no.55 Ciudad de México Dez. 2004
Geografía física
Methodology for prediction of corn yield using remote sensing satellite data in Central Mexico
Metodología para la estimación del rendimiento de maíz utilizando datos de sensores remotos satelitales en el Centro de México
Jesús Soria-Ruiz* Yolanda Fernández-Ordóñez** Rebeca Granados-Ramírez***
* Instituto Nacional de Investigaciones Forestales, Agrícolas y Pecuarias (INIFAP), Vialidad Adolfo López Mateos, Km. 4.5 Carretera Toluca-Zitácuaro, 51350, Zinacantepec, Estado de México. E-mail: soria.jesus@inifap.gob.mx
** Colegio de Postgraduados en Ciencias Agrícolas, Km. 35.5 Carretera México-Texcoco, 56230, Montecillo, Estado de México. E-mail: yfernand@colpos.mx
*** Instituto de Geografía, UNAM, Circuito Exterior, Cd. Universitaria, 04510, Coyoacán, México, D. F.
Recibido: 25 de agosto de 2003
Aceptado en versión final: 5 de octubre de 2004
Abstract
The main goal of agricultural crop management in any country is to guarantee food resources for its population. The heterogeneity of corn-growing conditions in many countries, especially in Mexico makes accurate predictions of yield ahead of harvest time difficult. Such predictions are needed by the government to estimate, ahead of time, the amount of corn required to be imported to meet the expected domestic shortfall. In this paper, therefore, a methodology for the estimation of corn yield ahead of harvest time is developed for the conditions of intensive production systems in central Mexico. The method is based on the multi-temporal analysis of NOAA-AVHRR satellite images, and uses normalized difference vegetation indices (NDVIs), Degree-Days (DDs) and Leaf Area Indices (LAIs) to predict corn occurrence and yield. Results of the application of the methodology to successfully identify sites with corn, and to predict corn yield in Central Mexico, are presented and discussed.
Key words: Remote sensing, corn, yield, prediction, Mexico.
Resumen
El principal reto de la agricultura en cualquier país, es garantizar la producción de alimentos para su población. La heterogeneidad de condiciones de cultivo del maíz en muchos países, especialmente en México, hace más difícil hacer predicciones de sitios de ocurrencia y de rendimiento antes de la cosecha. Las predicciones anticipadas a la cosecha son necesarias al gobierno para estimar la cantidad de grano que requiere importar con el fin de afrontar los déficit de producción. Por ello, en este artículo se desarrolla una metodología para la estimación anticipada a la cosecha del rendimiento de maíz, bajo las condiciones de sistemas de producción intensivos en el Centro de México. El método se basa en el análisis multi-temporal de los índices de vegetación normalizados (NDVI) de imágenes de satélite NOAA-AVHRR, grados-calor (DD) y los índices de área foliar (LAI) para predecir ocurrencia en maíz y su rendimiento.
En este artículo se discuten los resultados de la aplicación de una metodología generada para identificar áreas de siembra de maíz y predecir su rendimiento en el Centro de México.
Palabras clave: Sensores remotos, maíz, rendimiento, predicción, México.
INTRODUCTION
Optical remote sensing techniques in particular are well suited for agricultural applications, because the techniques are able to provide information on the actual status of crops at different growth stages via their spectral signatures. Yield prediction ahead of harvest time is associated with the capacity not only to identify the crop species of interest, but also to determine values for agronomic variables such as maturity, population density, vigour, disease, and weed infestation. These agronomic variables can be used as yield indicators upon which crop growth models are based (Clevers et al., 1994). Accurate crop yield estimation therefore relies on the availability and quality of actual crop status data.
NOAA-AVHRR (Advanced Very High Resolution Radiometer) satellite images provide a spatial resolution of 1.1 km2 in the visible and infrared spectrum bands and offer a short temporal coverage cycle of one take every 12 hours. A number of studies have used such satellite images for the monitoring of crop development (e.g. Watts and Saiz, 1996) and for the characterization of natural vegetation (e.g. Saiz et al., 1996) in Mexico. The quality of the results in these types of studies depends on different factors, including the accurate determination of areas of coverage of the crops of interest through their spectral signatures.
Information concerning the status of crops can be obtained through vegetation indices (Vis; Tucker, 1979). These are functions that measure crop reflectance in terms of the ratio of the visible to the near-infrared bands. Research by Tucker et al. (1985) and Goward et al. (1991) shows that the VIs derived from the NOAA-AVHRR sensor have been effective in determining the spatial variation and pheno-logical changes in vegetation. Although several VIs have been defined (Jackson and Huete, 1991), the most commonly used is the NDVI (normalized difference vegetation index), defined as NDVI = (IRc - Vis)/(IRc + Vis), where IRc is the near infrared band and V is the visible red band (Schowengerdt, 1997). Techniques to improve the use of NDVIs are being developed, for example, to normalize multi-temporal NDVIs derived from NOAA AVHRR data for atmospheric effects (Potdar et al. 1999).
However, despite advances in crop yield prediction models, the applicability of such models is limited to particular crops, cultivation practices, and growing conditions, and no one model has proved to be of general applicability in all conditions (Gommes, 1998). In addition, there is recognition that an integral part of predicting yield lies in the accurate identification of growing sites and measurement of crop sown area, prior to using VI-based methods to measure and predict crop growth and yield (Gommes, 2001).
Therefore, the general objective of the research line into which this paper is inserted has been to develop a series of methodologies for the determination of growing sites and yield prediction of different crops in Mexico. Earlier research has revealed the need to obtain better spectral signatures in order to be able to accurately determine the extent and spatial distribution of crop and vegetation species for any current agronomic cycle (Soria, 1999; Soria and Fernández, 2002). This paper adds to the work contained in its predecessors by developing a methodology for determining growing sites and yield prediction of the corn crop in Mexico, using NDVI data derived from NOAA-AVHR satellite images and determinations of leaf area indices and degree-days, and tested against field-based measurements of crop yield. A leaf area index is the area of green leaf per unit area of ground; degree-days is a unit for physiological time, the amount of heat needed by an organism to develop. Corn was selected as the crop of interest for this study on account of its economic and social significance and its central role in sustaining the Mexican population.
The work is made more imperative by the knowledge that rich agricultural land in Mexico is quickly receding due to the pressure exerted by urbanisation, industrialisation, and rapid population growth. This has been coupled with the effects of international trade agreements, whereby large agricultural enterprises contribute to land use changes that favour profitable crops demanded by foreign markets but which are detrimental to the staple basic crops such as corn, which must then be imported (Grennes, 1992). Adequate planning for corn importing requires knowing ahead of harvest-time as accurately as possible what the domestic demand will be, as better prices can be negotiated for larger volumes ahead of time.
Deriving the spectral signatures for corn crops in Mexico is difficult as the cultivation plots vary in size, shape, topography and the cultivation characteristics are also varied (Soria et al, 1998). In addition, in Mexico as in other developing countries, agricultural crops do not occupy the same sites year by year and are grown under different irrigation regimes. For this reason, in this work it was necessary to determine with different anticipation dates the type of crop or coverage through a discriminant analysis, in addition to the yield prediction for corn.
With corn, the closer the plants are to the flowering stage the more accurate is the yield prediction (Soria and Fernández, 2002). However, for national planning purposes, the flowering stage is inconveniently late (close to harvest), so there is great interest to have acceptably accurate predictions as far ahead of the flowering stage as possible. A previous version of this methodology was tested by the same author which did not include the use of some variables. Therefore the objective of this paper is to specifically consider the following: a) Determining sites of occurrence of corn in Central Mexico through NOAA-AVHRR satellite images; b) Predicting yields ahead of harvest time based on multi-temporal analysis of NDVI derived from NOAA images, and degree-days; and c) Identifying in advance the type of coverage on the basis of NDVI through a discriminant function.
CROP YIELD PREDICTION
The main goal of agricultural crop management in any country is to guarantee food resources for its population. At the global level the goal is to adequately feed 6 billion people, a number which will very likely double by year 2050. Several factors can cause food shortages, resulting in famine or in triggering of economic crises. Crop yield prediction ahead of harvest time and involving large regions is therefore an important issue for many countries. Crop yield prediction entails the application of crop growth models and crop yield models. However, there is a large variety of models and a number of problems associated with them.
Some crop growth and yield models rely on computer simulation and include weather-related variables; others are statistical estimation models based on multiple regression equations. Studies on understanding crop yield models are exemplified by the Large Area Crop Inventory Experiment LACIE (MacDonald, 1984). No single model, however, has proven satisfactory in all conditions. For example, the usefulness of some of the process-oriented models such as CERES (Larrabee and Hodges, 1985), WOFOST (Diepen et al., 1989), and EPIC (Williams et al., 1984), is limited due to the fact that they were developed in specific research contexts and for areas sometimes as small as a single field. They have to be used in combination with other geostatistical and geographic information manipulations to provide input to the regression models typical of yield functions. The leading crop simulation models have been deemed as being too complex to be of widespread applicability for crop forecasting systems (Gommes, 1998).
Remote sensing has been used to furnish input data for the models. Spectral vegetation indices have been developed in an attempt to correct for atmospheric and soil spectral effects on remotely-sensed data (Broge and Mortensen, 2002). The spectral vegetation index (VI), which is a measure of the total green biomass at any given time, has been related to grain yields as reported in Potdar et al. (1993).
The normalised difference vegetation index (NDVI) can be computed from red and near infrared reflectance data available from LANDSAT-TM, SPOT, and NOAA-AVHRR satellite images. The NDVI has been used largely to derive phenological information for large areas where ground data are not available.
Parameters of growth profiles show close physiological analogy with determinants of yield. The NDVI has been shown to be highly correlated with the final grain yield of cereals around the time of maximum green leaf biomass development (Tucker et al., 1991). For example, the peak value of the NDVI profile at the time of peak occurrence is analogous to the maximum leaf area index (LAI).
Crop production forecasting using satellite images over large areas has been performed in different places for different crops. In India, NOAA-11 AVHRR data have been used to model and evaluate wheat crop growth rate and yield using a method of atmospheric normalisation (Kalubarme et al., 2003). The Hungarian Agricultural Remote Sensing Program developed an operational methodology to assess crops and forecast yield at county level, incorporating information from preexisting farming information systems (Csornai et al., 1999).
Satellite-based crop yield models for large areas and the generation of national statistics have been developed for several countries: Argentina, Brazil, the Republic of South Africa, Morocco, Poland, Hungary, Kazakhstan, India, and China. AVHRR-based models were accepted by the Polish government as official tools for cereal yield diagnostics (Unganai and Kogan, 1998). Successful crop yield modelling for maize has been reported for the Corn Belt in the USA (Hayas and Decker, 1996).
The relevant findings of these studies show that the models are specific to both crop and location, and that the forecasts can be acceptably accurate provided the sown areas are precisely determined. Indeed, recent reports of applications in Asia have concluded that the use of vegetation indices can be disappointing unless the sown areas are well estimated (Gommes, 2001).
SCOPE AND APPLICATION OF THE STUDY
The research reported in this study constitutes a first step to forecasting corn yield over large areas using high radiometric resolution satellite image data under the growing conditions of intensive production systems in central Mexico. In general, existing procedural methods of yield prediction, such as EPIC or WOFOST, are unable to properly model these growing conditions. Research aimed at the better calibration of growth models in real-world conditions is required, since many models behave appropriately only under ideal conditions in experimental stations, or are otherwise restricted in applicability to a limited range of physical, climatic, and crop-growing conditions (Ibid.). In addition, good estimates of crop sown area through high resolution images are needed if soundly-based estimates of crop yield are to be obtained.
Current and accurate sown area determination is especially important when there is a high rate of change of crop typology from season to season, such as for corn crops in Mexico. Additional complexities arise because the spatial properties of plot areas can also vary, due to the growth of cities and the transformation of rural areas to semi-urban or urban. Corn plots can range in size from very large (300 ha) in the northern part of Mexico to very small (0.5 ha) in the central and southern parts of the country. In addition, plots often have irregular shapes. In many regions a limited irrigation regime may be practised for some crops such as maize; under limited irrigation, also known as semi-irrigation, a crop will receive one pre-sowing irrigation and an auxiliary one after the crop emerges. Due to climatic variations and to the fact that over 70% of the sown areas depend solely on seasonal rain, farmers sow at different dates even within the same region. Another important consideration is the lack of a well structured national farm information system to provide sound crop data from the farmers themselves (Fernández and Soria, 2002). Higher resolution satellite images such as NOAA-AVHRR, which have a higher radio-metric resolution (1 024 grey levels vs 256 for Landsat ETM), offer a good alternative for estimating crop area offer a first alternative towards predicting crop occurrence and yield under certain conditions.
The monitoring of crops and resources is of concern to all countries, particularly developing countries whose economies are heavily based on agricultural activities. The twin technologies of remote sensing and geographical information systems have allowed for the development of operational systems to support political decisions and to advance knowledge and understanding of the dynamics of phenomena such as the advancement of urban areas, periurban agriculture, migration, new ruralities, desertification, sustainable agriculture, precision agriculture, international competitiveness, and marketing (Ibid.).
In Mexico, as in many developing countries, these phenomena are very dynamic and contribute to the inter-seasonal variation in crop typology and in plot size and shape distributions. The application of modern remote sensing technologies at the national level in Mexico, however, has barely started. Nevertheless, the government is keen on the development of such technologies and their use for monitoring crops, in order to improve agricultural statistics and associated policy and planning decision-making. Official statistics, upon which governmental policy and planning decisions are made, are recognised as inaccurate and outdated, some of them blatantly so (Soria et al., 2003). The work reported in this paper is expected to provide a means by which corn sown area and yield in Mexico can be better estimated, and upon which better policy and planning decisions can be made.
MATERIALS AND METHODS
The framework for the development of the methodology for the determination of growing sites of corn crops and yield prediction in Mexico had two major phases: a) identification of the sites where corn was growing and the measurement of cultivated area; and b) yield prediction. Figure 1 graphically outlines the general approach and the methodology reported in this paper, including the various components of the methodology as described in the following sections.
STUDY SITE
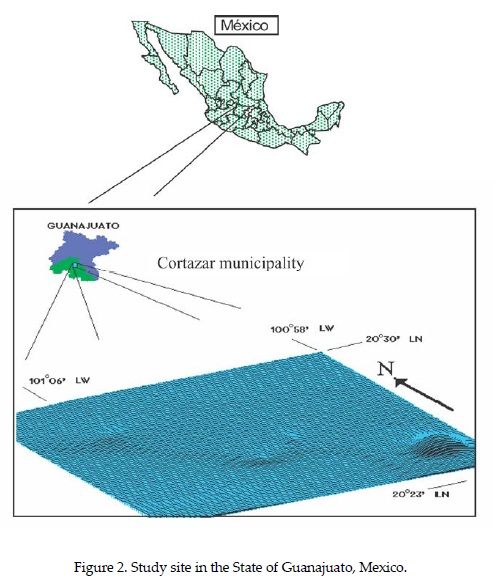
The study took place in a leading corn-producing and rather flat zone in the State of Guanajuato, Mexico. The site selected is one of the few regions in Mexico characterized by extensive corn crops. We considered this relevant for the more accurate determination of the spectral signatures that are used to determine coverage type and thus areas sown with corn. The site is within the Rural Development District (DDR) 05 located in Cortázar, Guanajuato, between parallels 20° 23' 00" and 20° 30' 00" of North latitude and meridians 100° 58' 00" and 101° 06' 00" and covers an area of 15 840 he (Figure 2). Field work took place during the 1997 spring-summer agricultural cycle.
Satellite images and digital mask
We used 20 NOAA-AVHRR cloud-free satellite images, corresponding to the May-October period of the 1997 spring-summer agricultural cycle. A digital mask in vectorial format was chosen in order to georeference outstanding physical features and to delimit the site under study using a commercial GIS tool.
Preliminary analysis
A preliminary analysis step included data about the corn crop, climatic data, and terrain characteristics. Data from the producing units were obtained directly through interviews of an initial sample of farmers willing to participate in the study.
The following items were considered relevant in selecting the pilot plots: (a) The corn-producing system, including the name of the commercial company that generated the seed genotype, the crop density, the topolo-gical arrangement, the supplies used, and the yields obtained from a six-year historical series; (b) Climate characterization using the historical record of a 40-year-long series of official data; and (c) A digital elevation model generated using a 90 m unit interval. (d) An additional requirement for this study was that each plot should exceed an area of 80 has. This is justified in the following section.
Pilot plots selection
In the study area, the individual plots range in size between 80 and 110 has, and are separated among themselves only by irrigation channels. As a whole, they form a compact maize surface covering over 15 000 has (Figure 2). This zone guaranteed that any selected pixel was surrounded by maize, diminishing the positioning error of ± 1 pixel of NOAA-AVHRR images.
After demarcating and characterizing the site under study, we selected six pilot plots representative of corn-producing systems under limited irrigation, as well as two additional auxiliary sites, one with sorghum and the other with semi-bare soil. The characteristics of the selected corn crop pilot plots are shown in Table 1, including information about sowing date, plant density, and corn yield.

Leaf area index measurement
Field measurements of leaf area index (Botkin, 1986) started 30 days after sowing and were suspended during the physiological maturity stage.
Satellite image processing and NDVI acquisition
A first image processing step, using the GIS software tool, was utilized to register and pre-process those images to be retained for the study. A second step used the pilot plots and culminated in the obtention of the NDVI from 14 scenes over the crop cycle, covering the period from may to october, applying the equation: NDVI = (Channel 2 - Channel 1)/ (Channel 2 + Channel 1) where Channel 2 is the near infrared band (IRc) and Channel 1 is the visible red band (V) with NOAA images (Soria et al., 1998). This procedure was performed from the date of the first scene (June 20) and ended at the physiological maturity stage, in order to determine the NDVI variations during the corn crop cycle.
The NDVI values were interpolated from two scenes, one previous and one after the date when a LAI measurement was taken on the field on the pilot plots.
Determination of degree-days
The calculation of degree-days (DDs) enables plant development to be related to a pheno-logical crop stage (Wilson and Barnett, 1983). Daily climate information was obtained from two meteorological stations located in the study area. In order to determine DDs of the crop cycle, maxima, mean, and minima average temperatures from a 10-year historical series were used; the physiological method, recommended for corn cultivation, was used for this purpose. The threshold temperatures ranged from a lower limit of 10°C to an upper limit of 35°C (Ortiz, 1987). The DD calculations were made from the date of crop emergence on April 15, to October 31.
Determination of occurrence sites and yield prediction
With the multi-temporal data from the vegetation indices (NDVIs) of six pilot corn plots, the DDs, and the correlations of the pilot plot NDVI measurements with sampled pixels, it was possible to determine the corn cultivation sites and to predict grain yield. The sample size was 20% (29 pixels) of the total area under study.
The predictions made were compared with field data from the plots corresponding to the sampled pixels. This assessment was made during the physiological maturity stage, and allowed the degree to which the predictions were over or under-estimated to be determined. Finally, through a discriminant analysis, the best anticipation date of the prediction made was determined.
RESULTS AND DISCUSSION
Vegetation index and leaf area index
As revealed in Table 2, the trend of both the LAI and the NDVI was the same in all plots P1-P6. Namely, both variables increase until the flowering stage, after which they tend to decrease. In addition, higher values of LAI and the NDVI at the flowering stage are associated with higher yields. Such is the case of plot P6, which reported the highest grain yield, and whose LAI and NDVI values in the flowering stage were 9.72 and 0.56 respectively (Table 2).
In this regard, Díez (1993) reported that the LAI value for mature corn plants of 2.5 meters in height averages 4.33, and that an LAI higher than 5 is estimated to be needed for the soil to be totally shaded. However, when the crop is affected by a lack of water during the flowering stage, yield is drastically impaired, as occurred with plot P3. Despite having achieved LAI and NDVI flowering values similar to the other plots, this plot returned a smaller yield in comparison with the regional average.
The LAI:NDVI ratio for the emergence period to the flowering period for each of the pilot plots is shown in Table 3. The linear regression models obtained for each plot showed adjusted R2 values ranging from 0.86 to 0.99, which indicates a high correlation between LAI and NDVI. These two variables are related to plant vigour status and the production of biomass of the plants.
Degree days and grain yield
Table 4 shows the degree-days (DDs) obtained in the pilot plots. Plots P1, P3, P5, and P6 reached physiological maturity on the last sampling date. Plot P3 required 1764 DDs of development; in comparison, plot P6 needed 2 567 DDs, corresponding to the highest value observed for the six pilot plots.
There is a close relationship between DD and grain yield, with a determination coefficient (R2) of 0.97. Ortiz (1987) has shown that DDs have been related to phenological development stages with very good results and that with this variable it is possible to date the different stages of the growth cycle of a plant. Our results confirm this for the corn crop.
Table 5 summarizes the NDVI behaviour of 20% of the pixels from the total of 144 that comprised the area under study, by reporting the NDVI obtained in the sampled pixels and DDs accumulated at six dates occurring after June 20. These data show that the average NDVI values for each of the dates follow a normal distribution and that the maximum response occurred on August 20, coinciding with the crop flowering stage. The greatest variation occurred on July 5 (a = 0.09). It is possible that this coverage reflectance variation was caused by the dynamics of crop growth and development, as well as by soil humidity and environmental interferences.
Yield prediction
In order to predict the type of coverage and the corn grain yield, we analyzed the correlation coefficients between the NDVI values of the pilot plots and the NDVI of the pixels in the sample. Table 6 shows these correlation coefficients. The entry that shows the highest correlation indicates that all the attributes of the corresponding plot will be assigned to the corresponding pixel. To provide an example, by observing the correlation values for pixel 3.0 (row 1, Table 6), the highest correlation coefficient was obtained in pilot plot P2. Thus, the attributes of plot P2 are assigned to pixel 3.0.
The yield predictions and the field data for the pixels in the sample are described, for comparison, in Table 7. Due to the assignment explained above, all the assigned attributes of a plot to a pixel comprise the prediction (shaded portions of the rows). The unshaded portion of any row shows the field data once physiological maturity was attained. Continuing to exemplify with pixel 3.0, all the assigned attributes of plot P2 comprise the prediction for this pixel (shaded) and the field data are shown unshaded.
From Table 7, regarding type of coverage, the prediction was accurate in 20 of the 29 sample pixels, an effectiveness of 69%.
Regarding yield prediction, an average value of 13.7 ton.ha-1 of grain was predicted, compared with an average of 12.5 ton.ha-1 verified in the field. This equates to a 9.6% overestimation, which is quite acceptable for large areas.
Anticipated crop occurrence predictions
In order to effectively identify in advance the type of coverage on the basis of the NDVI of the pixels shown in Table 5 and in terms of the information in Table 7 (field data), a discriminant analysis was applied. This multi-variate technique is based on a proposed pre-established classification. To initiate the analysis, the pixels with corn were allocated number "1", and those without were allocated number "2". It should be noted that the analyzed dates correspond to the field data of the emergence stage of corn up to its flowering stage. The results from the discriminant analysis are given for five anticipation dates in Table 8. Of the sample pixels, 19 correspond to corn. An acceptable canonical correlation was obtained for the first three dates analyzed (June 20, July 5, and July 21). However, July 21 also corresponds to the highest number of corn pixels, and from this date onward it is therefore possible to anticipate with greater accuracy the occurrence of corn coverage.
Starting with the pre-established classification, the discriminant analysis determined that 15 of the 19 pixels coincided with corn; in other words, they matched the forecast in 78.9% of the cases. In comparison, for the 10 pixels that did not correspond to corn, eight of them matched the forecast (80% accuracy).
The classification of the results for the third date (July 21) and the mathematical model that explains the Discriminant Function (DF) are given in Table 9, which shows a canonical correlation of 60 % for the function.
CONCLUSIONS
This study has applied a methodology for determining corn crop areas and for predicting yields using information from normalized difference vegetation indices (derived from NOAA-AVHRR satellite images), leaf area indices, and degree-days, for corn crops in Guanajuato, Mexico
Predictions for determining the type of coverage for corn, sorghum, and semi-bare soil showed a 69% effectiveness when compared with coverage type observed in the field. That is, 20 out of 29 pixels coincided with the prediction. Bearing in mind the high degree of heterogeneity of actual corn conditions in the plots, which is characteristic of corn growing conditions and agricultural management in central Mexico, the accuracy of the obtained prediction is considered good.
Yield prediction for corn resulted in a 9.6% over-estimation compared with the average field-measured value. It is probably the best result currently achievable, given that an approach to yield estimation based on multiple, harmonised data sources is not possible in Mexico at present. Such an approach, as has been used in the European Union (Csornai et al., 1999), rely on traditional agricultural statistics collected via well structured national information systems, to produce very accurate estimates of crop yield. Under such circumstances, satellite data and processing result in additional avoidable expenses. In Mexico, however, the national statistics are neither updated as needed nor do they have the required level of precision to be used advantageously in similar forecasting scenarios. Thus, given these circumstances, and combined with the heterogeneous conditions that exist with respect to the Mexican climate, terrain, and crop production systems, we consider our corn yield prediction to be a very acceptable approximation.
The anticipated determination both of the occurrence of corn sites and the corn yield can be made up to a month prior to the flowering stage with a probability of 78.9%. This is an acceptably accurate, timely, and useful piece of information for national policy and planning purposes in Mexico. The methodology established in this study allows the use of higher spatial resolution images which should provide more accurate information. It is applicable to other regions of the country. With this crop yield information, it is feasible to determine the grain volume that the government needs to import in order to supply the consumption requirements of the population. This is of economic significance because the importation of the required corn, ahead of the national harvest time, means a lower price is paid, which in turn imparts important monetary savings for the country.
REFERENCES
Botkin, D. B. (1986), "Remote sensing of the biosphere. National Academy of Sciences", Report of the Committee on Planetary Biology, National Research Council, Washington, D.C. [ Links ]
Broge, N. H. and J. V. Mortensen (2002) "Deriving green crop area index and canopy chlorophyll density of winter wheat from spectral reflectance data", Remote Sensing of Environment, vol. 81:1, pp. 45-57. [ Links ]
Clevers, J. G. P. W., B. A. M. Bouman, C. Büker and H. J. C. van Leeuwen (1994), "A conceptual framework for estimating crop growth using optical remote sensing data", in Remote Sensing and Geographical Information Processing: Concepts and Applications for Land Use Monitoring and Agriculture, Wageningen Agricultural University, The Netherlands. 189-196. [ Links ]
Csornai, G., Cs. Wirnhardt, Zs. Suba, P. Somogyi, G. Nádor, L. Martinovich, L. Tikász, A. Kocsis, Gy. Zelei and M. Lelkes (1999), Crop monitoring by remote sensing, FIG Commission 3 Annual Meeting and Seminar, Budapest, Hungary, 21-23 October, 1999, FÖMI Remote Sensing Centre, Institute of Geodesy, Cartography and Remote Sensing H-1149 Budapest, Bosnyák tér 5. [ Links ]
Díez, P. J. (1993), Introducción a la percepción remota, Colección textos y apuntes/47, Facultad de Geografía. Universidad Autónoma del Estado de México, Toluca, México. [ Links ]
Diepen, C. A. van, J. Wolf and H. van Keulen (1989), "WOFOST: a simulation model of crop production", Soil Use and Management, 5:16-24. [ Links ]
Fernández, O. Y. and J. Soria (2002), "A model and server for concentrating and disseminating agricultural and forestry information in Mexico", World Congress on Computers in Agriculture and Natural Resources, Iguaçu Falls, Brazil, March 13-15. [ Links ]
Gommes, R. (1998), "Agrometeorological crop yield forecasting methods", Proc. Internat. Conf. on Agricultural Statistics, Washington 18-20 March. Holland, T. and P. R. Marcel Van den Boecke (eds.), International Statistical Institute, Voorburg, The Netherlands, pp. 133-141. [ Links ]
Gommes, R. (2001), "Agro-meteorological models and remote sensing for crop monitoring and forecasting in Asia and the Pacific", Report of the FAO Asia-Pacific Conference, Annex VII APDC/01/3. FAO-SDRN. [ Links ]
Goward, S. N., B. Markham, D. G. Dye, W. Dulaney and J. Yang (1991), "Normalized difference vegetation index measurements from the Advanced Very High Resolution Radiometer," Remote Sensing of the Environment, vol. 35, 257-277. [ Links ]
Grennes, T. (1992), Toward a More Open Agriculture in North America, The Fraser Institute. Vancouver, Canada. [ Links ]
Hayas, M. J. and W. L. Decker (1996), "Using NOAA AVHRR data to estimate maize production in the United States Corn Belt", International Journal of Remote Sensing 17:3,189-3,200. [ Links ]
Jackson, R. D. and A. R. Huete (1991), "Interpreting vegetation index", Preventive Veterinary Medicine, vol.11: 185-200. [ Links ]
Kalubarme, M. H., M. B. Potdar, K. R. Manjunath, R. K. Mahey and S. S. Siddhu (2003), "Growth profile based crop yield models: a case study of large area wheat yield modelling and its exten-dibility using atmospheric corrected NOAA AVHRR data", International Journal of Remote Sensing, vol 24, N0. 10, pp. 2037 - 2054. [ Links ]
Larrabee, J. and T. Hodges (1985), NOAA-AISC user's guide for implementing CERES-maize model for large area yield estimation: yield model development, Washington, D.C., U.S. Dept. of Agriculture. [ Links ]
McDonald, R. B. (1984), "A summary of history of development of automated remote sensing for agricultural applications", IEEE Transactions in Geoscience and Remote Sensing, GE-22, pp. 473-481. [ Links ]
Ortiz, S. C. A. (1987), Elementos de agrometeorología cuantitativa, con aplicaciones en la República Mexicana, Departamento de Suelos, Chapingo, México. [ Links ]
Potdar, M. B., S. S. Pokharna and V. N. Sridhar (1993), "Response of vegetation in the Thar Desert to monsoon rainfall: an investigation using NOAA AVHRR and meteorological data", Journal of Arid Environments, vol. 25, Issue 1, pp. 19-26. [ Links ]
Potdar, M. B., K. R. Manjunath and N. L. Purohit (1999), "Multi-Season Atmospheric Normalization of NOAA AVHRR Derived NDVI for crop yield Modeling", Geocarto International, vol. 14, no. 4:52-57. [ Links ]
Saiz, H. J., C. Watts y M. N. Ramos (1996), "Caracterización de la vegetación natural de una cuenca en el noroeste de México mediante imágenes AVHRR de los satélites NOAA", Investigaciones Geográficas, Boletín, núm. especial 5, Instituto de Geografía, UNAM, México, pp. 27-34. [ Links ]
Schowengerdt, R. A. (1997), Remote sensing-models and methods for image processing, Academic Press, San Diego, CA. [ Links ]
Soria, R. J., C. Ortiz S., F. Islas G. y V. Volke H. (1998), "Sensores remotos, principios y aplicaciones en la evaluación de los recursos naturales: experiencias en México", Publicación Especial 7, Sociedad Mexicana de la Ciencia del Suelo, Chapingo, México. [ Links ]
Soria, R. J. (1999), Site determination and yield estimation for maize (Zea mays L.) through remote sensing, Doctoral dissertation in Spanish. Colegio de Postgraduados en Ciencias Agrícolas, Mexico. [ Links ]
Soria, R. J. and Y. Fernández (2002), "Maize crop yield prediction through satellite images and mathematical models", 17O World Congress of Soil Science, Bangkok, Thailand, 14-21 August, Paper No. 1393. [ Links ]
Soria, R. J., E. Gonzalez and M. Rivera (2003), Informe final del proyecto "Determinación del uso actual del suelo del Estado de México", Campo Experimental Toluca, INIFAP-SAGARPA, México. [ Links ]
Tucker, C. J. (1979), "Red and photographic infrared linear combinations for monitoring vegetation", Remote Sensing of Environment, vol. 8:127-150. [ Links ]
Tucker, C. J., B. N. Holven, J. A. Elgin and J. E. McMurtrey (1991), "Remote sensing of total dry matter accumulation in winter wheat", Remote Sensing of Environment, 11, 171-189. [ Links ]
Tucker, C. J., C. L. Vanpraet, M. J. Sharman and Van Ittersum (1985), "Satellite remote sensing of total herbaceous biomass production in the Senegalese Sahel: 1980-1984, Remote Sensing of Environment, vol. 17: 233-249. [ Links ]
Unganai, L. S. and F. N. Kogan (1998), "Drought monitoring and corn yield estimation in Southern Africa from AVHRR data", Remote Sensing Environment, 63:219-232. [ Links ]
Watts, C. y J. A. Saiz (1996), "Monitoreo del desarrollo del trigo en el Valle del Yaqui, Sonora, México usando imágenes NOAA-AVHRR", Investigaciones Geográficas, Boletín, núm. 33, Instituto de Geografía, UNAM, México, pp. 51-61. [ Links ]
Williams, J. R., C.A. Jones and P.T. Dyke (1984), "The EPIC model and its application", in Proc. ICRISAT-IBSNAT-SYSS Symp. on Minimum Data Sets for Agrotechnology Transfer, March 1983, Hyderabad, India, pp. 11-121. [ Links ]
Wilson, L. T. and W. W. Barnett. (1983), "Degree-Days: an Aid in Crop and Pest Management", California Agriculture Magazine, vol. 37:4-7. [ Links ]

