


Servicios Personalizados
Revista
Articulo
 Inglés (pdf)
 Artículo en XML
 Referencias del artículo
 Enviar artículo por email
Indicadores
-
 Citado por SciELO
 -
 Accesos
Links relacionados
-
 Similares en
SciELO
Similares en
SciELO
Compartir

 Permalink
Estudios sociales (Hermosillo, Son.)
versión impresa ISSN 0188-4557
Estud. soc vol.15 no.29 Hermosillo ene./jun. 2007
Artículos
Characterization of inequality and poverty in the Republic of Haiti
Evans Jadotte*
Fecha de recepción: enero de 2006.
Fecha de aceptación: marzo de 2006.
* Profesor investigador, Universidad Autónoma de Barcelona. Departamento de Economía Aplicada. E–mail: evans.jadotte@uab.es
Resumen
Después de aproximadamente veinte años de estancamiento económico acompañado de disturbios políticos, la república de Haití, exhibiendo un PIB per capita en paridad de poder de compra de 1,470 dólares estadounidenses, es actualmente el país más pobre del hemisferio occidental y uno de los más pobres del mundo. El presente trabajo de investigación también revela que es el país más desigual en la región más desigual del mundo, a saber, América Latina y el Caribe (ALC). Amén del carácter endémico de la pobreza en este país, el problema de la distribución de la renta puede representar un verdadero escollo a las perspectivas de crecimiento y, por ende, debería constituir una de las principales preocupaciones de los responsables políticos en sus programas de lucha contra este flagelo. Para trabajo se utiliza la Encuesta sobre las Condiciones de Vida en Haití para estimar el estado de la pobreza y la desigualdad para el periodo 2000/2001. Los primeros resultados destacan, sin sorpresa, que la pobreza es más generalizada en la zona rural mientras la zona metropolitana de Puerto Príncipe acusa las tasas más bajas. El acceso a ciertos factores de producción, tales como la tierra agrícola, no constituye una vía de escape a la pobreza. También se propone una descomposición de la desigualdad en varios ámbitos vía la estimación de mínimos cuadrados ponderados para encuestas complejas. Finalmente, se estima un logit policotómico ordenado para investigar la probabilidad de un hogar de ser pobre o indigente.
Palabras clave: República de Haití, desigualdad, descomposición en múltiples factores, pobreza, estocástico.
Abstract
After nearly twenty years of stagnation and economic decline coupled with political upheavals, the Republic of Haiti, with a GDP per capita of approximately 1,470 USD (expressed in Purchasing Power Parity) in the year 2000, is at this date the poorest nation in the Western hemisphere and one of the poorest of the world. The present research reveals that this country is also where income is worst distributed in the most unequal region of the world, viz., Latin America and the Caribbean (LAC). Thus, besides the pervasive nature of poverty, income distribution also emerges as a potential stumbling block to growth prospects and should be of high concern for policy makers, let alone be part of a global policy to tackle the poverty scourge. The present research uses the 2001 Haiti Living Conditions Survey, the most recent multi–topic survey for the Republic of Haiti, for distributive analysis and absolute poverty assessment. Preliminary results show that poverty, as expected, is more widespread in the rural area while the Metropolitan area of Port–au–Prince is where the incidence of poverty is the lowest. Surprisingly, access to physical productive asset, such as land, does not help the peasant escape poverty. In addition to the derivation of inequality and poverty profiles, a weighted least square with proper design based for stratified, multistage, and probability cluster sampling is used to additively decompose inequality by multiple factor components. Also, a polychotomous ordered logit is estimated to investigate the risk of being indigent or poor.
Key words: Republic of Haiti, inequality, multiple factor components decomposition, poverty, stochastic dominance.
Introducción
A long with the perennial concern of societies to overcome poverty, a sudden upsurge and interest for inequality at both the academia and decision makers levels have been quite conspicuous, especially in the Latin American context after the advent of the so–called 'Washington Consensus'. Digging into the agreed upon idea that the best remedy against poverty is sustained growth may be one plausible explanation for this sudden interest. It is irrefutable that the pace of reduction of poverty is contingent upon how growth is distributed. Albeit increase in output may be a necessary condition for poverty alleviation, it is far from being sufficient as the poor will hardly benefit from a mere average output increase if, in the presence of 'unduly' unequal distribution of resources, very strong assumptions of spillovers or trickle–down effects are not made. Certain authors do in fact contend that the poor benefit from growth pari pasu with the rich (see Dollar and Kraay, 2000). However, evidence to support this contention lacks. In fact, in many Latin American countries the experience has shown spurt growth with increasing poverty. Were such picture attributable to inequality, this would then make the latter a concern in its own right (at least at some 'unsustainable' level) and should be part of a global policy to tackle poverty. Under such conditions, inequality should be an issue even in the realm of any Kuznets' viewpoint of development process or an underlying social structure characterized by a strong initial tunnel effect.1
Much analysis can be carried out in that respect for the Republic of Haiti, nevertheless not much work has been done or published so far. Apart from various reports of the UNDP–Haiti program, we have found few papers that attempt to characterize the poverty phenomenon in this country. Pedersen and Lockwood (2001) determined a poverty line based on the household income and expenditure surveys 1986/1987 and 1999/2000 (in french, Enquête sur les Besoins de Consommation des Ménages (EBCM I and EBCM II)). Beaulière (2004) used the 1994 Health and Demographic Survey (elaborated by l'Institut Haïtien de l'Enfance) to investigate the potential relation between fertility and poverty. One of his main conclusions is that the impact of poverty on fertility in the Republic of Haiti is non linear. The author also found that high fertility rate is associated with low literacy and high poverty, and that farmers are the group that exhibits the highest fertility rate. Sletten and Egset (2004) established a poverty profile based on the Haiti Living Conditions Survey, which we will discuss later. Their research yields some important results and sheds much light on the state of poverty in this Caribbean nation. Of particular importance is the Montas (2005) paper focusing on the macroeconomic causes of poverty in the Republic of Haiti. To our knowledge, heretofore no work has addressed in detail the issue of income distribution in this country; thus, the present research is the first to thoroughly analyze income distribution in the Republic of Haiti and also to assess the risk or probability of being indigent or poor. While this paper does not pretend to be exhaustive, yet it wishes to contribute to a greater understanding of income inequality and poverty in the Republic of Haiti. We concentrate on the extent of both inequality and poverty, but we also explore certain key factors contributing substantially to these two phenomena and make an appraisal of the vulnerability or risk borne by certain population subgroups.
This paper is organized as follows. Section 2 sketches out some issues pertaining to complementary inequality indices, the choice of poverty lines and poverty measures, as well as certain concepts related to the determination of needs or household homogenization. In Section 3 we discuss the data, whereas Section 4 presents the empirical results and treats additional statistical and econometric issues for inequality decomposition and poverty risk assessment. Finally, Section 5 comments certain caveats and concludes.
2. Inequality and poverty measures
2.1 Alternative measures of inequality
Three standard and complementary inequality measures are used for income distribution appraisal. The Lorenz curve (L(p)), the Gini coefficient (G), and the generalized entropy family indices (GE(θ)).2 Let 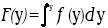 be the probability distribution function of living standards (y), and let the pth quantile of individual living standard be defined as
  Finally, let µ be the average living standards. Thus, our complementary measures of inequality of interest can be expressed as follows:
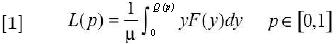
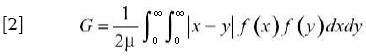
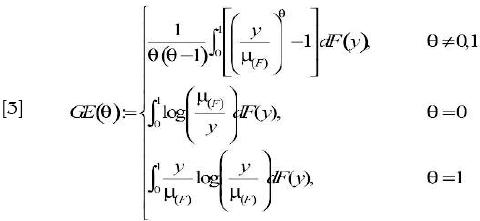
Equations 1, 2, and 3 give the functional forms of the Lorenz curve, the Gini coefficient, and the generalized entropy family of inequality indices (see, among others, Atkinson (1970), Sen 1973, Kakwani (1980), Cowell (1995) for an overview of the properties and drawbacks of these different measures). If the population is divided into k subgroups, then Equation [3] can be additively decomposed to take account of intra group and inter group inequality as follows:
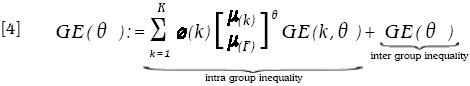
where  (k) is the share of subgroup k in total population. We deal with poverty issues in the next subsection.
2.2 Poverty
Traditional poverty assessment requires at the outset the establishment of a welfare threshold above which any individual will be deemed not poor. Consider x = [x1, x2, ..., xk] a vector of goods that a household can possibly consume, and p =[p1, p2, ..., pk] another vector of prevailing prices. Thus, for a given level of utility (Uz) deemed a minimum that guarantees an individual to lead a dignified life, the poverty line, z, can then be defined as follows:
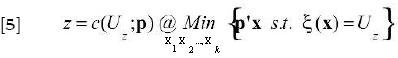
where c(.) is the cost function for that minimum welfare standard or utility level, and ξ(x) an indicator of individuals preferences exhibited over the spectrum of goods contained in the vector x. Despite the importance of this device to assess deprivation within a society, the debate as to the best available approach to setting it continues unabated.3 To make international comparisons across ldcs, the World Bank (wb) establishes a standard and rough–and–ready poverty line of constant 1985 US $1 ppp or US $2 ppp per day for low and middle income countries (or indigence and poverty), respectively. Many authors suggest that any poverty line will be influenced by the current living standards and should be defined accordingly.4 Thus the line established by the WB is totally arbitrary as that standard on every country may not be sufficient to satisfy the country–specific minimum calorie requirements (Kakwani, 2003). Moreover, as countries in different situation are being treated equally under this approach, such method of setting a poverty line violates the horizontal equity and consistency principles of a poverty line. We use an absolute poverty line, as expressed in Equation [5], based on the cost of basic needs (cbN) approach, corrected to allow for variations in the consumer price index for both food and non–food items. The result yields a scaled–up indigence and poverty lines of htG 4,845.51 and htG 6,438.60, respectively. The class of poverty indices considered in this research is the FTG (Foster, Greer, and Thorbecke, 1984), as given in [6].
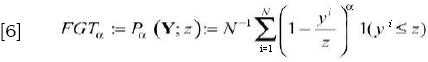
where Y:= [y1, y2, ..., yk ]' is an ordered vector of individual incomes,  The indicator 1(.) generates binary responses 1 or 0 if its argument is, respectively, true or false, and α is a parameter that captures the degree of aversion of society to poverty. Moreover, for α equals 0 or 1, [P (z; = 0) and P (z; = 1)], the FTG collapses to the crude poverty indices that are still the mainstay of poverty statistics, viz., the headcount ratio and the poverty gap ratio, respectively. Equation [6] may be decomposed to account for the contribution of g mutually exclusive but additively exhaustive population subgroups to overall poverty. This is represented in Equation [7].

where yh, ng, Yg, and P (Yg; z), are respectively the income of some individual h in any subgroup g, the number of individuals in the subgroup, the vector of incomes pertaining to g, and the corresponding poverty index. It is straightforward that the portion 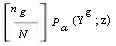 is the absolute contribution of group g to overall poverty.
Ordering conditions for this class of indices that allow an analyst to unambiguously assert the existence of more poverty in one distribution than another and by the same token check for robustness of the poverty estimates are provided in the next proposition.
Proposition (Foster and Shorrocks, 1988a, 1988b, 1988c): Given two distributions 
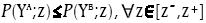 with
with  over the domain [0,4).
As is clearly stated by the previous preposition, if unambiguous dominance is found for some member of the P class dominance relation will ipso facto hold for P∞+1(though not vice versa). Household homogenization is dealt with next.
2.3 Household homogenization
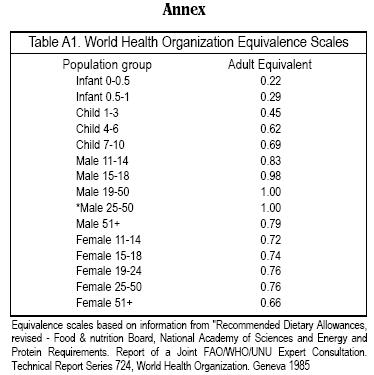
Individuals are the entity to whom income nominally accrues, but the benefits of income typically extend beyond individual level as these are distributed across various members sharing a same roof. This probably gives good ground for accepting the household as usual unit of analysis in welfare assessment. Households though typically differ in needs as they exhibit differences in size and demographic composition. Thus, consistent distributive and poverty analysis calls for allowance to be made for households' respective size and demographic composition. To homogenize and make valid cross households comparisons in this research, we use a highly refined equivalence scale as given in [8] that these issues into account.
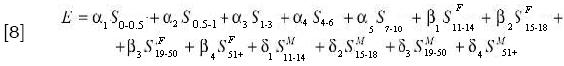
where αis are parameters that capture the weight of infants and children of different age groups, and βis and δis are other parameters reflecting the respective weights after interaction between age and gender has been accounted for.7 A break–down of the respective weights is given in table A1 in annex).
3. The data and application
The data used in this research come from the "Enquête sur les Conditions de Vie en Haïti" (Haiti Living Conditions Survey, acronym in French ECVH–2001). The ECVH–2001 is the first multi–topic household survey with nationally representative cross–section data and was implemented by the "Institut Haïtien de Statistique et d'Informatique" (the Haitian Statistical Office, (IHSI)) in collaboration with the United Nation Development Program–Haiti (UNDP–Haiti) and the technical support of "Fafo Institute for Applied Social Science" (FAFO)–Norway. The survey was conducted on approximately 7,800 households during the months of May through August 2001. Satisfactory responses were recorded for 7,186 households, for a total of 33,007 individuals on the roster file. We compile all information on household characteristics is according to the household main provider of resources aged 15 years or older. Some filters to ensure consistency of the point estimates and their standard errors were also carried out. Moreover, since sampling or probability weights are influential on the point estimates as are clustering and stratification on the standard errors, so when not accounted for via proper design–based analysis, the former will be inconsistent while the latter will more likely be biased downward.8 Therefore, full attention has been given to probability weights, clustering, and stratification.
4. Empirical results and discussion
4.1 Anatomy of income distribution
Inequality in the Republic of Haiti is among the highest in the world. At a 95 per cent confidence level the estimated Gini coefficient lies within the interval; our best point estimate is 0.6457. As can be observed from table 1 below, the Republic of Haiti ranks the second highest unequal country in the world after Namibia, according to available data; the Republic of Haiti also surpasses Brazil, which has been traditionally the most unequal country in the Latin American and Caribbean (LAC) region. This result is consistent with the figures displayed in table 2, where large disparities between the top 20 per cent and the bottom 20 per cent of the population are observed: more than 68 per cent of total income goes to the highest quintile, while less than 1.5 per cent accrues to the lowest 20 per cent. Inequality of land ownership though is not as high as one might have expected taking into account measured land inequality for other countries of the region.9 Sletten and Egset (2004) contend that land distribution in the Republic of Haiti is more egalitarian than in other countries of the area because of the specificities of Haiti's independence war and the development of the Haitian state.10
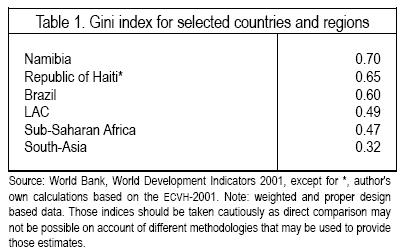
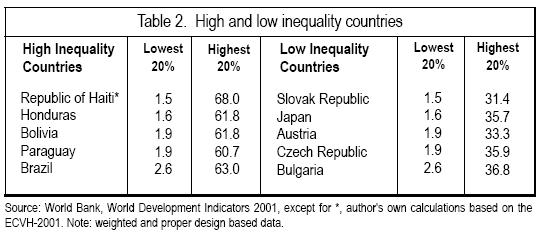
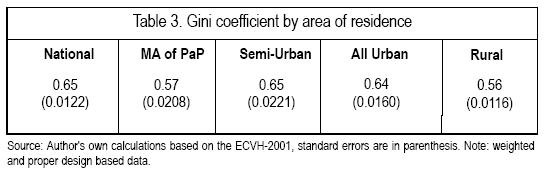
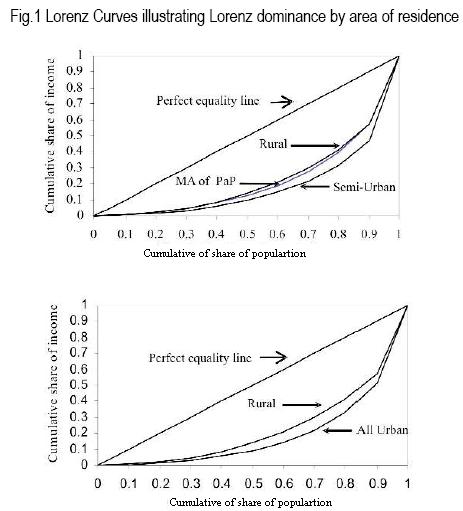
Table 3 and both panels (a) and (b) of figure 1 below also give evidence of different levels of inequality among residential areas. In general more inequality is registered in the urban area than in the rural one, albeit the former contributes less to global inequality than the latter. However, the difference in inequality between the rural area and the metropolitan area of Port–au–Prince (MA of PaP) may be regarded as inconclusive since at least one crossing of the Lorenz curve has been observed.11 Noteworthy, no re–ranking of residential is observed heedless of the approach used to measure inequality.
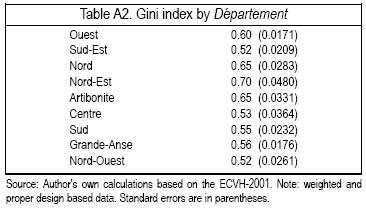
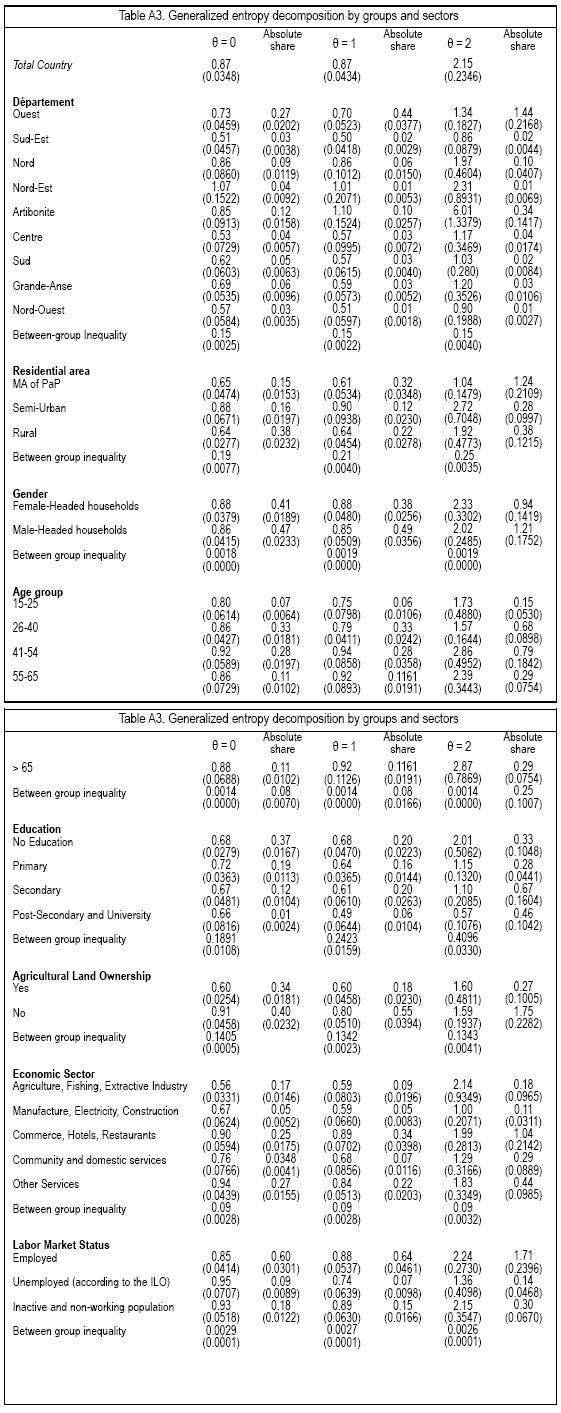
At regional level, Département du Nord–Est is where income distribution is mostly skewed with an estimated Gini of 0.70; while Sud–Est, Centre and Nord–Ouest are the least unequal regions (see table A2 in annex for Gini estimates by Département). Although Département de l'Ouest registers a relatively low inequality level, it is the region that contributes the most to overall inequality with a relative contribution of approximately 51%, followed by Artibonite with more than 11%. Inequality decomposition in table A3 also gives fairly the same results as to the intensity of inequality within the different Départements.
Socio–demographic characteristics and inequality
Gender does not seem to reveal any significant difference in inequality. Both the Gini scalar and decomposition by generalized entropy underscore negligible difference between these two groups. This finding may be seen peculiar as one would expect to observe substantial difference in average living standard of the two groups, but since we are dealing with total income such result is quite plausible. As will be further put into relief, remittances is one of the factors contributing much to inequality, and female–headed households not only are the typical recipients12 but also receive relatively more in terms of bulk of transfers. Hence, this may be operating as an 'income equalizing factor' between male and female–headed households. Notwithstanding the aforementioned, households whose main provider is male contribute more to inequality than their female counterparts. Inter–group inequality for age cohorts and labor market status of main provider also cast negligible differences. One salient feature of labor market status of the main provider is that inequality is basically explained by what may be regarded as "earnings inequality" since, as measured by the first Theil index (GE(1)), the contribution of the 'employed' within this group is more than 74%. But given the structure of the Republic of Haiti's labor market this interpretation should be moderate since it is estimated that between 70 and 80 per cent of the labor force is absorbed by the informal sector.13 In reference to age cohorts, main providers aged 26 through 40 along with those aged 41 through 54 contribute the most to total inequality. This probably corroborates the previous result since those age categories are the most common in the labor market.
Inequality within education groups, as is evidenced in table A3, is fairly similar while estimation of group contribution is revealed somewhat ambiguous.14 As can be observed from the table, the group with no education contributes more to inequality while the account for the post–secondary and university groups is insignificant for θ = 0. This tendency would eventually reverse as the sensitivity to income differences is increased. But as expected, between–group inequality is substantial with approximately 16 per cent of the total. This suggests that policies that aim at reducing inequality should focus on breaching the gap between the different groups with special emphasis being put on basic levels of educational attainment. In reference to economic sector, hotels, commerce and restaurants and the sector that includes other services explain much of the inequality for all levels of θ considered. Meanwhile, agriculture, fishing and extractive industries display one of the lowest contributions.
4.1.1 Statistical and econometric issues: decomposing inequality by various factor components
Instead of decomposing inequality in one dimension (as is done in the previous section), it is sometimes very useful and informative to posit an income–generating–function equation to account separately for the role of multiple covariates in the level of inequality from a single survey. Many methodologies have been proposed for such endeavor but a literature survey herein would go beyond the scope of the present research. So, the reader is referred to various papers from Fields et al. (1998), and Fields (2002, 2004) and the literature therein for a review of different methodologies and their limitations. In this paper we follow Fields' (2002) methodology to additively decompose inequality for a set of covariates.
Let yi be the income of individual i, then the income–generating–function may be expressed as follows:
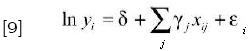
where xij are covariates that capture individual characteristics, and δ and yj are parameters to be estimated; finally, i is the traditional error term for which the usual iid hypothesis applies.15
Equation [14] may be rewritten as
[10a] In yi = Σ dj Φij = d'Φi
where
[10b] d = [ δ γ1 γ2...γJ 1]
and
[10c] Φi = [1 xi1 xi2...xiJεi]
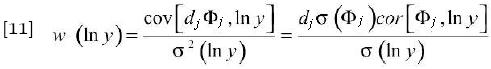
By taking the variance of [11a] and after some manipulations and assumptions16 the inequality measure of interest is reached on the left–hand side and the contribution of each covariate on the right hand side. The results will be valid for any inequality index that satisfies the anonymity and continuity properties and for which the index is null when all individuals have the average income, i.e. I(µ, µ,..., µ)=0. The entropy family indices, the Gini index, among other relative inequality indices, fall under such category. After further manipulations of Equation [11] we get the exact contribution of each covariate, as is represented in Equations [12] and [13]:
A standard Mincer–type equation is discarded for this analysis since we are interested in measuring total income inequality. Accordingly, the dependent variable is log of total income including self–consumption and barter. The set of covariates are treated in a discrete fashion, in particular to relax the assumption of constant marginal returns to education and by that better captures the between educational levels earnings differentials. A weighted least square using the household weight and size as inflation factors is performed to ensure consistency of the parameters estimates. Given the population heterogeneity (e.g. substantial variability across strata), additional corrections to account for survey design, i.e. stratification and clustering, are also introduced for efficiency (see Carrington, Eltinge and McCue (2000) for the issues involved in such task).
The regression results are presented in table 5 and White–Huber–Eicker (Sandwich) standard errors are used to derive factor relative contribution to inequality. Parameters estimates from the regression will not be fully discussed here, but the signs are as expected (except for age profile). It is worth mentioning that, as one would forecast, education is positively correlated with income and is highly significant; agricultural land ownership, contrary to what one would hope for a country of agricultural vocation, only seems to be making a difference at generating higher income when the stretch of land possessed is larger than 10,000 square meters (1 ha).17
The regression results show clearly that inequality is basically explained by three factors: a) big disparity in income generating capability among geographic departments (basically between Département de l'Ouest and the rest of the country), accounting for 41 per cent; b) the difference in (proxy) of earnings structure by educational level, the contribution of which is approximately 32 per cent; and c) the difference between households who receive remittances from relatives abroad and those who do not, accounting for more than 16 per cent of overall inequality.18
On light of such findings, policy implications are straightforward. Although it is manifest that there exist dramatic infrastructure deficits all over the Haitian territory, programs that aim at reducing inequality should focus on decentralization by providing the geographic departments, other than Département de l'Ouest, with more and better infrastructures as well as greater access to services in order to help these geographic regions converge with Département de l'Ouest; without discarding of course the necessity to improve and regulate investments made for such purpose in that Département, in particular the MA of PaP. Besides helping reduce inequality, policies of that kind could also have considerable spillovers such as stemming the demographic exodus leading to a population crowding in the MA of PaP; an exodus that has as corollary demographic imbalances with the potential perverse effects this may have on the country's balanced growth and development prospects if we consider the core–periphery pattern (in terms of economic activities and government services) that already exists between the MA of PaP and the remaining geographical departments of this country.
As it is accustomed to setting the task and aim of education policy to promote less inequality via increased (and judicious) investment in this sector, public policy can foster what we could call 'acceptable' or 'justifiable' inequality related to education. That is, a level of inequality that could be construed by society as 'fair' after adjustment for differences in levels of education completed is made.19 In turn, remittance recipients are among the less affected by pervasive poverty. While this group contributes substantially to inequality, policy interventions, such as taxing transfer recipients more heavily than other groups would have to be investigated further in order to avoid potential counter–productive effects since, as the data reveal, there is a positive correlation between remittances and the level of human capital within the household. In any event, our stance towards inequality is not to consider it as an evil per se, though there are certain levels of inequality that can only be a hindrance to growth and development prospects. Examples and evidence that explain how high levels of inequality (with the ensuing distributional conflict) fosters all sort of instability (e.g. riots, macroeconomic instability, class conflicts, coup–d'états, etc.) within a society abound. The Republic of Haiti exemplifies the case for such contention.
4.2 Anatomy of poverty and robustness of ordinal comparisons
This section focuses on poverty estimates and rankings. As will be soon evidenced, indigence and poverty estimates go in line with published statistics comparing, by almost all standards, the Republic of Haiti with Sub–Saharan African countries.
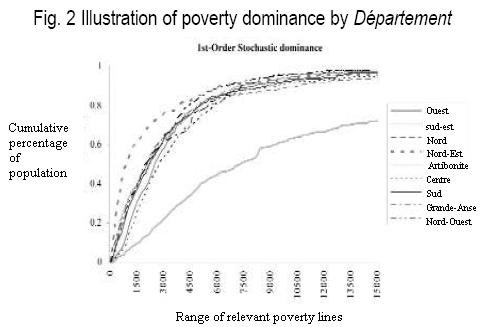
From the thresholds specified above, our best indigence and poverty point estimates are, 0.6598 [0.6338,0.6858] and 0.74350[0.7182,0.7689], respectively. All estimates that we will discuss briefly are presented in tables A4 and A5 in annex.21 As can be observed, except for Département de l'Ouest (where Port–au–Prince is located), all regions display indigence and poverty rates well above national level. Figure 2 below gives evidence of the robustness of this result for poverty estimation; it can clearly be seen that all regions are stochastically dominated by Département de l'Ouest.22 Although poverty incidence seems to be higher in Nord–Est than any other geographic department, this result is not robust to the choice of poverty line since no clear dominance is found between this region and Artibonite, Grande–Anse and Nord–Ouest (albeit for low level of welfare, from zero through 5,000 gourdes, the (censored) distribution function curve of the former is everywhere above those of the latter). Accordingly, we may consider that poverty rates are not too different among these geographic departments. However, accounting for deepness and severity of poverty, we may conclude that the poor are mostly concentrated in Nord–Est and Nord–Ouest. Thus policies devised to tackle this scourge should pay particular attention to these two regions, along with Département de l'Ouest and Artibonite, which contribute the most to overall poverty.
As is illustrated below in figure 3 (panels a, b and c) stochastic dominance tests (at either 1st, 2nd or 3rd–order) underscore much ambiguity between semi–urban and rural areas, so there is no evidence that households in the former fare less well than those in the latter. In any account, poverty is more widespread in rural than in semi–urban area. By panel (a) it remains clear however that there is more poverty in these two areas than in the MA of PaP. As expected, the MA of PaP registers the lowest level of poverty with a contribution of 13 per cent, while the rural area accounts for approximately 68 percent of overall poverty.
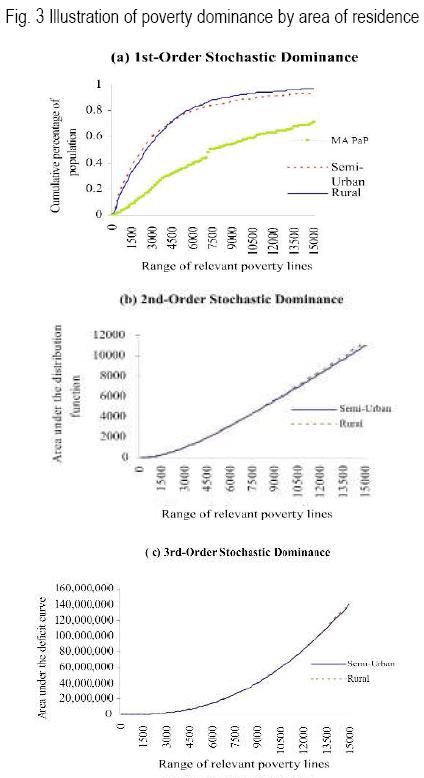
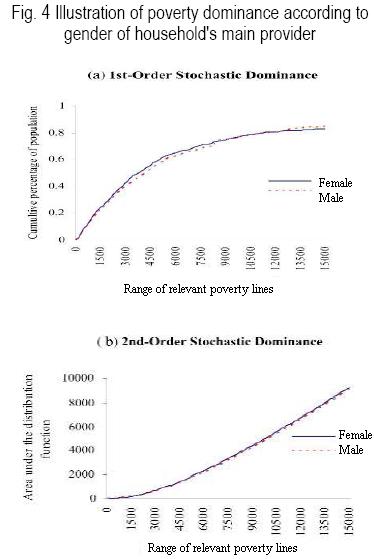
Headship does not seem to reveal much difference in the incidence of poverty, nonetheless in no case should this be construed as if female and male enjoyed the same level of welfare since, in the context of developing countries such as the Republic of Haiti, it is most likely that decisions of intra–household allocation for providing stock of human capital to the offspring are biased towards boys. Hence, it is most likely to observe household investment in (say) schooling and health care to be less important for girls. Moreover, as can be observed from panel (a) in figure 3 below, no 1st–order stochastic dominance is registered; male–headed households only start dominating their female counterparts at 2nd–order, which is an indication of how deep and severe23 poverty is within the latter group of households.
The data also disclose the usual negative correlation between human capital (understood here as years of schooling) of main provider and poverty incidence; 87% of households whose main provider has no educational background are poor. This group also accounts for about two–thirds of overall poverty. Poverty incidence decreases monotonically as main provider's level of education increases, making in the end the contribution of household's main provider with post–secondary or university level of studies negligible. These results are not surprising and are very robust, figure 5 below gives account of the robustness and dominance pattern among educational levels.
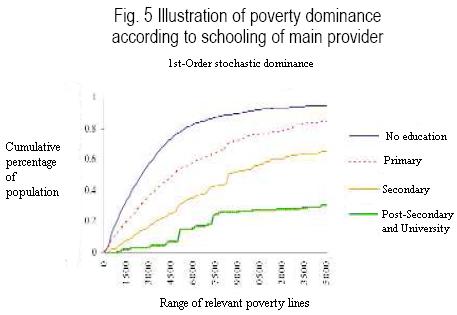
Moreover, the association of lack of education and poverty is probably an indication of the Republic of Haiti's poor record of educational attainment24 given that approximately 84% of the population (about 88% of the poor) dwell in households whose main provider has 6 or fewer years of education. Adult equivalent income is about thirteen times larger in households whose main provider has post–secondary or university study level than in those for which the main provider is illiterate. Thus, it goes without saying that education is one key element in fighting poverty.
The previous assertion is more readily understood in the context of the following figures: although considerable progress has been made in the field of literacy under the constitutional government stemmed from the 2000 elections, there is still a lot of ground to cover. Roughly one half of the population has access to education, 76 per cent of the students, whose families are steering south and west to cover the outrageously onerous expenses on education, attend private schools that constitute 89 per cent of the totality of schools all over the territory. Concurrently, 58 per cent of the school enclosures are not properly designed to their true purpose, while only 15 per cent of the teachers are qualified to a level deemed adequate by the Haiti Ministry of Education. Despite this bleak picture, public spending on education represents roughly 1.5 per cent of GDP compared to approximately 4 per cent spent by public sector in other low income countries of the region for the same purpose.
The Republic of Haiti, along with Afghanistan and Somalia, is one of the three countries in the world with more daily calorific deficit per inhabitant, thus at this stage of pervasive misery where the indigence rate is 66 per cent (i.e. two–thirds of the population cannot make ends meet, let alone to feed themselves to their hunger), should the Haitian State continue to delegate to the private sector the responsibility of providing basic education (to wit, primary and secondary levels) to the masses, with the financial burden for the families, inadequate school enclosures and under–qualified teachers this entails, the vicious circle of poverty–lack of education and low literacy–poverty could only perpetuate, and its corollary is the tearing of this country society's fabric and the dismantlement its citizenship; these are two phenomena under which claws people living in Bel–Air, Cité Soleil, La Fossette, Raboteau (among others) are already.25 In that vein, sound policies should be devised and well implemented in order provide the most deprived in the Republic of Haiti with a key element, to wit education, to better take advantage of income–earning opportunities.26
Contrary to what one would expect according to life–cycle or permanent income hypothesis, differences in poverty estimates among age categories of main provider are negligible. On account of conventional wisdom from the afore–mentioned hypothesis, an additional evidence that would be construed as peculiar is that households whose main provider is over 65 years have the highest adult equivalent income. This finding is similar to what other authors found for certain countries in the region. For instance, Ferreira, Lanjouw and Neri (2003) suggest, as one of their interpretations for such 'peculiar' finding in Brazil, an excessively generous (and regressive) pension system in operation. Hoffman's (2001), and Bourguignon, Ferreira and Leite's (2002) explanations also go in that line. Such appreciation though could not apply to the Republic of Haiti as state pension system is virtually nonexistent. Székely (1998) also found for Mexico that age of head of household is irrelevant in explaining poverty. In the context of various African countries, Kaboré (2000) suggests that life cycle effects vanish as they are internalized by community support, which implies a certain socialization (or collectivization) of individual income, and hence consumption. In light of these findings, life–cycle hypothesis does not seem to be well supported by available evidence in the context of the Republic of Haiti and less–developed countries in general.
As to the household structure, famille nucléaire (i.e. biological parents plus the children), single–parent family, and extended family are those for which higher indigence and poverty estimates are registered, although there is no clear stochastic dominance among these three. But probably the most striking evidence from the data is the inability of agricultural land–owners to escape poverty even in the rural area despite the country's agricultural vocation.27 At national level, 78 per cent of agricultural land–owners are indigent while 87 per cent of them are poor.28 Concurrently, those estimates for no agricultural landowners are, respectively, 50 and 58 per cent, and land–ownership only starts making a difference at reducing poverty when the stretch of land possessed is 10,000 square meters or more. Figure 4 below gives evidence of the robustness of these results.
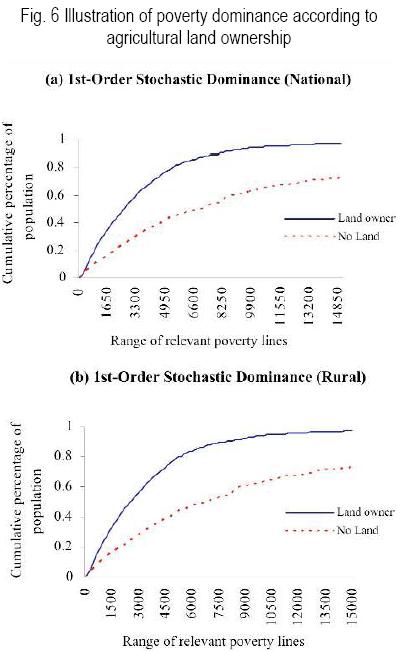
Those estimates are fairly similar at rural level. However, rural indigence and poverty rates should be taken cautiously since we are using the same poverty line as in the national case, while it is most likely that prices for agricultural products are lower for rural–dwellers, where the bulk of food is presumably produced and therefore certain costs, such as transportation costs which city–dwellers face, may diminish or at best be eliminated. Since no price data are available in the ECVH–2001 we could not treat urban and rural areas differently to account for potential differences in price. Sensitivity analysis, correcting the national line below, revealed considerable decrease in indigence and poverty rates for the rural area. The next section discusses this issue.
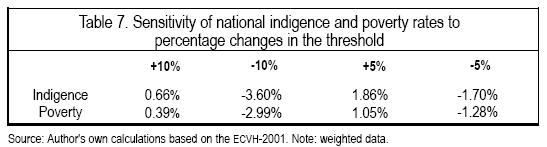
4.2.1 Sensitivity analysis
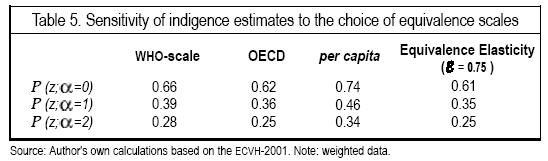
Tables 5 and 6 below present indigence and poverty estimates based on dietary adult equivalent income using the recommended allowance per day (WHO) scale, adult equivalent income using the standard (1982) OECD scale, per capita income (which does not account for potential economies of scales that could operate within the household), and adult equivalent income based on the equivalence elasticity for an ε equal to 0.75.
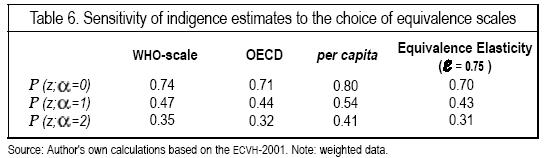
As can be observed from the tables, the OECD lowers respective indigence and poverty rates by approximately 6.5 and 4 per cent, while the equivalence elasticity (ε=0.75) scale decreases those rates by 8 and 5 per cent, in the same order. The converse is true for per capita income, which does not account for potential economies of scale within the household. The increase in that case is about 11 and 7 per cent for indigence and poverty, respectively. As a first observation though, we note that indigence is more sensitive to the equivalence scale used than is poverty and of all the estimates severity [P(z; =2)] is the most sensitive to a scale change. Second, the oecd and the equivalence elasticity (ε=0.75) scales may not be capturing the specific weights of children and the weights stemmed from interaction between age and gender, giving this way more importance to the level of economies of scale than is actually taking place within the household and therefore underreporting the scope of deprivation. On the contrary, per capita income, by not making allowance for economies of scales (partly because of its tacit ethical stance of neutrality to demographic composition), may be inflating the needs of certain household members and thereby increasing indigence and poverty incidence, in particular when there are many children and female within the household. In any event, we do not believe there exists large scope for economies of scales with–in Haitian households since, as is evidence by the high indigence incidence, it is quite plausible to assume that the bulk of expenses has to be done on food, which does not leave much room for other expenses since discretionary acquisitive power is most likely very low for a typical household. Food in turn is not a public good, nonetheless, given certain characteristics of the Haitian society, mutual aid and an extended kinship system could be operating at micro–level as a quasi–perfect substitute for the dysfunctional state pension and social security system, and inexistence of employment benefits, giving place to the possibility of food sharing, even among non family members. Consequently, the more 'conservative' results from the recommended dietary allowances per day (WHO–scale) seem to be more plausible and appropriate in our context.
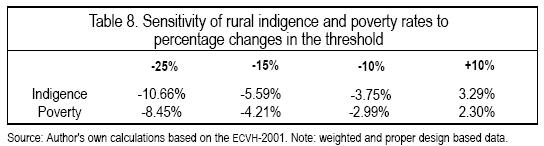
Indigence and poverty rates reported in this research rely on Perdersen and Lockwood's (2001) poverty line, scaled up to account for variations in consumer price index. Nonetheless, had there been price data from the ECVH–2001 survey, calibration to derive 'more accurate' indigence and poverty thresholds could have been performed and differential treatment could have been given to urban, semi–rural, and rural areas. Hence, further sensitivity analysis implemented at both national and rural levels discloses indigence and poverty rates to be fairly sensitive to the choice of the respective lines.
As can be observed from table 6, at national level, increasing the threshold by 10 percentage points elevates indigence and poverty rates by more than 3 and 2 per cent, respectively. A similar decrease in the threshold gives approximately the same results, although the decrease in those rates is slightly more accentuated. As is evidenced from table 7, these observations are not different at rural level. It is thus suggested by these findings that in the distribution of per adult equivalent income (by the WHO–scale standard) few individuals are concentrated around both the indigence and the poverty lines at national and rural levels. The previous assertion means that any marginal change in the poverty (or indigence) line would not have great impact on the estimates. In other words, the effort to be exerted to tackle this scourge must be swift and steady.
4.2.2 Vulnerability assessment: risk of being indigent and poor
In the previous sections we tried to document the incidence of indigence and poverty in different segments of the population. As the results are based on a pre–established threshold, consequently the measures are simply capturing the contemporary status of a household's well–being. However, as is suggested by Chaudhuri (2003), if we think of poverty (and by extension indigence) to be a stochastic phenomenon, where today's poor may not be tomorrow's poor (and vice versa), then this type of ex–post analysis in the previous sections, although it presents a clear picture in terms of identifying and quantifying this phenomenon, may not be of great relevance for devising forward–looking anti–poverty policies. Thus, instead of adopting a static approach to that matter, knowing how the income (or consumption) prospects of a household or certain population subgroup are likely to evolve over time (i.e. an ex–ante analysis) is sometimes of greater interest.
An analysis of this caliber requires at the very outset the explicit specification of the underlying data–generating process for (say) the deprivation index. The regression techniques generally used in such case are non linear models to capture the impact of each covariate on the dependent variable, the outcomes of which are of discrete choice.29 The categorization we make to estimate the probability of being indigent or poor mandates the use of a multinomial or a polychotomous ordered logit. We adopt the latter alternative to impose legitimate ranking on the outcomes since the latent variable is both discrete and ordinal (see Borooah 2002 for further discussion), where it takes the values 1, 2 or 3 if a household is non poor, poor or indigent, respectively. Multinomial logit would fail to account for the ordinal nature of the dependent variable and thus not employ all the information available in that variable (Liao, 1994).
Specification of the polychotomous ordered logit:
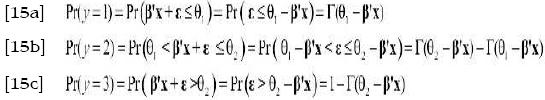
Suppose we can estimate the probability of being indigent or poor using the following latent regression:
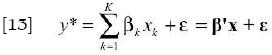
Let the thresholds for poverty and indigence be respectively θ1 and θ2 the parameters to be estimated along with the βs via maximum likelihood methods (it is straightforward that θ1<θ2, and that both are superior to zero). Then let y* be the unobserved latent variable defined as follows:
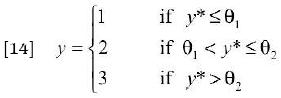
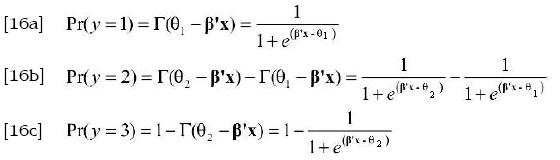
The probabilities of y taking the values 1, 2 and 3 are
where Γ is the logistic cumulative distribution function.30 Consequently, it is assumed that the error terms follow a logistic distribution. Thus, the ordered logit is given by:
As usual, the marginal effects of the covariates on the probabilities are not equal to the coefficients (Greene, 2000: 876). Such marginal effects of variations in the covariates are given as follows:
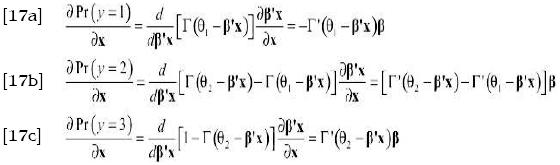
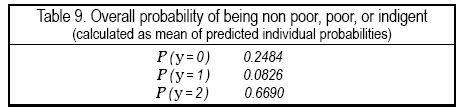
The specification of [18] is appropriate for continuous independent variables. As is clearly demonstrated in Borooah (2002), for binary determinants the effect should be analyzed by comparing the probabilities that result when the dummy variable takes one value with the probabilities that are the consequence of it taking the other value, the values of the other variables remaining unchanged between the two comparisons.31 Results from the regression are reported in tables 8 and 9 below. The model fits the data quite well and shows compliance with the irrelevance of independent alternative (IIA) hypothesis by failing to accept the null hypothesis of non systematic difference in the coefficients of the full and the restricted models (results for the Hausman test is in table 9 below).32 Moreover, except for certain estimates associated with age (26–40, 55–65, and >65) and agricultural land possession (> 25,000 square meters) all other coefficients are significantly different from zero. Altogether, as presented in table 8 below, probabilities of falling into the categories of non poor, poor, and indigent are 0.25, 0.08, and 0.67 respectively.
As expected, risk of being indigent or poor decreases exponentially as the level of education increases. By the sign of these coefficients we can infer that, ceteris paribus, higher education is associated with a lower risk of being indigent or poor and consequently a higher probability of being non poor. If the indigence risk of a household whose main provider has completed primary education is 32 per cent, for someone who has post–secondary or higher education this risk collapses to 0.07 per cent. Columns 4 through 6 in table 9 give the marginal effects (the expected change) on the probability of being in one of the three categories defined above. The results disclose the importance of human capital in reducing the vulnerability to 'deprivation'. On average, being educated increases the probability of being non poor by 32 per cent while it decreases probability of indigence by 34 per cent. Notwithstanding the joint significance of the age profile dummies, not much though can be inferred from this variable.
As is discussed in several studies, data most of the time disclose a feminization of the poverty phenomenon. In the previous ex–post analysis, first order dominance test between female and male main provider was inconclusive, meaning that poverty rate between these two groups was not very different. However, the logistic regression results reveal that on average females bear higher risk than males. Having female as main provider increases the risk of a household to be in indigence by approximately 6 per cent, while it decreases the probability of being non poor by about 5 per cent. This bleaker picture for households whose main providers are female may be due largely to two reasons. Firstly, women participate less in the labor market than men. Secondly, they are by far less educated than men.33 Moreover, the difference in labor market participation may in fact be the corollary of the former having less human capital than the latter, or may simply be due to disguised gender discrimination.34 As is rightly suggested by Lipton (1994), certain cultural arrangements may also inhibit women to escape deprivation, as for example large share of domestic commitments which prevents them from seizing new and profitable work opportunities as readily as men.
Remittances, which represent roughly one third of the country's GDP,35 appear to have a positive impact on people's 'well being' (despite its substantial contribution to inequality). Households who do not receive transfers (both in kind and in cash) from relatives abroad fare less well than those who do and the prospects of the former group are gloomier. Apart from the fact that remittances alone give households greater command over consumption goods, there can also be depicted some other direction of causality. Contingency tables (not reported here) indicate that remittance recipients have higher stock of human capital relative to non recipients. Thus, on account of the ability of this factor (human capital) to reduce vulnerability to indigence or poverty, for household within that category the odds against being non poor should be (and are in fact) slim. As is reported in the logistic regression results (table 9 above), being a remittance recipient reduces the risk of being indigent by about 18 per cent while it increases the probability of being in the non poor category. Accordingly, policies to target and provide education subsidy to families non beneficiaries of this kind of transfers (and who have proven to be in need) should be desirable.
Various studies emphasize the strong link between landlessness and poverty, in that agricultural land possession should confer lower deprivation incidence than landlessness (for empirical evidence in Indian villages see Lanjouw and Stern, 1991). Evidence of such link is rather mixed. Besides, as is advanced by Delgado, Matlon, and Reardon (1991), landlessness may well be construed as a proxy for greater ability to work in non–farm sector which yields higher return. While an analysis of this factor would be more appropriate if it were held at rural level, given the high proportion of households who possess land all over the territory,36 the regression results at national level give a fairly good approximation of the problems pertaining to the group of land–owners and these results may be extrapolated to the rural zone (the signs of the coefficient estimates are the same in rural area, but with different significance level). In the context of the present study, contrary to what is emphasized in most studies, land–owners are more likely to be deprived. This finding may seem somewhat surprising given the structure of the Haitian economy. Then the question to beg is why in a country of agricultural vocation such as the Republic of Haiti farmers (and especially peasants) cannot escape poverty.
One element of answer could be found by looking at the agrarian structure or 'efficient' plot size. According to the Food and Agriculture Organization (FAO, 1995), to be able to make a living a typical family in the Haitian context would necessitate between 2.5 to 3 hectares of arable land, meanwhile close to 60 per cent of land–owners have less than one hectare (10,000 square meters) and about 83 per cent possess less than 3 hectares. Doura (2001: 81) also reports an average exploitation scale of 1.4 hectares with a tendency of these exploitation scales to diminish through out time. This is due to the continuing parceling out, attributable in part to the equal sharing of bequest imposed on heirs, low productivity and languishing acquisitive power of, in particular, the rural poor. Concurrently, the typical family structure for the group of land–owners is either famille nucléaire or large family. This means that production can only be made at subsistence level to feed a large amount of mouths.37 The type of technology available to farmers is a determining factor on the farm's productivity. While less than 1 per cent of the farms use mechanical irrigation, more than 70 per cent of them depend on rainfalls; also, less than 37 per cent of farmers use fertilizers.38 These findings are indicating that, albeit another agrarian structure is in order, policy makers should be cautious about the direction of agrarian reform. In such context, a sound agrarian reform would probably require that attention be paid not just to equity but also to how efficiently land can be used after any land redistribution program has been implemented. Public Sector would then accompany such policies with others capable of fostering an environment that promotes, especially in the rural area, investment in employment generating activities with potential higher returns than in the agricultural sector.
As to the household structure, famille nucléaire and large family display the highest vulnerability to indigence and poverty. As compared to single families the risk of being indigent is 31 and 33 per cent higher for famille nucléaire and large family, respectively. Similarly, their probability of being non poor decrease by 23 and 26 per cent, in the same order. Results for geographic department go in line with previous finding. Nord–Est and Nord–Ouest are the geographic regions most vulnerable to this scourge.
5. Concluding remarks and caveats
This research attempted to document the extent of inequality and poverty in the Republic of Haiti adopting as theoretical basis a monetary approach. It allowed putting into relief different characteristics of indigent and poor households while it also pinpointed key factors contributing to the high level of inequality and those influencing the risk of being indigent and poor. In any account, and in light of recent political developments, what the ECVH–2001 reveals may be euphemistic as of the publication of the present research since, after the 36 per cent contraction that the Haitian economy has experienced from 1986 to 2000, it is estimated that GDP per capita has again registered some 10 per cent decline in the wake of the 2000 presidential elections up to now. This means that the picture may even be bleaker since it is most probable that the situation of the most vulnerable have worsened.
Being at this date the poorest country in the Western hemisphere, the Republic of Haiti also displays the highest level of inequality in the most unequal region of the world. In general, less inequality is registered in rural area than in urban zone, while indigence and poverty are more acute in the former. Albeit poverty is more widespread in the rural area, there is no evidence that the semi–urban area fares better or worse than the rural one because stochastic poverty dominance test between them is inconclusive. While contemporary indigence and poverty status of female and male–headed households (or having female or male as main providers) is fundamentally similar, the former bear higher risk than the latter, so forward–looking anti–poverty policies should account for this fact and create incentives for greater participation of women in the labor market as well as providing them with greater human capital as a means to 'equalize' their opportunity within the labor market. One of the salient points of this research, which confirms most of Beaulière's (2004), and Sletten and Egset's (2004) findings, is the inability of agricultural landowners (in particular rural peasants) to escape poverty. This group also shows high vulnerability and, although we could enumerate many factors contributing to this matter, probably the most significant is the type of technology available to them, the 'inefficiency' of the exploitation scale available to most of them, and their low level of literacy.
No definite assertion can be put forward in terms of the correlation between inequality and poverty, though it is noteworthy that Département du Nord–Est, where indigence and poverty rates are the highest along with greater vulnerability, is also the most unequal.39 Moreover, the factors contributing the most to inequality are regional disparities (disparity due basically to the difference between Département de l'Ouest and the rest of the country), education, and remittances. The first two, viz., regional disparities and education, are the domain where policy makers' role may be crucial. The high contribution of regional disparities to overall inequality points to the wisdom that balanced levels of infrastructure and access to services among the different Départements should be among policy priorities, while it goes without saying that provision for basic education to the majority of Haitians should be the top priority and constitute the bulk of Public Sector budget.
Finally, the debate about the influence of inequality on a country's growth prospects, and hence its potential ability to reduce poverty, is still gathering momentum. Examples and evidence that explain how high levels of inequality, and therefore distributional conflict, fosters all sort of instability (riots, class conflicts, macroeconomic instability, coup–d'états, etc.) within a society abound and the Republic of Haiti exemplifies the case for such contention. Although data are not available to carry out a rigorous analysis and certify such interactions for this country, we would like to urge that Cap–Haïtien, Fort Liberté, Gonaïves, and Port–au–Prince, chief–towns of Départements du Nord, Nord–Est, Artibonite, and Ouest, respectively, are the hottest spots and traditional epicenters of this country's class conflicts and political upheavals. 'Incidentally' they also register the highest levels of inequality (see table A2 in annex).40 Whether there is a direction of causality or not from this rough–and–ready observation, inequality, although it should not be construed as an evil per se, should be a concern in its own right for policy makers in the Republic of Haiti and be part of a national policy to tackle poverty and by the same token stem the tearing of this country's society fabric and the subsequent dismantlement of its citizenship. Were the ongoing political developments to disclose a structurally unfair distribution of resources, one possible way to take direct action in that sense is the design and enforcement of a progressive tax regime that truly reflects and expresses the sense and spirit of distributive and social justice, while simultaneously making heed of efficiency.
References
Alesina, A. and Perotti, R. (1994) "The Political Economy of Growth: A Critical Survey of the Recent Literature", The World Bank Economic Review, 8, 3, 351–371. [ Links ]
–––––––––(1996) "Income Distribution, Political Instability, and Investment", European Economic Review, 40: 1203–1228. [ Links ]
Alesina, A and Rodrik, D. (1994) "Distributive Politics and Economic Growth", Quaterly Journal of Economics, 106: 407–444. [ Links ]
Araar, A. and Duclos, J.Y. (2004) Poverty and Equity: Measurement, Policy, and Estimation with DAD, Université Laval, CIRPEE. [ Links ]
Atkinson, T. (1970) "On the Measurement of Inequality", Journal of Economic Theory, 2: 244–263. [ Links ] Beaulière, A. (2004) Pauvreté et Fécondité en Haïti, Centre d'Economie du Développement, Université Montesquieu–Bordeaux IV. [ Links ]
Borooah, V. (2002) "Logit and Probit: Ordered and Multinomial Models". Sage University Paper, 138. Series: Quantitative Applications in the Social Science. [ Links ]
Bourguignon, F., Ferreira, F., and Leite, P. (2002) Beyond the Oaxaca–Blinder: Accounting for Differences in Household Income Distributions, Mimeo, PUC–Rio. [ Links ]
Carrington, W., Eltinge, J. and McCue, K. (2000) An Economist's Primer on Survey Analysis, Center for Economic Studies. U.S. Bureau of Census, CES 00–15. [ Links ]
Chaudhuri, S. (2003) Assessing Vulnerability to Poverty: Concepts, Empirical Methods and Illustrative Examples, Department of Economics, Columbia University. [ Links ]
Cochran, W. G. (1977) Sampling techniques, 3rd Ed. New York: John Wiley and Sons. [ Links ]
Cowell, F. (1995) Measuring Inequality, Prentice Hall, Harvester Wheatsheaf. [ Links ]
Deaton , A. (1997) The Analysis of household Surveys: A Microeconometric Approach to Development Policy, The John Hopkins University Press. [ Links ]
Delgado, C., Matlon, P., Reardon, T. (1991) "Coping with Household–Level Food Insecurity in Drought Affected Areas of Burkina Faso", World Development, 16(9): 1065–1074. [ Links ]
Dollar, D. and Kray, A. (2000) Growth is Good for the Poor, World Bank Development Research Group, Mimeo. [ Links ]
Doura, F. (2001) Economie d'Haïti: Crise, Dépendance et Développement, Volume 1, éditions DAMI, Montréal. [ Links ]
Duclos, J.Y. (2002) "Sampling Design and Statistical Reliability of Poverty and Equity Analysis Using DAD", Université Laval, CIRPEE. [ Links ]
Duclos, J–Y., Esteban, J., and Ray, D. (2003) Polarization: Concepts, Measurement, Estimation, CIRPEE, Working Paper 03–01. [ Links ]
Esteban, J., and Ray, D. (1994) "On the Measurement of Polarization", Econometrica, 62: 819–851. [ Links ]
–––––––––(1999) "Conflict and Distribution", Journal of Economic Theory, 87: 379–415. [ Links ]
Feldstein, M. (1999) "Reducing Poverty, Not Inequality", Public Interest No. 137. [ Links ]
Ferreira, F. Lanjouw, P., and Neri, M. (2003) A Robust Poverty Profile for Brazil Using Multiple Data Sources, Paper presented at LACEA 2000 and ANPEC 2001 meetings. [ Links ]
Fields, G., Leary, J., López Calva, L., and Pérez de Rada, F. (1998) Education's Crucial Role in Explaining Labor Income Inequality in Urban Bolivia, Cornell University Paper. [ Links ]
Fields, G. (2002) Accounting for Income Inequality and Its Change: A New Method, with Application to the Distribution of Earnings in the United States, Forthcoming: Research in Labor Economics. [ Links ]
–––––––––(2004) Regression–based Decompositions: A New Tool for Managerial Decision Making, Department of Labor Economics, Cornell University. [ Links ]
Foster, J., Greer, T, and Thorbecke, E. (1984) "A Class of Decomposable Poverty Measures", Econometrica, 52 (3): 761–766. [ Links ]
Foster, J. and Shorrocks, A. (1988a) "Poverty Orderings and Welfare Dominance", Social Choice and Welfare, 5: 179–198. [ Links ]
–––––––––(1988b) "Poverty Orderings", Econometrica, 56: 173–177. [ Links ]
–––––––––(1988c) "Inequality and Poverty Orderings". European Economic Review. Papers and Preceeding, 32: 654–662. [ Links ]
Gradín, C. (2000) "Polarization by Sub–populations in Spain 1973–91", Review of Income and Wealth, 46: 457–474. [ Links ]
Greene, W. (2000) Econometric Analysis, Prentice Hall, 4th edition. [ Links ]
Hoffman, R. (2001) Desigualdade no Brasil: A Contribuição das Aposentadorias UNICAMP, Instituto de Economia, mimeo. [ Links ]
Kaboré, S. (2000) Modélisation des Déterminants du Statut de la Pauvreté, de la Profondeur de la Pauvreté et du Niveau de Vie dans les Ménages au Burkina Faso, MIMAP. [ Links ]
Kakwani, N. (1980) Income Inequality and Poverty: Methods of Estimation and Policy Applications, A World Bank Research Publication. [ Links ]
–––––––––(1984) "Issues in Measuring Poverty", Advances in Econometrics, Vol. 3: 253–282. Basmann and Rohdes, Eds. [ Links ]
–––––––––(2003) "Issues in Setting Absolute Poverty Lines", ADB Poverty and Social Development Papers No. 3. [ Links ]
Kakwani, N. and Son, H. (2001) "On Specifying Poverty Lines", ADB Poverty Forum. Manila: ADB. [ Links ]
Lamaute, N. (2002) L'économie informelle en Haïti: de la reproduction urbaine à Port–au–Prince, Editions l'Harmattan. [ Links ]
Lanjouw, P., Stern, N. (1991) "Poverty in Palanpur", World Bank Economic Review, 5 (1): 23–55. [ Links ]
Lee, E. S., Forthofer, R. N., and Lorimor, R.J. (1989) "Analyzing Complex Survey Data", Sage University Paper, 71, Series: Quantitative Applications in the Social Science. [ Links ]
Liao, T. F. (1994) "Interpreting Probability Models: Logit, Probit, and Other generalized Linear Models", Sage University Paper, 101, Series: Quantitative Applications in the Social Science. [ Links ]
Lipton, M (1994) Growing Points in Poverty Research: Labor Issues, Institute of Development Studies. Sussex University. [ Links ]
Montas, R. (2005) La pauvreté en Haïti: Situation, causes et politiques de sortie, LC/MIEX/R.879, ECLAC document. [ Links ]
Mora–Báez, J. (2003) "Agricultural Growth and Poverty Reduction", Roles of Agriculture Project International Conference, Rome, Italy. [ Links ]
Pedersen, J. and Lockwood, K (2001) Determination of a Poverty Line for Haiti, Fafo Institue of applied Studies. [ Links ]
Perotti, R (1993) "Political Equilibrium, Income Distribution and Growth", Review of Economis Studies, 60: 755–76. [ Links ]
–––––––––(1994) "Income Distribution and Investment", European Economic Review, 38: 827–35. [ Links ]
–––––––––(1996) "Growth, Income Distribution, and Democracy: What the Data Say". Journal of Economic Growth (1) 149–187. [ Links ]
Persson, T. and Tabellini, G. (1994) "Is Inequality Harmful for Growth?" American Economic Review, 84(3):600–21. [ Links ]
Podder, N. and Tran–Nam, B. (2003) Human Capital and Earnings Inequality: Some Considerations of Distributive Justice with an Illustration from Australia, Paper prepared for the World Institute of Development Economics Research Conference on Inequality ad Human Well–Being, Helsenky. [ Links ]
Ravallion, M. (1998) Poverty Lines in Theory and Practice, LSMS Working Paper 133, World Bank. [ Links ]
Sen, A. K. (1973) On Economic Inequality, Oxford: Clarendon Press. [ Links ]
–––––––––(1979) "Issues in the Measurement of Poverty", Scandinavian Journal of Economics, 81, 2: 285–307. [ Links ]
Sletten, P. and Egset, W. (2004) Poverty in Haiti, Fafo Institute of Applied Studies, Fafo Paper, No. 31. [ Links ]
Shorrocks, A. (1982) "Inequality Decomposition by Factor Components", Econometrica, 50(1), 193–211. [ Links ]
Székely, M (1998) The Economics of Poverty, Inequality and Wealth Accumulation in Mexico, St. Anthony's Series. Macmillan Press. [ Links ]
Wolfson, M.C. (1994): "When inequalities diverge", American Economic Review, 84: 2, 353–358. [ Links ]
World Bank (2001) The World Bank Poverty Analysis Initiative. Washington D.C., USA. [ Links ]
World Bank Haiti Data 2003. See webpage: <http://www.worldbank.org/ht.> [ Links ]
NOTES
1 Resorting to the basic principle upon which modern economics is built, viz., the Pareto principle of improvement (or Pareto superiority), certain authors (such as Feldstein, 1999) sustain that, unless the marginal utility of the income of the rich is negative in the social welfare function, more inequality may be good for society as a whole because if the rich earn more the pie susceptible for sharing gets bigger, therefore every society component is a potential winner. However, other authors also point out how high inequality can have a negative impact on growth via its socio–political effects, making it difficult (let alone impossible) for policy makers to effectively fight poverty (for further insight in this literature see, Perotti (1993, 1994); Alesina and Perotti (1994); Alesina and Rodrik (1994); Persson and Tabellini (1994); Alesina and Perotti (1996), and Perotti (1996)). regresar
2 θ is a parameter that captures the income difference sensitivity. regresar
3 Sen (1979), Ravallion (1998), Kakwani and Son (2001), and Kakwini (2003) are very good references for both theoretical and empirical approaches to setting poverty lines and their drawbacks. regresar
4 See in that respect, Kakwani (1984) and (2003), and Ravallion (1998). regresar
5 The original poverty line was determined by Pedersen and Lockwood (2001) for the Republic of Haiti. regresar
6 HTG stand for Haitian gourde (the national currency). regresar
7 Superscripts F and M stand for female and male, respectively. regresar
8 See Cochran (1977), Lee, Forthofer and Lorimor (1989), Duclos (2002), and Araar and Duclos (2004) for further analysis on sampling design and techniques of distributive and poverty analysis. regresar
9 Gini for land ownership for the region is on average 0.8. Gini for the Republic of Haiti is 0.66, while the Dominican Republic for instance registers a Gini index of 0.74 (see Mora–Báez, 2003). regresar
10 Egset (2004) "Rural Livelihoods" (in Egset and Lamaute–Brisson (eds.): Living Conditions in Haiti (forthcoming), Port–au–Prince: IHSI), provides further insights on this issue. regresar
11 It would probably be interesting to estimate generalized Lorenz curves (GLC) to assess welfare levels between these areas, but this is not our purpose in this paper. regresar
12 60 per cent of female–headed households receive remittances as opposed to roughly 40 per cent of their male counterparts that do. regresar
13 See Doura (2001) and especially Lamaute (2002) for discussions on labor market structure and the informal sector economy in the Republic of Haiti. regresar
14 One should be cautious here when making direct comparison among groups, given the existence of positive correlation between the generalized entropy index and the sample size. regresar
15 In our context, subsumed in this assumption is that proper correction for clustering is accounted for. regresar
16 See Shorrocks (1982) for the underlying assumptions. regresar
17 As can be observed from the results in table 5, legitimacy of this dummy is "rejected" by the data since its coefficient (by the robust t–Stat = Estimate/Robust Sdt.) is not significantly different from zero; nonetheless in the rural area possession larger than 10,000 square meters does make a difference at generating higher income (results for the rural area are not reported here). regresar
18 The value of R2 (0.32) is typical of income or earnings equations and can be considered here as acceptable, nonetheless it should be pointed that the real contributions of these variables may be somewhat lower given the relative low value of R2. regresar
19 One method proposed in the literature for such analysis has been advanced by Podder and Tran–Nam (2003). regresar
20 The design effect (Deff) arises from the deviation between the variance of the complex survey design ( complex) and the variance under assumptions of simple random sampling (F2SRS). Since, complex /SRS= [ 1 + ρ (ñ–1)], thus Deff =complex SRS= [ 1 + ρ (ñ–1)] where ρ and ñ are the intra–cluster correlation coefficient and the average cluster size, respectively. Accordingly, Deff > 1 is indicative of a downward bias of the unweighted and OLS standard error for not accounting for the proper design of the survey since it is unlikely that all elements within the clusters are equal (see Lee, Forthofer, and Lorimor (1989) and Deaton (1997) for further discussion).
21 Only poverty estimates are discussed in this paper. The results for indigence estimates for different population subgroups show the same trend as poverty. Detailed statistics for indigence can be obtained under request. regresar
22 Such finding probably justifies the popular neologism "The Republic of Port–au–Prince", in that the bulk of important activities, whether economic, political or cultural, take place in Port–au–Prince. regresar
23 Severity is an implication of second order stochastic poverty dominance sketched in the above proposition, since male–headed households will automatically poverty dominate their female counterparts at third order. regresar
24 Or could there be a dual causality in operation? regresar
25 These are slums where the majority of poor are concentrated in the MA of PaP and other major cities, such as Cap–Haïtien and Gonaïves. For instance, it is estimated that about one million people, of whom the vast majority are vegetating below the indigence line, live in Cité Soleil (Northwest of Port–au–Prince). regresar
26 Though it should be emphasized here that primary and secondary education are the levels where the government has a key role to play. regresar
27 According to recent data from the Bank and the IMF the agricultural sector employs about two–thirds of the labor force, while it contributes to approximately twenty seven per cent of GDP (see the World Bank Haiti data, 2003). regresar
28 Economic sector of main provider of resources also reveals that agriculture, fishing, and extractive industry are the activities where indigence and poverty incidence is the highest. regresar
29 There is contention that such specification does not make full use of the information available in the data since some of it is lost because of the dichotomization (in our case polychotomization), but it is also believed that predictive power of the covariates is better assessed via such technique. regresar
30 This specification is slightly different from Greene's (2000) in that the first threshold, is set to zero in Greene while in Stata the threshold absorbs the intercept term. regresar
31Accordingly, since we are dealing with dummy variables only, the  i =1, 2, 3) transcription is purely conventional and should be read in this case as the change in predicted probabilities instead of partial derivative; the change in expected probability is calculated at the mean. regresar
32 See Booroah (2002) and Greene (2000) for issues related with ordered and multinomial discrete choice models and the IIA hypothesis. regresar
33 Although participation in the labor market is one necessary condition to prevent someone from living in an abject state, it is far from being sufficient. There may well be factors within the labor market that tacitly exclude certain groups from the process of generating higher incomes. regresar
34 This last issue is investigated in a subsequent study as it is beyond the scope of the present research. regresar
35 Transfers made by the Haitian Diaspora to their relatives amount to roughly 1 billion US dollars, while actual GDP is 3.4 billion. regresar
36 More than 60 per cent of household do possess agricultural land (See table A6 in annex). regresar
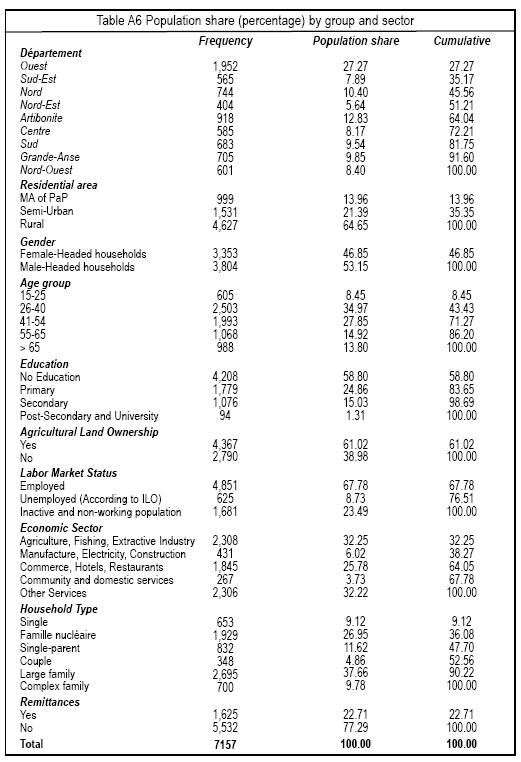
37 As a matter of fact, subsistence agriculture is prevalent, with more than 80 per cent of cultivated land on small plots les than 0.65 hectares (see Doura, 2001: 67). regresar
38 It would also be very useful to have series of data in order assess the change in farmers' welfare after the liberalization process that started in the early 1980s when import quotas and tariffs on agricultural goods (in particular rice) were basically brought down to zero, leaving farmers in the impossibility to compete with 'subsidized' imports. regresar
39 Nonetheless, land distribution there is the second least unequal after Département du Centre. regresar
40 There exists another strand in the literature that associates class conflicts and political upheavals with 'polarization', a concept that is different from (though not incompatible with) inequality (see among others, Esteban and Ray, 1994 & 1999; Wolfson, 1994; Gradín, 2000; and Duclos, Esteban, and Ray, 2003). Polarization in the Republic of Haiti is investigated in a forthcoming paper. regresar

