


Servicios Personalizados
Revista
Articulo
 Inglés (pdf)
 Artículo en XML
 Referencias del artículo
 Enviar artículo por email
Indicadores
-
 Citado por SciELO
 -
 Accesos
Links relacionados
-
 Similares en
SciELO
Similares en
SciELO
Compartir

 Permalink
Estudios sociales (Hermosillo, Son.)
versión impresa ISSN 0188-4557
Estud. soc vol.14 no.27 Hermosillo ene./jun. 2006
Artículos
The Arizona–Sonora Region: A Decade of Transborder Region Building
Vera Pavlakovich–Kochi*
* Director del Programa de Desarrollo Regional en el Departamento de Desarrollo Económico, Universidad de Arizona. E–mail: vkp@email.arizona.edu
Fecha de recepción: 15 de abril de 2005.
Fecha de aceptación: 19 de mayo de 2005.
Resumen
Este artículo se centra en el periodo 1990–2000, una década de intensificada integración económica en la región Sonora–Arizona. En parte, este proceso representa un resultado anticipado de la implementación del TLCAN y, por otro lado, el efecto de la yuxtaposición con otras tendencias regionales y globales. En particular, esta década manifiesta un tiempo de intensificación de la integración económica, por medio de la cooperación transfronteriza para el desarrollo económico entre gobiernos y asociaciones público–privadas apoyadas por éstos. Entre los objetivos centrales del Plan Estratégico Binacional de Desarrollo Económico de la Región Sonora–Arizona estaban fortalecer la competitividad regional en los mercados del TLCAN y global, atraer más inversión y, a través del incremento en las exportaciones, mejorar el crecimiento económico general y elevar el ingreso.
Los resultados del análisis realizado sugieren un creciente papel de las exportaciones en la economía de la región. Sin embargo, quienes toman las decisiones enfrentan dos preocupaciones fundamentales. Primero, indicadores seleccionados de la participación en los mercados sugieren que la región está perdiendo posición relativa dentro del área del TLCAN. Segundo, parece ser que los beneficios de la creciente integración económica y la consecuente expansión del comercio no se han aprovechado cabalmente y, hasta ahora, no se han manifestado en indicadores promedio de bienestar. Estos eventos demandan una reevaluación urgente de las estrategias económicas regionales.
Palabras clave: integración transfronteriza, regiones transfronterizas formales, región Sonora–Arizona, experiencia TLCAN, economía fronteriza.
Abstract
This paper focuses on the 1990–2000 period, a decade of intensified economic integration in the Arizona–Sonora Region. In part, this process represents an anticipated outcome of the implementation of NAFTA, and in part a result of juxtaposition with other regional and global trends. In particular, this has been a time of intensified formal integration through crossborder cooperation in economic development among governments and government–supported public–private partnerships. A major objective of the binational Strategic Economic Development Plan for the Sonora–Arizona region was to enhance the region's competitiveness in the NAFTA and global markets, attract more investment, and through increased exports, enhance overall growth and rise incomes.
The findings of this analysis suggest an increasing role of exports in Region's economy. Nevertheless, two major concerns are facing the Region's policy decision makers. First, the selected indicators of market shares suggest that the Region is loosing its relative position within the NAFTA area. Secondly, It appears that the benefits of increased economic integration and resulting expansion of trade within the NAFTA area, have not yet been shown in average indicators of well–being. These new developments call for an urgent reevaluation of regional economic strategies.
Key words: Transborder integration, formal transborder regions, Arizona–Sonora Region, NAFTA experience, border economy.
Introduction
The concept of a region as a new organizing framework for economic and social life in contemporary capitalism has emerged as a powerful tool in economic development practice of the late 1980s and early 1990s. According to Storper (1997), the most general and necessary role of the region is as the locus of "untradable interdependencies," which take the form of conventions, informal rules, and habits that coordinate economic actors under conditions of uncertainty. Furthermore, these relations constitute region–specific assets in production, which in Storper's opinion are a central form of geographic differentiation in what is done, how it is done, and in the resulting wealth levels and growth rates of regions. The signing of the North American Free Trade Agreement (NAFTA) in 1993 (in effect since January 1994) was a strong impetus for joint transborder actions in support of Kenichi Ohmae's (1993) concept of "region–state" and Boisier's (1993) notion of "virtual regions" (Wong–González, 2004) that span international boundaries.
Two different, yet complementary types of regional integration processes are shaping the contemporary U.S.–Mexico border region: functional and formal (Wong–González, 2004). The functional integration process results from operation of markets, social actors and opening of the economies. The formal integration is primarily a product of deliberate agreements between governments in partnership with various economic and social actors.
Like elsewhere in the U.S.–Mexico border region, the functional integration between Arizona and Sonora has been driven mainly by the maquiladora sector, which was introduced in the mid 1960s and together with the automotive sector1, soon surpassed the more traditional cross–border ties in the agriculture and mining industries.
The formal process of economic integration in the U.S.–Mexico border region is a relatively recent phenomenon. At the time of the emergence of this new transboundary regionalism in North America, the states of Arizona and Sonora already had important institutions in place: the Arizona–Mexico Commission and its sister organization, Comisión Sonora–Arizona. Their predecessor was the Arizona–Mexico West Trade Commission, which was established in 1959 with a purpose to address topics of common interest related to economy, education, health and communications (Wong–González, 2004). A long tradition of cross–border economic and familial ties served as an important factor in recent process of the formal, government–supported economic integration.
Arizona and Sonora formalized their objective to build an "integrated economic region with a competitive advantage in the global market" at the 1993 plenary session of the Arizona–Mexico Commission and Comisión Sonora–Arizona. Known as the Strategic Economic Development Vision for the Arizona–Sonora Region (SEDVASR), the project identified specific goals to increase the region's exports, expand shares in the NAFTA and global markets, and make the region more attractive for investment. These goals, which were very similar to the goals of other emerging transborder regions, reflected a new paradigm in economic development based on the notion that regional competitiveness was a major underlying force of economic growth (see Porter, 1990).
With the completion of the SEDVASR project in 1998, when the last of twelve sector–specific reports was published2, the set of recommendations became a "blue print" for the binational regional economic development. Local and regional economic development organizations and public–private partnerships adopted the general idea of a transborder region as a necessary new framework for competitive industries and pursued their specific initiatives to strengthen their economic ties across the border3.
The purpose of this paper is to identify major trends in the Arizona–Sonora Region during the last decade of increasing economic integration between the United States and Mexico, which has coincided with formal efforts of the two neighboring states to enhance the transborder region building. The analysis focuses on changes in economic structure, employment, exports and share of external markets, and selected aspects of well–being.
Judging from export and cross–border commodity flow data, the integration of the Arizona–Sonora Region in the global economy has advanced substantially since the early 1990s. While these general indicators have been frequently used to show NAFTA's positive impacts on the Region's participation in global economy, a major policy–related concern is whether the benefits of increased participation in the global trade had been translated into economic growth and the overall improvement of quality of life of the border residents. The Regional Economic Indicators for the Arizona–Sonora Region, introduced in 19994, were designed to monitor trends in these areas and provide the Region's policy– and decision–makers with a better understanding of the Region's relative position within the entire U.S.–Mexico border region. The Indicators provide a major source of data used in this analysis.
Three related questions arise: first, is NAFTA working for the region? Second, does the formal integration pay off by making the Region more competitive? And third, are the residents better off today than a decade ago?
There are several reasons why it is difficult to empirically test the relationship between the three aspects. Currently, there are no simple models that could measure these causal relationships. This has been compounded with the limited availability of comparable data in the international context. Another shortcoming is that it is hard if not impossible to delineate impacts of formal and functional integration. Within these limitations, this analysis focuses on major trends without being able to prove statistical cause–effect relationships. Despite these limitations, the findings shed some light on the direction of economic transformation and challenges in a border region.
The context: uneven yet highly interdependent partners
Arizona and Sonora share the same ecosystem (the fragile Sonoran Desert region), common history (Spanish province Pimería Alta, later part of the Republic of Mexico), several Native Indian tribes on both sides of the border, and a string of six twin border towns. The 361–mile (581 Km) boundary between Arizona and Sonora (established by the Gadsden Purchase in 1854) had never been a true barrier to movements of people, goods or money5. Indeed, the U.S. capital was instrumental in the development of Sonora's mining at the end of 19th and the beginning of the 20th century. With their long tradition in mining and ranching, Sonora's miners and ranchers were indispensable in southern Arizona's development of mining and ranching at the end of 19th century. Sonora continued to be a major source of migrants to Arizona's labor markets in agriculture and mining throughout the 20th century (Lozano et al., 1997).
One of the unique cross–border business ties, which resembles a modern cross–border industry cluster, traces its development to the 1930s in the border city of Nogales, which has developed into a major point of entry for tomatoes and other winter–grown vegetables in Sinaloa shipped to U.S. and Canadian markets. Largely run by families with ties on both sides of the border, the business represents an intricate binational system of capital, landowners, growers, field workers, brokers, distributors and shippers (Pavlakovich et al., 1997, Tronstad et al., 1997).
Cross–border shopping is another area of traditional interdependency of border communities. Tourism for pleasure, but also for medical reasons, affects the economies of other places outside the border communities. The development of Sonora's resort communities of Puerto Peñasco and San Carlos, among others, is closely related to the Arizona residents holding their second or vacation home there. On the other hand, Sonora's residents represent more than 90 percent of all Mexican visitors to Arizona, spending about $1 billion annually in Arizona (Charney and Pavlakovich, 2002).
A major economic connection has developed through the maquiladora sector. Arizona–based companies operate about 30 percent of maquiladoras in Sonora, while about 45 percent of Arizona's exports to Mexico are maquiladora–related (Pavlakovich, 1995). Sonora's economy has been much more dependent on the maquiladora sector and the related automotive industry, which together account for 70 percent of Sonora's exports and 77 percent of imports to Sonora (Sonora Government, 2003).
As elsewhere in the U.S.–Mexico border region, there are pronounced differences between the north (Arizona) and south (Sonora) side of the border. These differences pertain to demographic dynamics, employment and sources of income, size and composition of gross state product (GSP), and most of all, income per capita.
With close to 5.5 million people (U.S. Bureau of Census, 2003), Arizona is more than twice the size of Sonora (INEGI, 2002). In the last decade, Arizona's population has been growing by 4 percent annually, which is almost twice Sonora's population growth (Table 1). Arizona accounts for 8.3 percent of the U.S. border states' population and ranks 3rd in size among four U.S. border states. Sonora accounts for 13.3 percent of Mexico's border population and is the smallest of six Mexican border states.
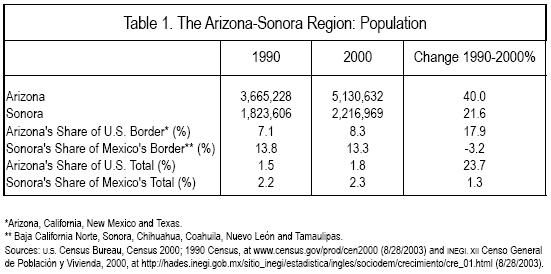
Arizona's remarkable population growth rate of 40 percent from 1990 to 2000 (one among the fastest in the United States) was primarily due to high dynamics of its Hispanic population. While the non–Hispanic population grew at a rate of 28.5 percent, the Hispanic population in Arizona grew by 90.4 percent between 1990 and 2000. According to 2000 census, population of Hispanic origin represented 25.3 percent of the total Arizona's population, an increase from 18.6 percent a decade ago. Close to 90 percent of Hispanic population in Arizona is of Mexican origin (U.S. Bureau of Census, 2003).
The two states also differ in age structure of their population. Arizona has a significantly larger percent of senior residents (65 and older) accounting for 13 percent of the total population, while Sonora has only 4.8 percent. Close to one third of Sonora's population is younger than 15 years; in Arizona, 22.4 percent of the total population is younger than 15. From an economic perspective, the most relevant consequence of age structure is the relationship between economically active and dependent population, and flow of entrants into labor force. Migration from Mexico contributes to the "juvenilization" of Arizona's population in general and its labor force in particular.
A pronounced difference exists in the size of economies measured in GSP (Table 26). Arizona's economy is about 10 times larger than Sonora's ($160 billion in Arizona and about $15.5 billion in Sonora in 2001). However, both Arizona and Sonora's shares of GSP are below their respective shares in border and national population.
Arizona and Sonora have played different roles within their respective national economies. Arizona has been the beneficiary of the so–called sunbelt industrialization process, which since the 1960s involved relocation of manufacturing production from the older industrial regions in the Northeast and Midwest to the southern states with cheaper labor. Despite its outstanding growth rates, Arizona still lags behind the national average in several key areas, such as income per capita and educational attainment.
In contrast, Sonora like other Mexico's border states, has been more economically developed than the rest of Mexico. It also has had relatively higher wages and lower unemployment rates. During the 1950s and 1960s, Sonora played a relevant role as agricultural producer within the Mexican economy. In this period, Sonora was known as "Mexicos's granary" and "cradle of the Green Revolution". Starting from the 1960s and through the 1970s and 1980s, Sonora showed up as location place for export activities in manufacturing (maquiladora and automotive) (Wong–González, 1993 and 1996).
Between 1990 and 2001, Arizona's share of the U.S. gross domestic product (GDP) has increased from 5.4 to 6.9 percent, suggesting that the economic growth has been more dynamic than the national average. Likewise, Arizona's share of the U.S. border states' GSP has increased in the same period. In case of Sonora, the situation is different. While Sonora's economy continues to outpace Mexico's average, and consequently continues to increase its share of the nation's Gdp, Sonora shows a relative slowdown compared to the Mexico's border states average growth; its share of the combined border states' GSP fell from above 12 percent in 1993 to less than 12 percent in 20017.
A decade of pronounced economic transformation, mostly south of the border
Both, Arizona and Sonora have seen their economies being transformed from traditional sectors such as agriculture and mining to manufacturing and services. Arizona's transformation occurred between the 1960s and 1980s (Silvers 1998). The transformation of Sonora's economy started later, in the mid 1980s and continued into the 1990s (Vázquez Ruiz 1998; Wong–González, 1993 and 1996).
In the early 1990s, Arizona's agriculture sector employed less than one percent of the total employment, a significant change from about 33 percent of the total employment in 1939 and 5.1 percent in 1967. Like agriculture, the mining sector once played a major role in Arizona's economic development. By early 1990s, however, it employed less than one percent of the total employment (Silvers, 1998). Overall, the manufacturing sector is the leading generator of external–market jobs in Arizona. Arizona's rise of manufacturing was associated with the post–World War II expansion in defense–oriented durable goods manufacturing (aircraft and missiles), followed by a rise in the electronics components and the industrial machinery and computer manufacturing sectors. In the early 1990s, the telecommunications equipment manufacturing, a high–technology sector, grew very rapidly (Silvers, 1998).
During the last decade, the structure of Arizona's economy, measured in GSP by sector, changed only little (Table 3). The contribution of the services sector to GSP continued to increase at the expense of agriculture and mining sectors. The manufacturing sector's share increased from 13.1 in 1990 to 13.8 percent of the state's GSP in 2000.
Over the last three decades, the economy of Sonora has experienced significant changes in its sectoral and spatial structure. In the sectoral sphere, the state's productive structure has been transformed by the important growth of manufacturing linked to maquiladora production and the operation of export platforms like the Ford plant in Hermosillo. Spatially, and in terms of urban expansion, the state reflects the emergence of new regional economic nuclei and large urban centers in the border zone (Pavlakovich, Lara and Wong–González, 1996).
During the last decade, Sonora's economy continued to transform more rapidly than its neighbor to the north. Manufacturing share of GSP increased from 10.4 percent in 1990 to 19.3 percent in 2000, while agriculture and mining declined from 15.3 and 8.3 percent in 1990 to 6.7 and 1.5 percent in 2000, respectively (INEGI, 2001).
The arrival of the maquiladora industry, concentrated mostly in the border towns, contributed substantially to the growth of the Sonora's manufacturing sector. During the 1980s the state targeted economic diversification through various means, including strong government participation in the development of an improved infrastructure of roads and industrial parks, incentives for foreign manufacturing and promotion of Sonora internationally as a location for industry. As a result, other types of investment developed, most notably in the automotive industry, where Ford Motor Company became the largest industrial investor in the history of the state with $500 million in 1986 (Vázquez Ruiz, 1998)8.
Sonora also received considerable investment from the domestic private sector that used the opening of trade as a platform to international trade9. However, the growth of manufacturing was primarily due to foreign direct investment. In 1994, for example, manufacturing attracted 43.4 percent of the total foreign investment; mining was a distant second with 36.4 percent (Vázquez Ruiz, 1998)10. For the period 1999–2004, the sectoral distribution of foreign direct investment was as follows: manufacturing,70.3 percent; mining, 11.8 percent; agriculture, 9.4 percent; services, 4.2 percent; construction, 2.4 percent; and retailing, 1.9 percent (Secretaría de Economía, 2004).
There is no doubt that, when the composition of GSP by sector is considered, the economies of the two states are more similar today than 10–15 years ago. Both are dominated by services with declining shares of agriculture and mining. Manufacturing plays a more important role in Sonora's economy, while the services sector is more important in Arizona. The transformation of Sonora's economy is directly linked to its border location and the maquiladora sector (Vázquez Ruiz 1998; Wong–González, 1993 and 1997).
Another way of tracing transformations in the economic structure is by looking at the changes in the employment structure (Table 4).
Arizona's economy is a services–dominated economy. The shift in Arizona's employment patterns away from the goods–producing sectors toward the broadly defined service sectors reflects much longer–term trends that follow the nation as a whole (Silvers, 1998). In 2000, services (including the government sector) provided jobs for 79.6 percent of all employed persons 16 years and older. This has been an increase from 71.7 percent a decade earlier. The manufacturing sector, despite an absolute increase in number of employees, decreased percentage–wise from 12.9 percent in 1990 to 10.2 percent in 2000. Employment in the construction sector increased both absolutely and relatively to 8.7 percent of all employed in 2000. The agriculture, forestry and mining combined, lost close to 40 percent of the 1990 employment level, and dropped from 3.4 percent to 1.5 percent share of the total employed persons in 2000.
Within the last decade, the transformation of Sonora's sectoral employment was more profound than Arizona's. The primary sector (agriculture and mining) employed approximately the same number of persons in 2000 and 1990, but its share in the total employment declined from 24.2 percent to 16.7 percent. All other sectors gained in absolute and relative terms, with the manufacturing sector gaining the most. The number of employed persons in manufacturing increased by 75 percent, while its share increased from 16.1 to 19.5 percent of the total employed persons 12 years and older.
It remains to be seen how the latest developments – the contraction of the maquiladora sector due to the recession in the U.S. economy and the competition from other countries with maquiladora–like programs–will affect the overall employment structure. In early 2003, the maquiladora employment started to show signs of recovery, but some observers believe that some of the jobs in the sector might be permanently lost.
Increasing globalization through export–driven economy
Regional economists attribute much of the economic growth of regions and states to growth in the industries that sell to markets outside a given region or state, since such sales bring in revenues and thereby, earnings. These earnings are then spent locally creating more jobs through a multiplier effect (Silvers, 1998).
One measure of the relative importance of exports in regional economy is the ratio of exports to GSP. This is often used as a measure of internationalization of economy or indication of globalization. The value of Arizona's exports represents between 8 and 10 percent of the GSP, slightly above the average for the United States. The total value of exports from Sonora, including maquiladora– and automotive industry–related exports, represented a much larger portion of the state's GSP: between 40 and 50 (period 1993–2000). In comparison with the national average (approximately 30 percent), Sonora's economy has been much more "globalized".
The importance of exports in a state's economy is also reflected in exports per capita value. Arizona exported $3,062 per capita in 2000, which is above the U.S. average. The export orientation of Sonora's economy is even more accentuated. In 2000, the value of Sonora's exports was $6,405 per capita compared to $1,708 for Mexico. However, to understand better the nature of Sonora's exports, one must look at the types of exported products.
Sonora's exports consist of four distinctive categories: (a) definitive exports, (b) temporary exports, (c) maquiladora exports and (d) automotive exports (Pavlakovich, Lara and Wong–González, 1996). Definitive exports include primarily sales from firms founded by Mexican investment. The agricultural, livestock and fisheries are the most important of Sonora's definitive exports to U.S., accounting for approximately one third of the total definitive exports. The manufacturing and mining accounted together for another 35 percent of the definitive exports. In early 1990s, they had a clear orientation toward the NAFTA market, which was a destination for 68 percent of all definitive exports11.
The maquiladora and automotive industry exports contributed $4 of every $5 of Sonora's exports, or approximately 80 percent of the total exports from Sonora. The growth of exports in the 1990s is explained principally by the expansion of maquiladora operations and by the production for export by the Ford plant. Data for 2001 suggest that their share might have decreased to 75 percent. It is not clear yet if this might be a consequence of the recession, or is it due to a rise in Sonora's definitive exports. The composition of maquiladora exports in 1993–1994 was dominated by electric and electronic components (15.7 percent), industrial machinery and components (39.6 percent) and transportation equipment (35.2 percent). This composition appears to remain pretty stable. Almost all of these exports were destined for the U.S. markets.
Temporary exports are mainly goods sent outside of Mexico for the purpose of being transformed or repaired and then returned to Mexico. Overall, they represent a small share of the total exports. Data for 1994, based on SECOFI and BANCOMEX via COLEF in Pavlakovich, Lara and Wong–González, 1996.
The Sonora export sector is strongly linked to the North American market in general, and to U.S. in particular. Geographic proximity and the investment of U.S. capital in extractive activities initially, and in manufacturing activities recently, have contributed to this link. These transformations correspond to the intensive process of internationalization of the state's economy that has been generated by capital mobility on a global scale, the segmentation of the production process and the reduction of transportation costs. Adjacency to the United States, differences in wages, abundant labor and fiscal and legal changes for foreign direct investment have also contributed significantly to the globalization process. As a result, Sonora has strengthened its external orientation (Vázquez Ruiz, 1998; Wong–González, 1993 and 1997). The 1990s in particular were years of growing integration with the foreign market. Between 1990 and 1995 total foreign exports increased by 203 per cent (Pavlakovich, Lara and Wong–González, 1996).
Mexico is Arizona's No. 1 market among individual countries, but still accounts for little more than 30 percent of total exports from Arizona. Together Mexico and Canada (i.e., NAFTA markets) account for less than 50 percent of Arizona's exports. In contrast, more than 90 percent of Sonora's exports are linked with the NAFTA markets12. Thus, Sonora's economy is almost exclusively dependent on the NAFTA markets, most notably on the United States economy. Arizona, on the other side, has a more balanced distribution of its exports between Mexico and other markets – Europe and Asia–and thus can offset the downturns in one market with increasing exports to other markets.
The extraordinary increase in Sonora's exports (223.8 percent between 1993 an 2000) mirrors the general trend in the U.S.–Mexico trade in the 1990s. A comparison between actual trade volumes after 1993 and expected volumes of trade, based on growth rates between late 1980s and early 1990s, show the net gain above expected levels (Pavlakovich, Lara and Wong–González, 1996). Although this coincides with the implementation of NAFTA, which prompted many observers to conclude that NAFTA "works," several other factors need to be taken into consideration. As far as manufactured products are concerned, the tariffs were already relatively low, and therefore the mere lowering or elimination of tariffs as part of the NAFTA implementation had a relatively small effect. A major impact on increase in exports of manufacturing products was the 1994 peso devaluation (by about 40 percent), which triggered an expansion by maquiladora companies, since it had the effect of cutting their peso–based costs in dollar denominated budget (Vargas, 1996). Thus, developments other then pure NAFTA contributed to the increase of trade between the United States (and Arizona) and Mexico (and Sonora).
The sectors that gained directly from the implementation of NAFTA are textile and apparel, and livestock and agriculture. The textile and apparel sector gained greater strength in part from the more open trade and investment rules with the start of NAFTA (Vargas, 1996). Sonora is one of the major exporters of livestock. The NAFTA provisions in combination with peso devaluation made Sonora's livestock more competitive (Vázquez Ruiz, 1998). Sonora also indirectly benefited from NAFTA's stimulation of agricultural exports from Sinaloa, a major supplier of winter fresh produce to markets in the United States and Canada.
The decline of Sonora's export volume since 2000 reflects the recession in the U.S. economy (combined with the negative impact of the 9/11 terrorist attack). A major impact on the Sonora's maquiladora sector was felt in 2001 and 2002. As elsewhere in Mexico, the sector contracted substantially. By the end of 2002, about 29,000 jobs or close to 30 percent of the maquiladora employment was eliminated in Sonora (GAO, 2003). The exports from Sonora declined 25.6 percent between 2001 and 2002. Arizona's exports to Mexico and Canada declined 14.3 percent in the same period.
The most recent developments have not only shown how closely the economies of Arizona and Sonora are intertwined, but also how they are vulnerable to changing conditions on a global scale as new regions with lower production costs open up and cause a new wave of relocation of production operations. The competition from China, which currently offers about one third of production costs in Mexico, has been seen as a major threat to low–skill maquiladora sector in Sonora (Quintin, 2003; Wong–González, 2004)13.
Indicators of well–being: a mixed bag of signs
The changes in income per capita, labor participation, (un)employment status and educational attainment provide insights into general well–being of population.
Conventional wisdom suggests that export–related jobs are paid more, and, therefore, it is expected that with increasing exports there is also an increase in higher paying jobs. With growing exports during the last decade, one would expect that the number of export–related jobs in Arizona grew, and accordingly, that incomes grew as well.
Arizona's income per capita was $17,187 in 1990 and $25,361 in 2000 (U.S. Bureau of Census, 2003), an increase of close to 48 percent. This is below the national growth rate, resulting in a wider gap between Arizona and the national average. In 1990, Arizona's per capita income was 87.6 of the national average, and ten years later it dropped to 85.2 percent. Among other border states, California and Texas had higher per capita income than Arizona. Only Texas, among border states, grew faster than the national average.
Average wages and salaries14 increased by 32.1 percent between 1994 and 2001, which is also below the national average of 34.8 percent. The gap between Arizona and the nation's averages has widened as well, although Arizona is closer to the national average in wages and salaries than in per capita incomes. The highest relative increase in wages and salaries occurred in the wholesale and retail trade sector, followed by finance, insurance and real estate. The manufacturing sector's wages and salaries increased only by 20.9 percent and dropped from the second highest to the third place, behind mining and wholesale trade.
An important characteristic of Sonoran employment –similar to the whole Mexican economy– is a large existence of "informal" economy, where more than 50 percent of the economically active population (53.8 percent in 1996) received no wages or salaries. In all, almost three quarters of economically active population in 1996 received less than 3 minimum salaries or no salaries at all (García de León, 2000).
A lack of comparable data on income per capita for Mexican states15 limits the analysis to wages and salaries in the maquiladora sector. The maquiladora sector was the main generator of new jobs. Between 1989 and 1994, the maquiladora sector added close to 70,000 new jobs, more that all sectors together (García de León, 2000). The nominal wages (in current pesos) in Sonora's maquiladoras increased by more than two and half times between 1990 and 1997, which was slightly above the national average (INEGI, 2001; and Gobierno del Estado de Sonora, 1992 and 1998). In the same period, the nominal salaries of technical and administrative personnel increased by more than three and a half times.
The findings of a recent study based on state–level data (Silvers, 2004) suggest that the maquiladora sector has had a greater impact in distributing income at the lower rather than the higher end of the income scale. Moreover, Mexican states with relatively higher maquiladora sector activity have improved incomes for low income workers, and at the same time reduced underemployment. The evidence from other studies shows that the maquiladora sector has been engaging a more technologically–oriented workforce than had earlier been the case, and also involving Mexican capital to the extent that more of smaller size maquiladoras are now under Mexican rather than American ownership (Silvers, 2004).
In dollar terms, however, the low–end maquiladora wages have seen little improvement. This is particularly important at the level of border communities whose economies are profoundly dollarized. Indeed, between 1990 and 2000, peso devaluation at the end of 1994 and the beginning of 1995, might have wiped out any nominal increases. This is certainly true in the case of minimum wages. Excluding benefits, dollar cost per hour (minimum wage)16 was $0.59 in 1990 and $0.72 in 1993, then dropped to $0.38 cents in 1995 as a consequence of devaluated peso. By 2001, the hourly cost increased to $0.61 cents, below its 1991 level (Twin Plant News, 2003). By comparison, the prevailing Federal minimum wage in the Unites states was $3.80 in 1990, $4.75 in 1996 and $5.15 since 1997 (U.S. Department of Labor BLS, 2003).
The maquiladora sector, however, has been important in generating new jobs in Sonora. It also has been important in increasing women's employment rates (García de León, 2000). Female participation in Sonora's labor force has increased absolutely and relatively. The number of females in the labor force17 increased from 138,000 in 1990 to 256,000 in 2000 (INEGI and Gobierno del Estado de Sonora, 2001), an 85.5 percent increase in comparison with 28.4 percent increase in number of males. Female participation in total labor force increased from 23.9 percent in 1990 to 31.2 percent in 2000, which mirrors the national trend.
Arizona's female labor participation rates have been above those of Sonora, but are characterized with slower changes in the last decade. In fact, despite an absolute increase in females18 in the civilian labor force (about 10 percent between 1990 and 2000), female participation in the labor force declined from 56.2 percent in 1990 to 45.3 percent in 2000 (U.S. Bureau of Census, 2003). Arizona's female participation in labor force is significantly above the U.S. average of 29.6 percent.
Official statistics for both states show low unemployment rates, which, as many observers argue, are more a result of the nature of definition of unemployment, than actual reflection of the number of people without jobs. The data, however, are useful for comparison with the national unemployment rates. For the last decade, both Arizona and Sonora have shown the unemployment rates below the respective national averages as well as the other border states.
Educational attainment is closely related to incomes. Fullerton's (2001) study of the affects of education on per capita income underscored the importance of educational attainment, and in particular the importance of high school graduation for people in border counties, where the failure to graduate from high school imposes severe financial penalties. In comparison with Arizona, Sonora's population 25 years and older is more disadvantaged with regard to educational attainment: only 53.4 percent of Sonora's 25 and older completed high school (or higher) compared to 81 percent of Arizona's 25 years and older, in 2000. When higher degrees are considered, it appears that Sonora is ahead of Arizona: 23.6 percent of Arizona's 25 years and older have B.A. and higher degree, while in Sonora, 28.7 percent of 25 years and older have higher degree (including B.A., M.A. and Ph.D.)19.
The educational attainment of Arizona's population improved between 1990 and 2000: both the percentage of population with high school and with B.A. degree had increased from 78.7 to 81 percent and from 20.3 to 23.5 percent, respectively. Likewise, the educational attainment of Sonora's population has improved: population with postprimary20 education increased from 52 in 1990 to 60.9 percent in 2000 (INEGI, 2001).
Arizona–Sonora Region: lagging behind the U.S–Mexico Border Region
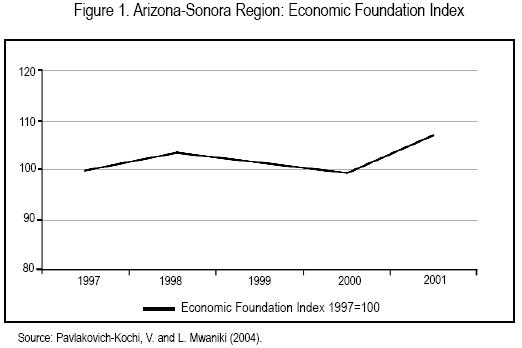
Two composite indexes (Pavlakovich–Kochi and Mwaniki, 2004) summarize trends in the Arizona–Sonora Region and compare them with the entire U.S.–Mexico region. The emphasis is on the relative intensity and direction of change rather then the absolute level.
The Economic Foundation Index (Figure 1) measures the economic growth based on the changes in the Region's relative shares of the entire U.S.–Mexico border region's manufacturing, agriculture and transportation services (expressed as contribution to GSP). A basic message is that despite annual oscillations, the Arizona–Sonora Region has been improving its relative position, suggesting that the growth was generally above the average for the entire border region. However, the Region's shares of the major components of GSP are still below its share of border population.
The NAFTA Index (Figure 2) is made up of two sub–indexes that measure changes in the Region's competitiveness from different yet related angles. The Regional Export sub–index measures changes in the Region's share of NAFTA and global markets. This sub–index suggests that despite a tremendous increase in exports (Table 5), the Region's share in the NAFTA area compared to the entire U.S.–Mexico border region has been declining. This can be interpreted as declining competitiveness as other states and regions were able to seize more opportunities from NAFTA than either Arizona or Sonora.
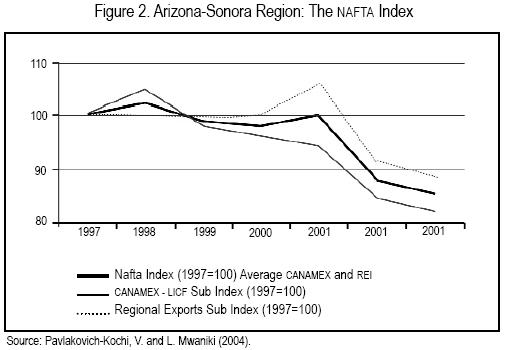
The CANAMEX 21 sub–index measures the region's relative position as a gateway to and from Mexico. It is based on the share of commodity and traffic flows crossing the border. The sub–index suggests that the Region is loosing in competition with other border states, despite overall absolute increase in cross–border commodity and traffic flows.
In 2001, every U.S.–Mexico border port–of–entry (BPOE)22 experienced a decline in dollar value of shipped commodities in both, south– and northbound commodity flow. Among the top four border districts, Nogales experienced the largest percentage decline, and next to Laredo, the largest absolute decline in dollar value of commodity flow between 2000 and 2003. An analysis of exports from Arizona to Mexico and a shift toward Asian markets suggests that in particular two factors might have affected a larger decline in commodity flow through the regions' BPOE. First, between 2000 and 2003, the number one commodity exported to (and imported from) Mexico was the transportation equipment. Major linkages are between the Great Lakes region and eastern Mexico, thus favoring Texas BPOE, most notably the Laredo District. Thus, both geography and the nature of U.S.–Mexico trade have been less favorable to the Arizona–Sonora region. Secondly, the "China effect" seems to have impacted the western part of the NAFTA area to a greater extent. On one hand, directly by causing contraction in the maquiladora sector as a number of parent companies moved their operations from Mexico to China. On the other hand, western U.S. states, for which the Arizona–Sonora BPOE are natural gateway to and from Mexico, also seem to have shifted some of their trade from Mexico to China. Thus, the China effect is at the same time a "curse" (for maquiladora in Mexico) and "opportunity" for U.S. and Canadian companies. It is likely that the western portion of the NAFTA area has been influenced by this shift more than the east portion.
Conclusions
The 1990–2000 period was a decade of intensified economic integration in the Arizona–Sonora Region. In part, this has been a predicted impact of the implementation of NAFTA, and in part a result of juxtaposition with other regional and global trends. For example, the 1994/1995 peso devaluation was largely responsible for an expansion of the maquiladora sector in the mid 1990s. The maquiladora sector (somewhat modified under NAFTA regulations)23 remained the backbone of the economic integration in the region.
This also has been a time of intensified formal integration through cross–border cooperation in economic development among governments and government supported public–private partnerships. A major driving motive of regional transborder alliances was to enhance regional competitiveness in the NAFTA and global markets, attract more investment, and through increased exports, enhance overall growth and elevate incomes.
The findings of this analysis suggest an increasing role of exports in Region's economy, both in absolute terms and as percent of GSP. In particular, Sonora's economy continued on a path of profound internationalization of its economy through export–driven, foreign–investment supported, maquiladora and automotive industries. Selected industries in the agriculture and livestock sector also benefited from the NAFTA provisions and cheaper peso, which jointly boosted their exports.
Measured in terms of relative contribution of each sector to GSP, the economies of Arizona and Sonora are more similar today than a decade ago. Individually, and jointly as a single economic region, the two states also saw their shares of the entire U.S.–Mexico border region's GSP improve, although their relative economic importance is still lagging behind their shares of border population.
Two major concerns are facing the Region's policy decision makers. First, the selected indicators of market shares suggest that the Region is loosing its relative position within the NAFTA area. This may be in part due to geographical location, as other regions are more favorably located relative to major trade corridors within North America. But it may also suggest that the Region has not used all opportunities from NAFTA. Latest data show a profound shift of Arizona's exports to Asia, mainly China and Malaysia. Thus, while the Region seems to keep up with the overall global competitiveness, it is obvious that the Region has not utilized all opportunities from NAFTA. But this trend may also be a reflection of a changing nature of regional competitiveness, which increasingly depends upon not only what is done, but rather how is it done. After all, competitiveness encompasses more than just short–term marketing strategies. A growing literature suggests that an emphasis on fundamentals, including investments in education, technology and innovation, is not only necessary in sustaining, but more importantly, in lifting the level of regional economic development.
Secondly, despite the fact that the relationship between trade, economic growth and general well–being has not been examined in a rigorous cause–effect framework, some general conclusions can be drawn. It appears that the benefits of increased economic integration and resulting expansion of trade within the NAFTA area, have not yet been shown in average indicators of well–being. This is particularly the case south of the border, where the maquiladora sector became a major driver of regional employment, but where the opportunity to increase real incomes of low wage workers was partially wiped out by a peso devaluation that coincided with the NAFTA inauguration. Thus, the same factor that triggered maquiladora expansion and more trade, resulted in a widening gap between Arizona's and Sonora's wages. More recently, as new global competitors emerged, they too added to the vulnerability of the low–income/low technology production.
These new developments call for an urgent reevaluation of regional economic strategies. As Díaz–Bautista (2003) suggested, future development of the border region must be one of sustainable development models, which will take into consideration complex relationships between exploitation of initial resources, direction of investment, orientation of technology, evolution of institutions and implications for human development in the region.
References
Boisier, Sergio (1993) Postmodernismo territorial y globalización: regiones pivotales y regiones virtuales. Doc. 93/19, Serie Ensayos, ILPES–ONU. Santiago de Chile. p. 22. [ Links ]
Camberos, Mario and Luis Huesca R. (2002) Cambios económicos, competitividad y bienestar de la población en la región noroeste de México en la globalización. Estudios Fronterizos, Vol.3, Num.6, Julio–Diciembre 2002, IIS–UABC. [ Links ]
Charney, Alberta H. and Vera Pavlakovich–Kochi (2002) The Economic Impacts of Mexican Visitors to Arizona: 2001. University of Arizona Karl Eller College of Business and Public Administration, Economic and Business Research Program. Available at http://ebr.eller.arizona.edu. [ Links ]
Cornelius, Peter K. (2003) Executive Summary, in Global Competitiveness Report, World Economic Forum. Accessed at http://annualmeeting.weforum.org/pdf/ger/GCR_2002_2003/GCR_Executive_Summary_2002_2003, on 11/6/03. pp. xi–xxiii. [ Links ]
Díaz–Bautista, Alejandro, José Alberto Avilés y Mario Alberto Rosas Chimal (2003) Desarrollo económico de la frontera norte de México. Unpublished manuscript. [ Links ]
Fullerton, Thomas F. Jr. (2001) Secondary Education: Its Impact on Border Income. The Border Economy (June), accessed at http://www.dallasfed.org/research/border/tbe_fullerton.html on 10/8/2003). [ Links ]
García de León P., Guadalupe (2000) "Transformaciones recientes en los mercados laborales," in Darío Arredondo López and Patricia Salido Araiza (editors), La economía sonorense y sus regiones, Editorial UniSon, Hermosillo, Sonora, pp. 29–48. [ Links ]
INEGI (2000) XII Censo General de Población y Vivienda 2000. at http://hades.inegi.gob.mx/sitio_inegi/estadistica/ingles/sociodem/crecimiento/cre_01.html (8/28/2003). [ Links ]
GAO (Unites States General Accounting Office) 2003 International Trade. Mexico's Maquiladora Decline Affects U.S.–Mexico Border Communities and Trade; Recovery Depends in Part on Mexico's Actions. Available at: www.gao.gov/cgi-bin/getrpt?GAO-o3-891. [ Links ]
INEGI (2001) Sistema de Cuentas Nacionales de México at http://www.inegi.gob.mx/est/contenidos/espanol/tematicos/mediano/med.asp?t=ep (11/29/03). [ Links ]
INEGI (2000) XII Censo General de Población y Vivienda 2000, tabulados básicos y síntesis de resultados de los Estados Unidos Mexicanos. México 2001. [ Links ]
INEGI and Gobierno del Estado de Sonora. Anuario estadístico del estado de Sonora, Edición 1992, 1998 and 2001; data for 2001 also at http://www.inegi.gob.mx/est/contenidos/espanol/tematicos/mediano/med.asp?t=cuna26&c. (11/29/03). [ Links ]
Lara, Blanca, Lorenia Velázquez and Álvaro Bracamonte (1999) "Globalización e integración regional transfronteriza. La experiencia de un proyecto binacional en la manufactura de Sonora y Arizona", in Lara, Blanca, Cristina Taddei and Jorge Taddei (editors), Globalización, industria e integración en Sonora. El Colegio de Sonora; Universidad de Sonora; Centro de Investigación en Alimentación y Desarrollo, Hermosillo, Sonora. pp. 107–124. [ Links ]
Lozano, Fernando Ascencio et al. (1997) Sonorenses en Arizona. Proceso de formación de una región binacional. Hermosillo, Sonora, Universidad de Sonora. [ Links ]
MISER (Massachusetts Institute for Social and Economic Research), Origin of Movement (OM) series, at http://nimbus.miser.umass.edu/ftweb/ftbegin (12/7/03 and 9/20/04). [ Links ]
Ohmae, Kenichi (1993) "The Rise of the Region State", Foreign Affairs. Vol.72, No. 2, pp. 78–87. [ Links ]
Pavlakovich–Kochi Vera (1995) "Sensitivity of Arizona's Manufacturing Industries to the Peso Devaluation". Research Paper Series 1995–1. University of Arizona Office of Economic Development. [ Links ]
––––––––––(2003) "Measuring the Non–Measurable: Lessons from the Arizona–Sonora Region", paper presented at the 42nd Annual Meeting of the Western Regional Science Association, in Rio Rico, AZ, February 26–March 1. [ Links ]
Pavlakovich–Kochi, Vera, Francisco Lara Valencia and Pablo Wong–González (1996) Trade Patterns in the Arizona–Sonora Region: Analysis and Recommendations for Development. Strategic Economic Development Vision for the Arizona–Sonora Region. Prepared for the Governors of Arizona and Sonora. The University of Arizona Office of Economic Development. [ Links ]
Pavlakovich–Kochi, Vera and Marisa P. Walker (Eds.) (1996) Proceedings of a Conference Transnational Regional Economic Development–North America. The University of Arizona Community Affairs and Economic Development. [ Links ]
Pavlakovich–Kochi, Vera, Alberta Charney, Alexander Vias and Amy Burns (1997) Fresh Produce Industry in Nogales, Arizona. An Economic and Revenue Impact Analysis. The University of Arizona Office of Economic Development. [ Links ]
Pavlakovich–Kochi, Vera and Lora Mwaniki (2004) Arizona–Sonora Region: 2004 Regional Economic Indicators. University of Arizona Office of Economic Development. Also available at http://oed.arizona.edu/publications. [ Links ]
Peralta Solorio, Ernesto (2000) "El problema del desempleo en Sonora, 1995–2015. Análisis y propuesta de solución", in Darío Arredondo López and Patricia Salido Araiza (editors), La economía sonorense y sus regiones, Editorial UniSon Hermosillo, Sonora, pp.9–28. [ Links ]
Porter, Michael E. (1990) The Competitive Advantage of Nations. New York: The Free Press. [ Links ]
Quintin, Erwan (2004) Mexico vs. China. Twin Plant News. Vol. 19, No. 5, pp. 12–13. [ Links ]
Silvers, Art L. (2004) "Lower Income, Higher Income: Impacts of the Maquiladoras", in Pavlakovich–Kochi, V., B.J. Morehouse and D. Wastl–Walter (Eds.) Challenged Borderlands: Transcending Political and Cultural Boundaries. Aldershot, England: Ashgate Publishing Limited, pp. 153–165. [ Links ]
––––––––––(1998) Economic Development in Arizona: An Analysis of Sectoral Change. Strategic Economic Development Vision for the Arizona–Sonora Region. Prepared for the Governors of Arizona and Sonora. University of Arizona Office of Economic Development. [ Links ]
Storper, Michael (1997) The Regional World: Territorial Development in a Global Economy. New York: The Guilford Press. [ Links ]
Secretaría de Economía (2003) Data from Subsecretaría de Negociaciones Comerciales Internacionales based on banxico data (June 2003). [ Links ]
––––––––––(2004) Inversión Extranjera en el Estado de Sonora, Subsecretaría de Normatividad, Inversión Extranjera y Prácticas Comerciales Internacionales, Dirección General de Inversión Extranjera, Diciembre. (http://www.wconomiasnci.gob.mx). [ Links ]
Tronstad, Russell, S. Aradhyula and P. Wong–González (1997) Arizona–Sonora Agribusiness Cluster: Analysis and Recommendations for Development. Prepared for the Governors of Arizona and Sonora. [ Links ]
U.S. Bureau of Census, Census (2000) 1990 Census, at www.census.gov/prod/cen2000 (8/28/2003) and http://factfinder.census.gov/servlet/QQTable?de_name =DEC_2000_SF1_Uzgeo_id =0400 (10/6/03). [ Links ]
U.S. Bureau of Census. Bureau of Economic Analysis at http://www.economagic.com/em_cgi/data.exe/beagsp/c48 (11/26/03) [ Links ]
U.S. Bureau of Census. Bureau of Economic Analysis: Regional Economic Accounts. Gross State Product Data Table 2000 at http://www.bea.gov/bea/regional/gsp/action.cfm (10/14/03). [ Links ]
U.S. Bureau of Census. DP–3. Labor force status and employment characteristics 1990; for 2000 from http://factfinder.census.gov/serlet/QTTable?_ts=83249946140 (10/15/03). [ Links ]
U.S. Department of Labor Bureau of Labor Statistics (BLS), Characteristics of Minimum Wage Workers: 2002. Footnote 2. Last modified August 27, 2003. Accessed at http://stats.bls.gov/cps/minwage2002tbls.htm (10/21/2004). [ Links ]
Vargas, Lucinda (1996) "The Maquiladora Industry: Still Going Strong" (Part 2). Business Frontier, Issues 4. Federal Reserve Bank of Dallas, El Paso Branch. [ Links ]
Vázquez Ruiz, Miguel Ángel (1998) Economic Development in Sonora: An Analysis of Sectoral Change. Strategic Economic Development Vision for the Arizona–Sonora Region. Prepared for the Governors of Arizona and Sonora. University of Arizona Office of Economic Development. [ Links ]
Wong–González, Pablo (1993) "La nueva industrialización rural en Sonora: de la villa a la fábrica global", in Miguel Ángel Vázquez (Coord.), Sonora hacia el 2000. Tendencias y desafíos, Impresora SINO, Hermosillo, Sonora, pp. 293–331. [ Links ]
––––––––––(1996) "La reestructuración secto–espacial en Sonora: una tipología regional", in Miguel Ángel Vázquez (Coord.), Las regiones ante la globalidad, Gobierno del Estado de Sonora, Hermosillo, Sonora, pp. 87–115. [ Links ]
––––––––––(1997) "Estructura de las exportaciones y competitividad de la economía sonorense" in Alejandro Mungaray and Ma. Guadalupe García de León (Coords.), Desarrollo fronterizo y globalización, ANUIES–Universidad de Sonora, México, D.F., pp. 19–33. [ Links ]
––––––––––(2004) "Reinventar la economía de Sonora o los riesgos de una anomia colectiva", Comercio Exterior Vol. 54, Número 8, Agosto. pp. 733–741. [ Links ]
––––––––––(2004) "Conflict and Accommodation in the Arizona–Sonora Region", in Vera Pavlakovich–Kochi, Barbara J. Morehouse and Doris Wastl–Walter (Editors), Challenged Borderlands. Trascending Political and Cultural Boundaries, Ashgate, Great Britain, pp. 123–151. [ Links ]
Twin Plant News (2003) "History of Minimum Wage Cost per Hour", February. pp. 41–43. [ Links ]
Notes
1 Mexico's sources tend to distinguish the maquiladora sector from the automotive sector, although the latter is very much controlled by foreign car companies such as Gm, Ford, Daimler–Chrysler, Volkswagen, Nissan and Honda. regresar
2 For a list of completed reports check http://oed.arizona.edu regresar
3 For example, the Puerto Nuevo initiative in Tucson, Arizona, builds upon the notion of "borderless" economy and new business opportunities the NAFTA area. Although its ambition goes beyond the state of Sonora, it reflects the new way of thinking about economic regions. For more information contact http://www.puertonuevotucson.com regresar
4 Pavlakovich, V.K. and Jerry Conover (1999). Indicators of Progress. The Arizona–Sonora Project. The University of Arizona: Office of Economic Development. Prepared for the Arizona–Mexico Commission. May 1999. The indicators are updated annually; the latest version is available at http://oed.arizona.edu regresar
5 A 10–12 ft tall metal fence erected trough the Ambos Nogales and stretching east and west for miles is a recent product of the U.S. government response to increased illegal immigration and drug trafficking. As the border control tightened along its Texas and California borders, the pressure on the Arizona–Sonora sector has increased. After September 11, 2001, it became more difficult for the Mexican residents to cross the border. regresar
6 Conversion from pesos to U.S.$ by University of Arizona Office of Economic Development (UAOED). Source: Indicators, at http://oed.arizona.edu Although at the time of this writing Mexico already published 2002 GSP data, data for U.S. were unavailable due to conversion from SIC to Naics industry classification system. regresar
7 Based on converted current pesos to dollars, by the author. regresar
8At the time of the completion of this article, the Ford Motor Co. announced another $1.2 billion investment in the expansion of its current facility plus 0.4 billion in auto parts suppliers in Hermosillo, Sonora. regresar
9 The most important ones were Cementos del Yaqui del Grupo Cemex de Monterrey, and Cervecería Cuauthémoc in Navojoa. In addition, the modernization of the mining industry occurred in Cananea and Nacozari (Vázquez Ruiz 1998). regresar
10 Out of 228 foreign companies, 170 were U.S., and 30 Canadian (Vázquez Ruiz 1998, based on SECOFI , Foreign Investment in 1994). regresar
11 Data for 1994, based on SECOFI and BANCOMEX via COLEF in Pavlakovich, Lara and Wong–González, 1996. regresar
12 Data for 1994, based on SECOFI and BANCOMEX via COLEF in Pavlakovich, Lara and Wong–González, 1996. regresar
13 A more recent data show a significant shift in Arizona's exports from those to Mexico (and Canada) to Asia, primarily Malaysia and China. Between 2001 and 2003, the total Arizona's exports to Malaysia grew 77.9 percent. In 2001, Arizona's exports to Malaysia represented 25.5 percent of Arizona's exports to Mexico and in 2003 represented a half of Arizona's exports to Mexico. Exports to China grew even faster. Between 2001 and 2003, the total exports from Arizona to China increased 422 percent. At the same time, Arizona's exports to Mexico declined 9.8 percent, and to Canada 15.3 percent. True, the volume of Arizona's exports to China is still relatively small compared to exports to Mexico, accounting for about 23 percent compared to 9 percent in 2001. In particular, there has been a shift in Arizona's exports of computer and electronic products to China markets. Arizona's exports of computer and electronic products to China grew from $66 million in 2001 to $552 million in 2003, representing the main Arizona's export commodity to China (Source: MISER data base accessed September 2004). At this moment data are not available that would make conclusions whether this reflects shifting of Arizona's manufacturing operations from the region to China and other Asian countries or primarily a response to opportunities for exporting components and finished products. Given the fact that manufacturing employment in Arizona decreased as well, it is likely that both tendencies are present. regresar
14 Wages and salaries are reported for employed persons excluding self–employed. Source: U.S. Bureau of Census, County Business Patterns, 1994 and 2001, accessed at http://censtats.gov/cgibin/cbp1sect.pl on December 10, 2003. regresar
15 State–level data are reported only in terms of the number (and per cent) of population earning one, two, three, or more than three minimum wages. regresar
16 Based on a 48–work week in zone "A" including Sonora's border communities, according Twin Plant News, February 2003. regresar
17 Females 12 years and older. INEGI 2001. regresar
18 Females 16 years and older. U.S. Bureau of Census, 2003. regresar
19 In Sonora this is referred to as "media superior y superior," which may include less than B.A. In that case, more appropriate would be to compare with Arizona's category "some college–no degree, associate degree, B.A., etc.", in which case the percent of az's 25 years and older with those degrees is 56.7 percent). regresar
20 Includes high school, college and higher degrees. Applies to population 15 years and older. regresar
21 The CANAMEX Trade Corridor encompasses Arizona and Sonora at the center of a north–south trade routs connecting Canadian provinces of British Columbia and Alberta through western U.S. states with the Pacific coast region in Mexico and Mexico City. For more information see http://www.canamex.org/CCC.htm regresar
22 Laredo, Texas, facilitates the largest volume of exports to Mexico. In 2003, $48.5 billion worth of commodities passed through it to Mexico, accounting for 55% of all commodity value exported through BPOE (including Houston–Galveston, Los Angeles and Dallas–Forth Worth). El Paso is distant 2nd (with $17.2 billion or close to 20%), while San Diego is 3rd (with $12.5 billion or 14%). Nogales is a distant 4th (with $4.1 billion or 4.7%; in the same group with Houston–Galveston, tx). (Source: MISER database, accessed September 2004). "Nogales" is used here to mean "Nogales District", i.e., encompassing all 6 AZ–Son border ports of entry. regresar
23 Basically, the maquiladora–type provisions of duty–free imports of components and machinery were extended to other export–oriented establishments. Access to Mexican markets was also enlarged. regresar

