


 text new page (beta)
 English (pdf)
 Article in xml format
 Article references
 Send this article by e-mail
 Cited by SciELO
  Similars in
SciELO
Similars in
SciELO 
 Permalink
Introduction
The global financial contagion derived by recent crises and its consequences around the world is a fundamental topic for academics, fund managers and traders due to its impact on international portfolio management, portfolio allocation and asset pricing. Since more than two decades ago, international financial crises have been presented on a constant basis: in 1997 the Asian crisis, 1998 in Russia, 2000-2001 the dot com crisis, and since 2007 the unfinished global financial crisis. All these events have presented similarities because of their deep effects and their fast transmission to some geographically distant markets that apparently have not maintained a significant relation.
In recent times foreign portfolio investors have increased their interest on emerging financial markets of the BRIC1+M because of their potential and high yields. The interest in these markets responds to the opportunity to diversify risks and obtaining higher levels of profits. BRIC+M economies have become important partaking economies in the world globalization process. Moreover, multiple analyses foresee a stronger leadership of these nations’ in future economic and political international affairs.
It is expected that BRIC economies will not only become the most important global economies, but above all their economic and financial exchanges will lead to a convergence of their interest becoming a strong block, particularly with expected future participation of other countries (among them México); the block would become a main support of the world economy; particularly, it could become a key factor that will finally induce a take-off into development of the less developed countries (Morazan, 2012); politically such block could become important to counterbalance the emerging bilateralism the U.S.-Europe.
In spite of some differences, this block shares some common traits: large size of their economies, territory and populations; high and persistent rates of growth during the last decade and generally expected to continue in the future, albeit in a lesser degree. Additionally, these countries have begun to create some specific collaborative actions.
Thus, the importance of this group will continue to grow to the extent that some other countries could also join the block. Indeed, South Africa is a new comer to the original BRIC group. Among countries recurrently mentioned to join up the group, Mexico is one of the favorites because it shares some common features and interests with the rest of the members of the group. It is therefore important to assess the financial proximity, or else the distance that this country maintains with the nascent BRIC block. If this is the case, we would be witnessing the birth of a BRIC(S) +M block.
Research dealing with BRIC has been rapidly increasing. Most studies have emphasized either their interdependence (Verma & Rani, 2015; Singh & Kaur, 2014; Mostafa & Stavroyiannis, 2016) or else their increased dependence with other markets (Bergmann, Securato, Savoia & Contani, 2015; Chittedi, 2014; Bianconi, Yoshino & De Sousa, 2013).
All these studies are very important because they examine the financial crisis contagion and the integration patterns among the BRIC markets and between the BRIC block and other developed and developing markets. Stock markets disequilibria have significant effects for fund managers and traders by determining their investment decisions. In the case of listed companies, crisis transmission inhibits their financing access and increases the cost of funding, diminishing the economic performance of each country. For policy makers collaborative policies can promote financial institutions development and their contribution to economic growth.
This study makes a contribution on both areas. On one hand, it analyzes the interdependence among the stock markets of the BRIC countries. On the other hand, it examines the linkage among each equity market of the BRIC block and the Mexican stock market. Dependence is estimated using the daily returns of the IBOVESPA (Brazil), RTS (Russia), BSE SENSEX (India), HANG SENG (China) and IPC (Mexico) from July 1997 to December 2015. Patterns of dependence are estimated employing copula methodology. Copulas of the elliptical and Archimedean families are employed. Dynamic dependence is performed through the rolling window periods of 251, which corresponds to a trading year. For each dependence pattern a copula parameter is estimated.
The paper is organized as follows. In Section 2 literature review is presented. In Section 3 the data and methodology are described. Section 4 provides the dynamic correlation results. Finally, Section 5 summarizes and concludes.
Literature Review
In the empirical and theoretical literature a consensus definition about contagion has not been reached. However, authors like Claessens (2000) defined contagion as a significant increase in the links between international markets after a shock in a country or group of countries. According to this definition, Forbes and Rigobon (2002) argue that if there is a high degree of co-movement in periods of stability, this may not constitute contagion; this phenomenon is called “interdependence”. Hence, there is only contagion if cross-market co-movement increases significantly after the shock.
A large proportion of research on contagion effects deal with empirical studies focusing on explaining stock markets linkages and its changes between stability and crisis periods. Earlier literature was focused just on developed markets linkages, but due to the global financial integration and the growth of emerging markets, research has been extended to examine dependence (association) between developed and developing countries, as well as concerning such relationship among emerging markets.
Among studies analyzing dependence for the case of developed and emerging countries stands out research developed by Nguyen & Bhatti (2015) who examine the contagion effect between the U. S. stock market and stock markets in Vietnam and China; similarly, Romero-Meza, Bonilla, Benedetti & Serletis (2015) analyze the contagion effect among Latin American stock markets; Dewandaru, Masih & Masih (2015) analyze pure contagion among Asian equity markets (China, India, Taiwan and South Korea) and; Luchtenberg & Vu (2015) who examine the world wide contagion using a sample of emerging and developed countries.
About the research focuses on linkages among developing countries there are the following studies: Neaime (2016) examines contagion vulnerability and the international and regional financial linkages of the MENA stock markets; Alexakis, Kenourgios & Dimitriou (2016) analyze the stock market contagion in Baltic countries; Shen, Li, Wang & Su (2015) study the contagion effect of the European debt crisis on China’s stock market.
On the other hand, literature about contagion effect on BRIC stock markets, Ahmad, Sehgal & Bhanumurthy (2013) study the contagion effect on BRIIC group (BRIC countries plus Indonesia, South Korea and South Africa); Bekiros (2014) analyzes contagion between the U. S. and BRIC stock markets; Chittedi (2014) examines the contagion between developed markets (the U. S., the U. K. and Japan) and BRIC stock markets; finally, Bergmann, Securato, Savoia & Contani (2015) analyze the linkages among the BRIC and European stock markets with the US equity market.
As previously mentioned, in the context of financial integration and strong interdependence among international markets, numerous studies have focused on this issue. In this regard, new and sophisticated techniques have been developed in order to fit better the estimation of dependence, since stock market returns exhibit common extreme variations, non-linear behavior, asymmetry and time-varying dependence, characteristics that traditional or classical modeling techniques often do not capture.
Copula approach is one of the world’s leading methods for analyzing integration, contagion and interdependence patterns. A wide range of variations have been developed based on this technique. In this respect, Chen, Wei, Lang, Lin & Liu (2014) propose a new approach based on the multifractal volatility method to study the contagion effect between the U. S. and Chinese stock markets. Changqing, Chi, Cong, & Yan (2015) construct a dynamic Markov Regime Switching Copula (MRSC) models to measure the financial risk contagion between the Chinese market and other international stock markets. Jayech (2016) combines the copula theory and the directed acyclic graph to study the structure of causal dependence between the German and other stock markets.
Dynamic copula approach has been an appropriate technique to prove contagion effect because it allows examining the time-varying dependence in a graphic analysis, enabling to observe how the link between two markets changes and increases during crisis periods. In this regard, this work aims analyzing the dynamic interdependence among the BRIC+M block. A dynamic copula approach is proposed, using rolling window estimation. The daily changes on dependence reveal if there is interdependence, contagion or a high level of segmentation among BRIC+M markets.
Data and Methodology
As already mentioned, to test contagion effect among the BRIC+M stock markets, data includes daily prices of the BRIC+M stock indexes in US dollars, that is, IBOVESPA (Brazil), RTS (Russia), BSE SENSEX (India), HANG SENG (China) and IPC (Mexico) from July 1997 to December 2015. Stock market series were obtained from yahoo finance and exchange rate series from Oanda web site.
Following closely a previous paper by Sosa, Bucio and Cabello (2015), Copula approach is applied on rolling window estimation. Although there exist any good number of families, the family of elliptic and Archimedean were chosen due to their benefits. Elliptical copulas are applied because they provide a better fit, specifying different levels of correlation between the marginals. Meanwhile, Archimedean copulas allow modeling dependence in arbitrarily high dimensions with only one parameter, governing the strength of dependence (Grover, 2015).
Elliptical copulas
Elliptical copulas, derived from multivariate elliptical distributions (Jonhson, 1972), are the most commonly applied in financial research. They are peculiar because they can be associated to random variables, whose multivariate distribution function is symmetric; this means that the level curves created through this type of copulas are elliptical. The most important copula from this family are the normal Copula (Gaussian) and the t-Student copula, which derive multivariate distribution functions denominated with the same names.
Gaussian copula
Gaussian copula is constructed from the multivariate Gaussian copula; it provides a generalization of Gaussians multivariate distributions.
The n-Gaussian copula with ρ correlation matrix is:
Whose density is:
with
Φ expresses the normal distribution (accumulated) and Φñ,n expresses the Gaussian standard distribution n-dimensional with ρ correlation matrix. The Gaussian copula is fully determined by the knowledge of the matrix of the correlation coefficient ρ.
T-Student copula
This is derived from the t-Student multivariate distribution. It gives a natural generalization of the multivariate t-Student distributions.
Form a given t-Student distribution n-dimensional Tn,p,υ with υ degrees of freedom and a ρ correlation matrix
The t-Student copula is:
Where Tυ is the t-Student univariate distribution with υ degrees of freedom.
The density of the t-Student copula is:
To describe the t-Student copula two parameters have to be taken into account, the ρ correlation matrix, in the same way as the Gaussian case, and the number of υ í degrees of freedom.
Archimedean copulas
The bivariate distribution from the Archimedean copulas family is represented as:
where
Clayton copula
The bivariate copula from the Clayton family is:
With generative
Gumbel copula
The bivariated copula from Gumbel’s family is:
With generative
Frank copula
With generator
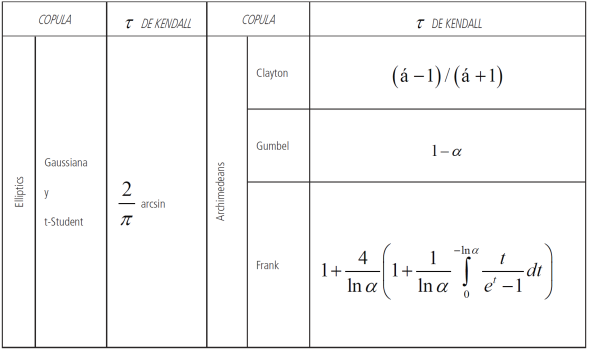
Dependence measurements via copulas
Each of the multiple families of copulas is characterized by a parameter or a parameter vector. These parameters measure the dependence of marginals, and they are called dependence parameters θ. Here is important to note that the relation between this dependence parameter and Kendal’s Tau concordance measure is as follows.
Let X1 and X2 two random variables with marginal continuous distribution F1 and F2 and coordinated distribution function F. The typical concepts of dependence, Pearson correlation and τ Kendall can be expressed in terms of copula for F.
Pearson correlation is given by:
Kendall correlation is given by:
It is observed that the τ Kendall is functioning with the copulas X1 and X2, while the coefficient of Pearson’s lineal correlation only depends on the marginal.
In the case of the analyzed copulas in this work, that is, the elliptical and Archimedean copulas, there is a relation between rank correlations and lineal correlations. This work is focused especially on the relation with the τ Kendall.
To sum up, if (X1, X2) have an elliptical or Archimedean bivariate copula and random continuous marginal, the τ Kendall is:
Copula parameters estimation
There are several methodologies for estimating the parameters associated with copula. This work employs maximum likelihood. This mechanism can be applied to estimate any copula family because the estimation of copula parameters can be obtained by maximizing its log-likelihood function, as explained below:
Let C be a copula, such that,
with density function,
Therefore, the maximum likelihood estimation mechanism can be defined as:
Let X a r.v.i.i.d. vector with multivariate distribution function F and continuous marginal distribution function F1,...,Fn; the log-likelihood function is defined as:
where θ are the parameters set both marginal and copula. Thus, given the marginal set and a copula, the log-likelihood function can be maximized obtaining the maximum likelihood estimator,
Empirical Evidence
To develop a consistent sample, given the dissimilar calendar of these markets, the data series were homogenized considering only coinciding trading days. Also given the importance of international portfolio investment, all indices2 are expressed in a single currency, the US dollar.
Returns are estimated as follows:
Source: Own elaboration based on Yahoo Finance and Oanda data.
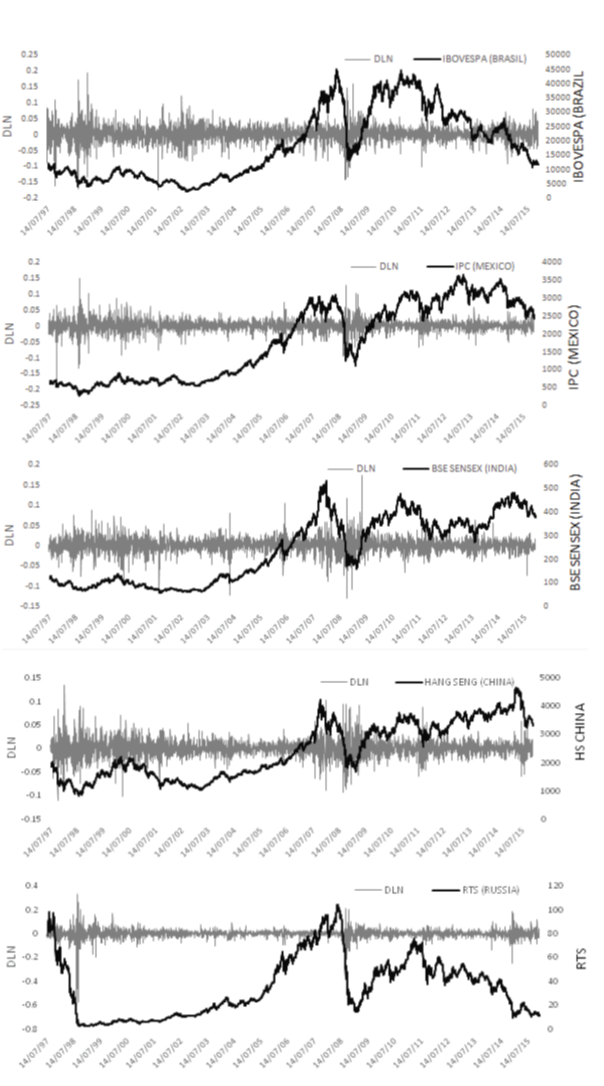
Figure 1 Shows the behavior of prices and returns of the markets under study. Stock Indexes prices and returns from Brazil, Russia, India, China and Mexico.
It is clearly observed that returns3 are characterized by higher changes (increasing volatility) and volatility clusters, during the crises periods (1997-1998, 2001 and 2007-2012) compared to other stability periods. Besides, the series show signals about the presence heteroscedasticity and an about an unforeseeable behavior, particularly no Gaussian.
Series in levels show that stock indexes continued to trend upward until the second quarter of the year 2008, reaching a particularly low level during the first quarter of 2009, when the trend was reversed. It is important to note that the Russian and Brazilian markets exhibited a negative performance since the last quarter of 2011 and over the rest of the sample period.
Descriptive statistics of the BRIC+M countries equity markets are presented in Table 1. Standard deviation, mean, kurtosis, skewness and Jarque Bera measures are included. It can be observed that the Russian market has the highest volatility, measured by the standard deviation, compared with those in the rest of the sample. The average return of the major part of the sample is very low and positive, except for the Russian and Brazilian markets.
Table 1 Descriptive statistics.
| Mean | Std. Dev. | Skewness | Kurtosis | Jarque-Bera | Probability | |
| BSE | 0.000295 | 0.018117 | -0.115297 | 9.272147 | 6636.079 | (0.00)* |
| HANG SENG | 0.000148 | 0.017513 | 0.087517 | 8.314804 | 4763.627 | 0 |
| IBOVESPA | -2.37E-06 | 0.025575 | -0.238078 | 8.837966 | 5779.566 | 0 |
| IPC | 0.000355 | 0.018249 | -0.292115 | 11.70325 | 12817.65 | 0 |
| RTS | -0.000494 | 0.035362 | -2.799855 | 55.49752 | 469551.7 | 0 |
*Values within parentheses indicate probabilities.
The distribution of returns is negatively skewed, except for the Chinese market that is positively skewed, indicating in all cases the presence of asymmetry. The values concerning kurtosis suggest that the distribution is leptokurtic, with a high concentration on the central values (higher peak) and the presence of heavy tails. Finally, the probabilities of Jarque-Bera testing reported in Table 1, allows rejection of the hypothesis of normal distribution at the 1% level. Thus, analysis performed under the assumption of normality lack appropriate support, leading to spurious results. Considering the nonlinearity of returns a mechanism that optimizes dissimilar situations of linearity and non-linearity becomes necessary. Copula methodology helps abating such mishaps generating unbiased estimates. Pertinent to this study are, elliptical and Archimedean copulas.
Copula results
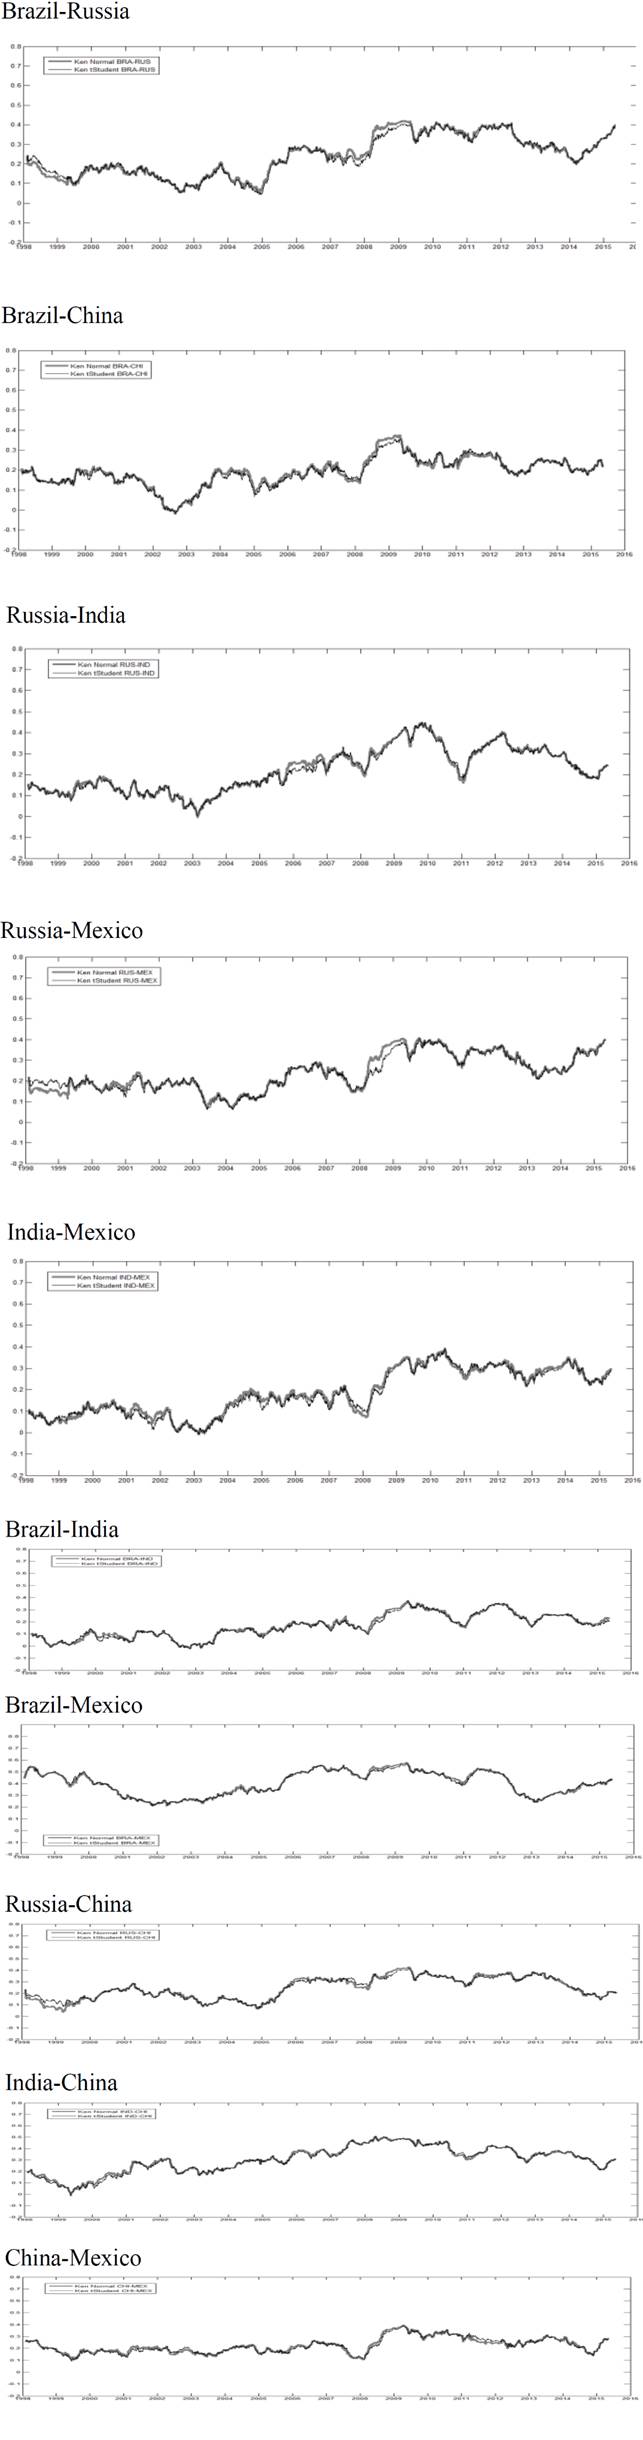
To confirm the importance and magnitude of the relationship among the BRIC+M share markets, Figures 2 and 3 show the results obtained using elliptical and Archimedean copula, respectively. It is important to point out that dynamic copula estimates are obtained applying rolling windows of 251 days, which corresponds to a full one-year stock market cycle. Copula approach is preferred over linear methods because its goodness of fit. Besides, related studies have proved that linear correlation overestimates relationships among markets (Sosa, Bucio & Cabello, 2015; Ortiz, Bucio & Cabello, 2016).
Source: Own elaboration based on the results obtained
Figure 2 Rolling Window 251- days Elliptical Copula (Kendall tau)
Source: Own elaboration based on the results obtained
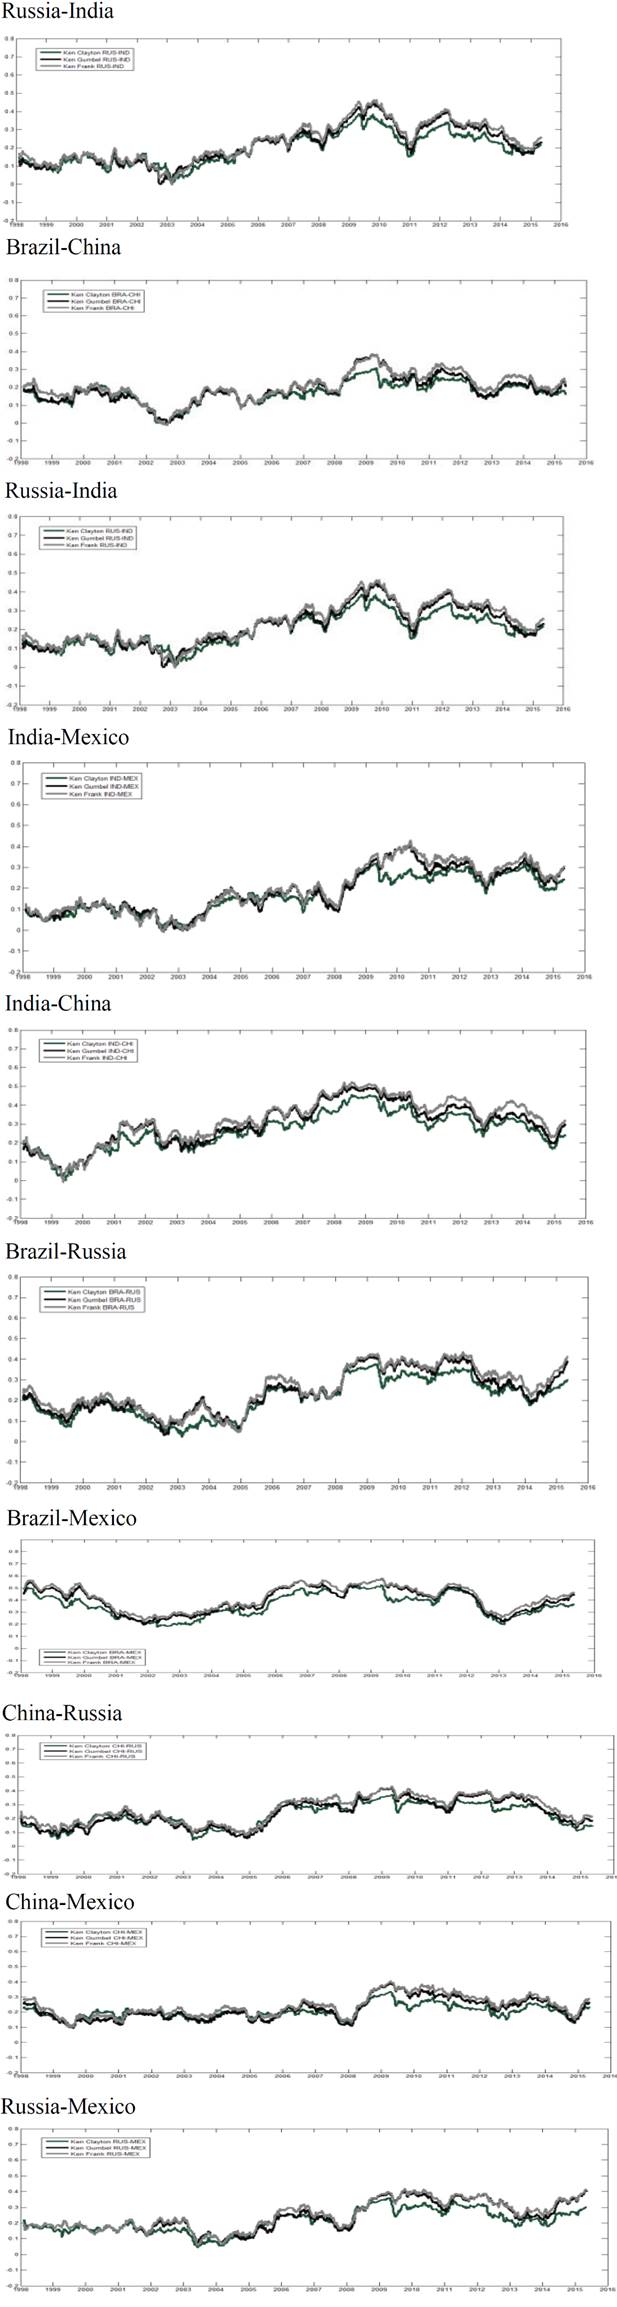
Figure 3 Rolling Window 251-days Archimedean Copula (Kendall tau)
Figures 2 and 3 illustrate dynamic copula estimates employing the two proposed alternatives. It can be observed that dynamic copula dependence fluctuates at levels below 0.2 during the decade of the 1990’s. Furthermore, since 2007 Kendall’s remains stable around 0.3; this suggests that there is not an interdependence phenomenon among capital markets of BRIC+M, since there are low dependence levels among them during the sample period; thus, they remain mildly segmented.
It is important to point out that, although the dependence levels among BRIC+M markets are low, it can be observed important relative changes during crisis periods in relation with stability periods. In Table 2 empirical contagion analysis is presented, in detail. The Global Financial Crisis (GFC) effects stand out because dependence increased in 70% during the GFC period in relation to the four previous years. After the GFC period dependence measures diminishes slowly. This suggests that contagion among BRIC+M markets occurred during the GFC, but not in previous crisis episodes.
Table 2 Average dependence during stability and crisis periods among BRIC+M stock markets.
| Assian Russian Crisis (1997-1998) | Stability period (1999-march 2000) | Dot com crisis** (2000-2001) | Stability period (2002-2006) | GFC* (2007-2012) | Stability period (2013-2015) | |
| Kendall copula normal | 0.172984 | 0.153925 | 0.177361 | 0.186731 | 0.326342 | 0.272404 |
| Kendall copula t student | 0.180765 | 0.157196 | 0.170639 | 0.182209 | 0.322674 | 0.271413 |
| Kendall copula Clayton | 0.162328 | 0.138229 | 0.165455 | 0.166061 | 0.285469 | 0.230646 |
| Kendall copula Gumbel | 0.171507 | 0.156307 | 0.170688 | 0.180581 | 0.325211 | 0.259627 |
| Kendall copula Frank | 0.192588 | 0.167951 | 0.18175 | 0.193515 | 0.343496 | 0.287442 |
Source: Own elaboration based on the results obtained
*gfc Global Financial crisis (immediate effects). ** From March 11, 2000 to December 31 2001.
Once proved the contagion effect, Table 3 analyses the average dependence among BRIC+M markets. The strongest dependence between the markets under study involved the markets of Brazil and Mexico, follows by the relation between India and China. It could be explained through geographical closeness and important economic and trade relationships between them.
Table 3 Average dependence among BRIC+M stock markets.
| Kendall copula normal | Kendall copula t student | Kendall copula Clayton | Kendall copula gumbel | Kendall copula Frank | |
| BRA_RUS | 0.24002 | 0.23702 | 0.21061 | 0.23725 | 0.25505 |
| BRA_IND | 0.16714 | 0.16223 | 0.14325 | 0.16742 | 0.17138 |
| BRA_CHI | 0.19098 | 0.18774 | 0.16927 | 0.18388 | 0.20092 |
| BRA_MEX | 0.40385 | 0.40269 | 0.35702 | 0.39946 | 0.4223 |
| RUS_IND | 0.22147 | 0.21862 | 0.19313 | 0.21432 | 0.23043 |
| RUS_CHI | 0.24496 | 0.24629 | 0.22154 | 0.23543 | 0.26204 |
| RUS_MEX | 0.24007 | 0.23682 | 0.20872 | 0.23755 | 0.24886 |
| IND_CHI | 0.30252 | 0.29938 | 0.2622 | 0.29636 | 0.31814 |
| IND_MEX | 0.18674 | 0.18049 | 0.16616 | 0.18698 | 0.19593 |
| CHI_MEX | 0.22388 | 0.22201 | 0.20317 | 0.21724 | 0.23931 |
Source: Own elaboration based on the results obtained.
Summarizing, interdependence among BRIC+M markets is undergoing an early stage of development; thus, they are mildly segmented. However, these markets have been increasing their global financial risk exposure, presenting important contagion effects during the global financial crisis.
Conclusion
Using daily closing prices of IBOVESPA (Brazil), RTS (Russia), BSE SENSEX (India), HANG SENG (China) and IPC (Mexico) stock market indexes, this paper investigated whether there was contagion, interdependence or segmentation among BRIC+M equity markets from July 1997 to December 2015. Marginal distributions were modeled using the family of elliptic and Archimedean copula on a rolling window estimation technique. Dependence was verified through dynamic analysis by Kendall’s correlation coefficient.
Applying this methodology to BRIC+M equity markets it can be concluded that they remain mild segmented; their association levels are below 0.2 during the decade of the 1990’s and around 0.3 during global financial crisis period. Thus, there is not an interdependence phenomenon among capital markets of BRIC+M, since there are low dependence levels among them during the sample period. Despite of the low levels of association, findings contribute evidence about contagion effect during the GFC, because dependence increased in 70% during GFC period in relation with the previous years.
The evidence suggests that, concerning international investments, constructing diversified portfolios with assets of these countries is still a feasible alternative to increase returns and minimize risk during stability periods, but not during periods of crisis. In the case of corporate decisions the results imply limited financing opportunities and much volatility for their shares listed in these countries. Finally, for policy makers from the BRIC+M countries findings of this study suggest that stronger financial integration policies among them must be pursued to enhance the development of the stock markets and their contribution to development of the group and each of its members.

