


 nueva página del texto (beta)
 Inglés (pdf)
 Artículo en XML
 Referencias del artículo
 Enviar artículo por email
 Citado por SciELO
  Similares en
SciELO
Similares en
SciELO 
 Permalink
JEL classification: O30, O31.
Clasificación JEL: O30, O31.
Introduction: Importance of highly productive individuals in the process of technological change
The aim of this paper is to provide new insights into the determinants of the value of invention. Our basic assumption is that individuals must be considered in this creative process because innovation is not simply a product of firms and organizations, it requires individual creativity. Furthermore, we focus our analysis on prolific inventors because they contribute so hugely to national invention totals (Le Bas et al., 2010) and tend to produce inventions that have more economic value (Gambardella et al., 2005; Gay et al., 2008). Recent studies have shown how individuals within the firm help it to cope with technological change. The role that individuals play in firm imitation, adaptation and innovation can be understood by drawing on results and analyses provided by the sociology of science. That literature has generated conflicting viewpoints regarding the importance of "key" very productive individuals in the development of scientific knowledge (noted in particular by Hess and Rothaermel, 2007; see also Latham and Le Bas, 2011).
In innovation theory, prior research has demonstrated that certain individuals are very important to a firm's innovation activity (Lacetera, Cockburn, and Henderson, 2004; Rothaermel and Hess, 2007; Zucker, Darby, and Torero, 2002). A similar idea is frequently found in strategic management studies: particular individuals are often crucial resources contributing to a firm's competitive advantage (Tushman and Katz, 1980; Coff, 1997). The role of key individuals or star employees has been documented by academics (Ernst et al., 2000 1; Tushman, 1977; Zucker, Darby, and Torero, 2002) and goes back to the famous Lotka-Price Law of Scientific Knowledge Distribution. In general, the productivity and value of important individuals is related to the degree to which the individuals are connected to both internal and external sources of knowledge (Allen, 1977; Tushman and Katz, 1980; Zucker and Darby, 1997). Hess and Rothaermel (2007) have tried to develop a framework emphasizing that the firm's dynamic capabilities, as elaborated by Teece et al. (1997), are dependent on the individuals within the firm and on their roles in technological innovation.
As far as prolific inventors are concerned, we propose that they act as "knowledge integrators" (Gay et al., 2008). As knowledge workers, they play a prominent role in the design, development and integration of pieces of knowledge within a department of research in their invention team or network. Prolific inventors and their engineering knowledge are essential. They increase the rate at which individuals and organizations learn and consequently achieve sustainable competitive advantages. Prolific inventors are innovation "champions". Through their professional mobility they can be viewed as "knowledge translators" or "knowledge brokers" (Brown and Duguit, 1998) between firms, organizations and communities. They help transfer pieces of knowledge through the different communities with which they interact at one or at several different points of time. Thus, it seems to us that prolific inventors are basically "science gatekeepers". Gatekeepers are individuals with specific characteristics.
Tushman and Katz (1980) provide a well-known description of gatekeepers as "boundary spanning individuals who can be an important linking mechanism between organizations and their external environments."2 They explain the role of gatekeepers in the transfer of information to a single R&D division by comparing the performance of project teams with and without gatekeepers. Gatekeepers perform a linking role only for projects performing tasks that are locally oriented (meaning development-oriented tasks). Allen et al. (1979) analyze how research and development projects effectively acquire new technology. Projects show higher levels of performance when all project team members maintain high levels of communication with colleagues outside their organization. Innovation projects show higher performance when external communications are monopolized by one or a few project members: in short, the gatekeepers. They say:
The gatekeeper seems to be an offspring of technological needs and organizational conditions. Because technological problems are defined in local terms, reflecting the firm's interests and strategy as well as its value system, most technologists have difficulty in communicating effectively with outsiders about those problems. Fortunately, however, often there appear to be a few individuals who maintain consistent ongoing contact outside their organizations, who understand the way in which outsiders differ in perspective from their own organizational colleagues, and who are able to translate between the two systems (Allen et al., 1979: 703).
These researches note that the gatekeeper's "role is of greater importance when the technology is ... sophisticated" (Allen et al., 1979). Parichuri (2009) has shown that the relative importance of these inventors varies with the firm's location within inter-firm networks. In previous papers we have presented arguments justifying the choice of prolific inventors (Le Bas et al., 2010).
In this paper we test if some inventors' characteristics (their inventive productivity, their mobility) impact the value of their inventions. As in previous papers (e.g., Le Bas et al., 2010) we identify prolific inventors as those who have been issued at least 15 patents by the United States Patent and Trademark Office (UPTSO) between 1975 and 2002.
Previous studies of prolific (or "key") inventors have focused more on the firms in which they work or on the industries in which the firms operate. Narin and Breitzman's (1995) seminal work on the topic is based on an analysis of only four firms3 in a single sector and a recent paper by Pilkington et al. (2009) uses data for only two industries.
We have adopted a different perspective in our analysis. We use a very large data set which permits comparisons across thousands of inventors in thousands of firms in the five largest countries in terms of technological activities (France, United Kingdom, Germany, United States of America and Japan) to estimate the determinants of inventive productivity at the individual level, including the effect of inventor mobility on inventor productivity.
The paper is organized as follows: Section I delineates our theoretical framework and suggests hypotheses to be tested, Section II presents the definitions of variables and some related measurement issues, Section III describes the empirical model, estimation issues are discussed in Section IV and the discussions of our results is in Section V. Finally, wes set out conclusions and suggestions for further research.
I. An evolutionary framework: the laws of inventor productivity and value of invention
The point of view developed here finds its roots in the analysis of the growth of knowledge by recombination, systematically described first by Weitzman (1996); Fleming (2001) and Antonelli (2008). In his approach, the production of new knowledge is a process that cannot be modeled in general by analogy with the "discovery of new oil fields". Instead, new knowledge is often produced by a recombination of scattered existing bits of knowledge. Weitzman (1996) supports his view with the following examples:
The idea of an "electric light" is itself a hybrid, the first practical example of which was made in 1879, between the idea of "artificial illumination" and the idea of "electricity." The idea of an "electricity production and distribution network" was conceived by Edison in the 1880's as an explicit combination of the idea of "electricity" with the idea of a "gas distribution system," where electricity is essentially substituted for gas (Weitzman, 1996: 209).
His basic idea is that the expression of human imagination is "recombinatoric in essence." We find this same important concept in Fleming and Szigety (2006), for whom the same mechanisms of creativity apply both in science and in technology. They start their analysis with a psychological model first elaborated by Simonton (1999). Inventors generate new ideas through combinatorial thought trials subject to psychological and social selection processes (Fleming, 2007). They note that individuals who simultaneously juxtapose, combine, and evaluate a stream of uncombined inputs will be more creative. Generative creativity is the assembly or rearrangement of existing components into new combinations. The more the inventor tries recombinant actions, the more he/she increases the likelihood of a productive hit. As a consequence we hypothesize a correlation between an inventor's total output and the likelihood that he/she finds inventions with high impact. "A one-hit wonder is very unlikely [...] The most prolific inventor is the one most likely to invent a breakthrough" (Fleming and Szigety, 2006: 340).4
The important output of such an analysis with respect to model of Weitzman (1996) is that it predicts a relation between inventor productivity and the economic value of the new bits of knowledge produced. The new bits of knowledge may be embodied in inventions. Thus, one can examine the behavior of inventors and the value of their inventions to find evidence of the Weitzman model's validity. This reasoning leads us to our first testable hypothesis:
H1. The more productive an inventor is, the more valuable his inventions will be on average.
Recent strands of the literature dealing with invention value have proposed the strategic importance of inventor mobility as linked to invention value. The scale, determinants and effects of inventor mobility have been analyzed recently by Hoisl (2007, 2009), Schankerman et al. (2006), and Trajtenberg, Shiff, and Melamed (2006), among others. Hoisl (2007) using European patents (a survey of 3 049 German inventors), finds that an increase in inventor productivity (number of patents per inventor) decreases the number of moves from firm to firm. She tests the causality of the productivity of inventors on inventor mobility and finds that more productive inventors are not more mobile from firm to firm. For Hoisl, a move increases productivity (number of patents) but an increase in productivity decreases the probability of observing a move. Hoisl has investigated the differences in gains from a move between high and lower performing inventors. This point is particularly crucial for us because we want to assess the role of prolific inventors' mobility on their performance. Hoisl (2009) finds that
inventors at the upper end of the performance distribution (our prolific inventors) are better able to benefit from a move to draw level with or to overtake non-movers in the post-move period. Whereas at the bottom of the performance distribution a higher level of education has a positive impact on inventive performance, education does not matter significantly at the upper end of the performance distribution.
Schankerman et al. (2006) have studied the mobility of inventors using patents in the software industry in the US. Their findings are in accord with Hoisl's: they show that the very productive inventors have a decreasing probability of moving between assignees as their careers progress (Schankerman et al., 2006: 26). As far as value of inventions is concerned, Trajtenberg, Shiff, and Melamed (2006) showed that inter-firm mobility is related to inventors' patents that are more technologically focused (more concentrated in technological categories) and those having more value (i.e. more cited). He pointed out that the Israeli inventors who tend to move more frequently both across countries and between assignees have the most highly-cited patents. But he concludes that there exists an endogeneity problem: we cannot determine whether it is the (high) value of invention that provokes the move or if it is the learning effect due to the move that tends to increase the invention's value. Schankerman et al. (2006) discuss the issue of inventor mobility in the framework of an inventor-employer matching process in the software industry. Asymmetric information between employer and employee about the value of an invention should be a relevant incentive for a move. They finally argue:
We did not find support in the data that mobility is a matching process between the inventor and his employer, and that the quality of the inventor's patents increases after a move. If any, there seem to be some short term costs of mobility, which seem lower when moving to a larger firm.
We extend these studies by considering prolific inventors, the source, as we will show, of most innovation in the five countries, using several indicators of mobility as well as indicators of productivity and the value of inventions. In this paper we focus only on inter-firm mobility and technological mobility.5
Our model of knowledge creation through recombination takes into account the empirical evidence reviewed as follows: We suppose some bits of primary knowledge exist in the first time period. Through the process of recombination, some new bits of knowledge are created in the next time period. Note that the bits of previous knowledge that enter into the process of recombination continue to exist as useful knowledge. Significantly, the process of recombination does not stop in the second time period. It goes on. In this way, in the next time periods we will have additional new bits produced. The recombination process becomes more complex: it combines bits of recomposed knowledge with bits of "raw" knowledge. We think that the new elements of knowledge have more value than the primary bits of knowledge.
The knowledge that is used in recombination is both explicit and tacit. Codified explicit knowledge circulates, in general, through publications. The part that is tacit in nature is important in the process of recombination. Its structure depends on local factors such as firm organization, core technological competences of a region, etc.) and its diffusion is generally through the mobility of experts including inventors.
Inventors work in firms that are part of industries that are located in particular regions. We hypothesize that the set of bits of "primary knowledge" existing at the period of time under observation are different according to these "places" (firms and industries as well as geographic regions). It may be that some bits or elements are common across places, but some are different. By moving (from firm to firm or from region to region) the inventor can get new bits of ideas that enter into the evolving processes of recombination. Before moving, he might decide that he has exhausted the opportunities for successful recombinations in his current location. By moving, he may find new fields for hybridizing or new avenues for creating new economically valuable inventions. He retains the bits of knowledge he had accumulated at the previous place but now works in a new knowledge environment. His potential for recombinations has become higher. Moreover due to social ties knowledge interactions persist even after formerly co-located individuals are separated after moves (Agrawal et al., 2006).
Inventor mobility has always been recognized as a key mechanism for transferring tacit knowledge from one place to another between firms, industries, regions or countries (see Agrawal et al., 2006). But a move is also a way to learn more, or to learn more quickly. In this sense, mobility does not simply transfer knowledge from place to place as a spillover, but also increases the capacity to solve problems and basically increases the human capital of knowledge. Mobility as a mean for knowledge diffusion and extension matches the knowledge "reuse" approach of Langlois (2001), a type of increasing economy of scale at the core of economic growth process. Thus, we expect that mobility affects: (1) the productivity of prolific inventors, as measured by their average number of inventions per year over their active inventive lives, and (2) the value of their inventions, measured as the number of citations a patent receives in the years after its application is filed.6 As a consequence we hypothesize:
H2. Following a move (from firm to firm, or from region to region), an inventor's productivity increases.
A corollary is:
H2'. An inventor who moves a lot is more productive than an inventor who moves less.
II. Variables: Definition and measurement issues
1 Measuring "prolificness"
The distribution of number of patents by inventors is clearly not "normal"; in fact, it is highly skewed, with most inventors having few inventions and a few inventors having many inventions (Latham and Le Bas, 2011). Other research cited above established that prolific inventors produce more valuable patents (as measured by citations). We focus on these prolific inventors as the ones most valuable in contributing to economic development and seek to understand the determinants of their mobility. No theory leads to a clear delineation of the number of patents needed to qualify an inventor as "prolific." We use 15 patents to identify prolificness, a number that takes us far to the right in the distribution of numbers of patents by an inventor. Our models are robust to variations in the threshold for identification of prolificness: we have estimated our models based on larger and smaller thresholds and do not find dramatic changes as the threshold for identification changes between 10 and 20 patents, so the use of 15 is adopted without concern for that selection affecting the results significantly.7
2. Accounting for inventor career effects
In our dataset we observe that there are some inventors with careers of patenting that p many years and others whose fifteen or more patents are all produced in a very short period. To account for this variation we measure the duration of an inventor's career (the number of years from the inventor's first patent application to the last) and adjust other effects for duration. We use duration to compute productivity, value, and inter-firm mobility on a per year of career basis.
Some investigators (e.g., Hoisl, 2006, 2007; Schankerman, Shalem and Trajtenberg, Shiff, and Melamed, 2006) have tracked the numbers of patents and/or the numbers of citations that an inventor has prior to a move from one firm to another. Moves are assumed to be based only on past performance. We adopt a different approach, essentially assuming that the number of inventions that an inventor eventually produces is a measure of the potential that the inventor has always had. We assume that employers make rational (mostly accurate) predictions about the future productivity of inventors when they are hired. This assumption allows us to compute single measures of productivity or average citations per patent for each inventor.
3. Measuring inventor productivity
The simplest measure of an inventor's productivity is the number of patents he obtains (patent grants) over a career. We adjust this for the career length to obtain the average number of patents per year as our productivity measure.8 We add to the simple average a measure of the dispersion of patenting activity over the inventor's career. The measure we use in our analysis is the inverse of dispersion; it is the Herfindahl-Hirschman Index (HHI) for the time pattern of the number of patents in each year. We might have chosen the n-year concentration ratio instead, but the HHI more appropriately gives extra weight to years of higher concentration.
4. Measuring the value of an inventor's inventions
Ideally, one would measure the value of a patent through market-based metrics, such as the actual prices paid for them or the increase in the value of a firm in response to the acquisition of a patent. However, such measures are not available except for limited numbers of patents. The research literature on patents has, in the absence of any other measures for large patent data sets, accepted the number of citations a patent receives as a good proxy for the value of that patent. Harhoff et al. (2003) have shown that the number of citations is, in fact, a good proxy for the value of a patent. Therefore the value of all of an inventor's patents can be measured as the total number of citations his patents have received. An inventor's value can alternatively be viewed as his total number of citations, his average number of citations per patent, his average number of citations per year or his average number of citations per patent per year. The total number of citations fits with the concept of an inventor's potential but, just as with productivity it needs to be corrected for the duration of a career so the number of citations per year is a good measure. It is our primary measure of value but we also consider the number of citations per patent and the number of citations per patent per year.
5. Measuring inter-firm mobility
The simplest way of identifying inter-firm mobility (a move within the industrial structure from one firm to another) is to count the number of firms for which an inventor has worked and assume that the number of moves is this number minus one.9 However, this approach does not allow for the movement away from a firm and a subsequent return to it. Nor does such a measure consider the temporal pattern of the inventor's association with different firms. Another type of measure that might have been used is a measure of concentration, either the percentage of patents at n firms with the highest percentage (an n-firm concentration ratio) or a hhi that accounts for the variability in the distribution of patents across firms. However, these measures also fail to consider the sequential temporal pattern in any way (in the same way that a simple count of the number of firms also does not consider the pattern).
Still another way to measure inter-firm mobility is to list an inventor's patents chronologically and to count a move each time the assignee of the patent changes. Such a count results in the maximum possible measure of the number of moves that an inventor makes. Under this definition a single inventor in our dataset would be said to have moved 53 times. Such a high level of mobility may correctly represent the inventor, but certain patterns in a list of assignees seem to call that definition into question. For example suppose that Inventor # 1 assigns his first patent to firm A, the second to firm B, and the third to firm A, the fourth to firm B and so forth through the assignment of the tenth patent to firm B. Inventor # 2 assigns her first five patents to firm A and the next five to firm B. Inventor # 1 will be counted as having nine moves while Inventor # 2 will have only one move. Surely this result does not adequately capture a strong sort of mobility well. In attempting to deal with this problem we have measured moves in several alternative ways. In the alternatives we consider whether or not the inventor returned to a prior assignee within some specified period of time. If so, we do not consider the temporary or transient change in assignee to be an indication of a strong variety of mobility. We consider a two year persistence of a change to qualify for a move. We know the numbers of moves measured under this definition will be smaller than under the first definition. In our various procedures we have attempted to avoid describing what Hoisl (2007) identified as "false mobility." In results not reported here we have used several of these alternative definitions of mobility and have found, surprisingly, that our results are not sensitive to the definition of mobility.
6. Measuring technological mobility
Technological mobility of inventors refers to the fact that an inventor's patents are not all related to the same technological field (or class) over a career. Technological mobility witnesses the fact that an inventor worked on industrial research projects having different technological cores. We interpret this as evidence of "movement" from one particular technological field to another, or simply as "mobility." We could instead, and perhaps more appropriately, refer to an inventor's "level of technological specialization". In the interpretation of our results we can say that an inventor with low technological mobility is very specialized (as far as his technological competences are concerned), and conversely high mobility implies a lower level of specialization. Another term that we can use in this context is "intellectual mobility," which emphasizes the mental capacity of individuals to change the focus of their thinking as their inventive activities change from one technological field to another.
Among the possible measures of technological mobility of inventors that we considered were a count of the number of different technological fields in which an inventor has worked and the number of changes from one technological field to another. These measures are similar to the inter-firm mobility measures discussed in the preceding paragraph. In the case of technologies, though, the temporal pattern of an inventor's patenting in different fields does not seem to be of as much interest as the temporal pattern of inter-firm mobility. Consequently, we determined that a concentration measure would be good. We considered technology concentration ratios for the single highest concentration field and for the top 2 or other numbers. However, the HHI for technological fields appeals because of its greater emphasis (through the squaring of each field's percentage) on higher concentrations. We implemented the hhi at the level of six broad technological classes.10 Patenting in more than one of the 36 more detailed technology fields (as defined in the National Bureau of Economic Research, NBER, data) was observed to be very frequent and moves within the broader categories were also observed to be very frequent. Thus, it seemed that the moves between the six broad technology classes might be more indicative of real technological mobility by inventors. We also identify the broad field within which each inventor has the highest concentration of patents so that we can examine whether or not inventors who concentrate in each of these categories have significantly different behavior with respect to mobility, productivity and value.11
7. The truncation problem
Our patent data begin in one year (1975) and end in another (2002). For inventors whose entire inventive career falls within this p of years, there is no problem of bias from omitted years of activity before or after the sample period. However, for inventors who were already active prior to the sample or who remained active after the sample period, the truncation problem may be significant. All of our measures such as career duration, citations and number of patents could be underestimated if the sample truncates the careers of inventors. We have estimated our equations only for individuals whose patenting careers seem to fall wholly within the sample (those who have no inventions prior to 1979 and none after 1997). On the basis of this analysis, which showed no significant differences from the analysis including all inventors, we have not excluded for possible truncation bias any individuals. While there are some individuals whose patenting careers have been truncated, we are confident that our results have not been significantly affected by their inclusion in the analysis.
III. Models
In this paper we test a number of hypotheses about the relationships between and among inventors' productivity, their mobility in both the technological and the inter-firm dimensions, and the values their patents create. The following four equations express our conceptual empirical framework for testing these hypotheses:
Inter-firm Mobility = f (Technological Mobility, Productivity, Value of Patents, Temporal Patenting Pattern, Technical Field, Country) (1)
Technological Mobility = f (Inter-firm Mobility, Productivity, Value of Patents, Temporal Patenting Pattern, Technical Field, Country) (2)
Productivity = f (Technological Mobility, Inter-firm Mobility, Value of Patents Temporal Patenting Pattern, Technical Field, Country) (3)
Value of Patents = f (Technological Mobility, Inter-firm Mobility, Productivity, Temporal Patenting Pattern, Technical Field, Country) (4)
The parallel specifications of the equations are the result primarily of the limitations of our data. For example, while we are well-aware that there are both theories and empirical studies of productivity that highlight the roles of inventors' education and training, the capital available to them, the nature of the rewards system and the role of institutional constraints such as retirement ages and the nature of the patent system, we do not have those variables available to us. Similarly for both mobility and the value of patents many other variables have been suggested in theory and in other empirical studies. Consequently, our work is not in the framework of those that attempt to propose and test comprehensive theories of the determinants of productivity, mobility, or value. Instead, ours is a partial approach. We examine the ways in which productivity, mobility and value influence each other given our limited range of knowledge about other variables. While we can include a few other variables as controls, such as the temporal pattern of an inventor's career, we essentially assume that all of the omitted variables can safely be "held constant" for our analysis.
Chart 1 lists the variables that we have available for the analysis. For each of the conceptual variables included in the four equations, this chart shows that there are alternative specifications that can be used for most of our variables. We do not have economic theory to guide either our selections of functional forms of the equations (log, linear, etc.) or our selection of various ways of specifying the particular variables that we will use. In the end, we rely heavily on the empirical results in deciding which specifications to report. We have estimated and tested many alternative specifications. The combinations of alternative ways of specifying the equations lead to large numbers of possible equation specifications that fit within our structural framework.12

In this paper we focus on prolific inventors. Chart 2 shows some characteristics of our inventors including the significance of the prolific inventors in terms of the proportion of patents for which they are responsible in each country. The data in this chart indicate that there is probably a misidentification of prolific inventors to a greater extent in the Japanese data than in the other countries. The famous "names problem" (Trajtenberg, Shiff, and Melamed, 2006) of identifying inventors is compounded with Japanese names. We believe that many of the prolific inventors identified in the Japanese data are likely multiple inventors, the similarity of whose names led them to be identified as a single inventor. For this reason, the Japanese results ought to be viewed with a great deal of caution. It is interesting that, in spite of the names problem, the estimated coefficients for the Japanese models are frequently quite similar to those of the other countries. Beyond the obvious names problem with the Japanese data, we are aware that the "names" problem also manifests itself differentially but systematically across other countries as well. This fact provides a good justification for estimating each country's equations separately below.

Chart 3 provides summary statistics for the data. Again, there are systematic differences across the countries, especially for Japan. We re-emphasize that care must be taken in making comparisons across countries. It is important not to attribute to differential behaviors or institutions effects that are actually based simply on different degrees in the precision with which prolific inventors can be identified.

IV. Empirical estimation issues
All of our estimates use robust standard errors so that we do not have to be concerned about the effects of heteroscedasticity and, since our observations are inventors' careers, we do not have serial correlation problems with our estimates. The dependent variable for our productivity equation is the number of patents per year of an inventor's career within our dataset.
The values are technically truncated at 0, but have enough variability and range so that we are able to estimate the parameters with ordinary least squares. Similarly the dependent variable for inter-firm mobility, moves per year, allows us to use ordinary least squares (OLS). Our dependent variable for technical mobility is (1- a technical concentration ratio), which is strictly limited to the range from zero to one. Consequently we use censored normal (Tobit) analysis to obtain our parameter estimates. The dependent variable in our value equation is the number of citations an inventor's patents receive subsequent to their issue, clearly an integer count measure. We estimate the parameters assuming both Poisson and negative binomial distributions. We find little difference in the estimates and no evidence of overdispersion so we report only the Poisson distribution results.
The parallel specifications of the equations also may indicate simultaneity in the nature of the relationships among the variables. We are aware that our results might be influenced by simultaneous equations bias. We have performed some analysis not reported in the paper using instrumental variables. Preliminary analysis indicates that some parameters may be significantly affected. However, in the current equation structure with the data that we have available, there are few additional variables to use as instruments. We hope to explore the simultaneity further in the future along with implementing systematic tests for exogeneity of the independent variables.
The issue of the "right" specification when there are many potential alternatives based on alternative specifications of both the dependent and independent variables led us to estimate all of the basic 20 relationships (four equations for reach of the five countries) many different ways. Of course, in such an exercise the hope is that all coefficients will be substantially unchanged under alternative specifications so that one can declare the models to be robust to alternative specifications of the variables. We have found a lot of stability but cannot yet declare that ours is the most stable of all possible specifications. The most stable relationships are those between productivity and value in both the value and productivity equations: their coefficients never change signs over hundreds of alternative equation specifications across all five countries. Productivity is also very stable in the technical mobility equations across all the countries. Every other variable has some degree of instability.
V. Discussion of the results
Charts 4 through 7 present estimation results for each of the four equations. For each country, we estimate equations for productivity, mobility (in both the inter-firm and technological dimensions), and the value of inventions (as measured by patent citations).1. Determinants of inter-firm mobility


Productivity is a positive and significant determinant in all countries. This result is expected and conforms with results in the current literature. Technological mobility is also a positive and significant determinant in all five countries. This finding is in accordance with the results of Hoisl (2007) for Germany, but our results extend it to the other countries as well. Value is an insignificant determinant in France and the US, negative and significant in Germany and Japan and positive and significant in UK. These last results are interesting. They might be interpreted to mean that there is a global inter-firm mobility process in relation to productivity and technical mobility but that each country has its own process with respect to value. We know that countries differ through their institutional arrangements. Of course additional analysis will be necessary before we have definitive insights.
2. Determinants of technological mobility
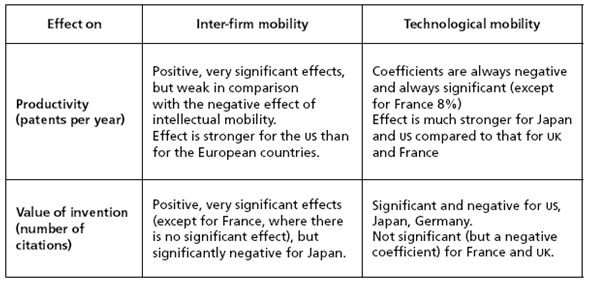
Here we innovate in the sense that ours is the first analysis (to our knowledge) of technical mobility. For that reason, we cannot refer to prior studies for guidance or for insights into the interpretation of our results. A significant finding is that inventor productivity is significantly and negatively related to technical mobility in all five countries (in France the significance level is only 10.2%). This means that the very productive prolific inventors (sometimes called "stars inventors") are less intellectually (technologically) mobile. To put it simply: they are more technologically specialized. This seems to confirm, for individual inventors a long-standing observation: the more specialized you are and you remain, the more productive you continue to be. The effect of inter-firm mobility is positive and significant (but very small) in all countries. The last result suggests that the two types of mobility are not only correlated, but deeply linked in the inventor's career as well. As far as value of inventions is concerned, again we find divergent trends across the countries: value is insignificant in the uk, France and Germany, significant and negative in the us and Japan (but the coefficients are very small).
3. Determinants of inventor productivity
The regressions all have relatively high R-squared values. Inter-firm mobility is consistently positive and significant, technological mobility (Hoisl's measure) is consistently negative and significant. Value (citations per patent) is again inconsistent in effect: insignificant in UK and France, negative in Germany and the US, positive in Japan.
4. Determinants of the value of inventor's inventions
Inventor productivity is consistently positive and significant (with very high coefficients), which confirms the findings of Gambardella et al. (2005) using the PatVal survey. They found that the characteristics of the inventor, in particular his/her past number of patents is the main determinant of the private value of inventions and more important than the characteristics of the organization in which he/she is employed. Our previous empirical research (Gay et al., 2008) has also confirmed this remarkable result. It seems in fact there is no (so-called) "inventor dilemma" regarding a choice between patent quality and patent quantity (Mariani and Romanelli, 2006). Note that the effect of technological mobility is negative in all countries and significant in Germany, the US, and Japan. Inter-firm mobility affects value positively in four countries and negatively in Japan. It is significant in all countries except France.
5. Nonlinear effects
The strictly linear specifications we have reported are, of course, highly restrictive. Yet they allow us to test our hypotheses about the relationships among mobility, productivity and value for productive inventors and have yielded results that make sense and also can be related meaningfully to other results in the literature. It is still possible that nonlinearities in the relationships might change our conclusions. We have explored some potential such nonlinearities. One straightforward way to examine nonlinearities might be to simply estimate the relation-ships in logs. However, two of the major variables of interest, numbers of citations, and inter-firm moves, both have a significant number of zero observations so that some form of adjustment is required to use full log specifications. Of course, partial log specifications might also be used, but instead we have taken two alternative approaches: (1) use of nonlinear terms in the equations and (2) use of interaction terms.
First we have tested to see whether or not the effects of one variable on the other variables are linear by adding a squared term to the equations. We chose technological mobility as the one to test first. For the inter-firm mobility equations, in which the technical mobility coefficient is positive and significant for each of the countries, the squared term is negative and it is significant for all, except for France. This result shows a nonlinear effect: the effects of technical mobility are moderated as technical mobility increases. However, neither the signs nor the significance of technological mobility or any of the other variables are changed by this effect, so we need not deal with this nonlinearity.
The effects of technological mobility in the productivity equations are also moderated by the squared terms which have the opposite signs from the linear terms and are significant for Germany, the US and Japan. Again, the other results are not changed by the addition of the nonlinear term. In the value equations, the results of adding the squared technological mobility terms are mixed: not significant for the UK, the US and Germany, significant and of opposite sign for France (the moderating effect again), and for Japan the sign of technological mobility changes to positive and is significant and the squared term has a negative sign and is significant. Once again, the rest of the results are basically unchanged.
Another form of nonlinearity can arise from interactions among the independent variables. For example, the effect of technological mobility might be influenced by the length of an inventor's career. We have explored this possibility to a limited extent by introducing some interaction terms in the equations. Introduction of a technological mobility-career length variable does not fundamentally alter our results. In the inter-firm mobility equations the interaction term is positive for all five countries and is significant for all but France. This seems to indicate that the interaction should be added to the equations. For the US and Japan other results are not affected; for both France and Germany, the addition of the interaction term causes both the career duration and technological mobility variables to become insignificant, perhaps indicating that the effect can be captured either in the interaction or the individual terms but not in both.
In the productivity equations, the interaction term was insignificant without affecting other results in four of the countries. For France, duration became negative and significant and the interaction term was positive and significant. In the value equations, the interaction term varied in significance and in sign, never affected the career duration variable and sometimes changed the sign or the significance of the technological mobility variable. On balance, our conclusion is that the particular interaction term that we used does not make a major contribution to the analysis. It is possible that some interactions that we have not explored would yield different results. It does seem that care must be exercised in introducing such terms. All of the reported results are after controlling for patenting time concentration, career duration, career time gap, and technological field of highest concentration for each inventor.
Conclusions
In this paper, prolific inventors are at the core of the study. Through "purely descriptive regressions" (a term of Trajtenberg) for the five largest countries in terms of innovative activities, we investigate the main determinants of inventor productivity, mobility and invention value. Our results extend previous research focused on the analysis of the complex relationships between (prolific) inventors' productivity and mobility and the value of their inventions. We investigate two forms mobility: inter-firm and technological. Our analysis of technological mobility (technological specialization at the inventor level) is the first empirical study of a large sample of inventors.
Our results are somewhat ambiguous because all the countries do not show the same trends:
Our inter-firm mobility equations tell us either (1) that the value of patents does not affect inventor mobility (for France and US) or (2) that inventors having low-value inventions are more mobile (Japan). The UK provides an exception, because for this country, the relation is positive and significant. Our results are not really similar to those obtained for the US by Trajtenberg, Shiff, and Melamed (2006). Exploring the relationship between the indicators of patent "quality" (including his measures of Citations Received, Generality, Originality, and Number of Claims) and mobility, Trajtenberg, Shiff, and Melamed (2006) conclude that inter-firm moves are positively related to quality as measured by these four indicators.
In the productivity equation the variable inter-firm mobility is everywhere highly significantly positive. Our hypothesis H2': An inventor moving a lot is more productive than an inventor moving less is confirmed. By contrast, the coefficient related to technological mobility is significantly negative. It means that when the inventor's specialization becomes more important (technological mobility decreases) inventor productivity increases. That is a finding in favour of specialization as a factor pushing inventive productivity (more specialized inventors are more productive).
In line with other recent studies, there is a clear and highly-significant relation that emerges from the invention value equation for all five countries. Inventor productivity is a determinant of invention value at the inventor level (but a lot of variety across countries exists as far as the size of the coefficient is concerned). As a consequence our H, the more productive an inventor is, the more valuable his inventions will be on average, is well confirmed. In our patent value equations the coefficients for inter-firm mobility are positive in four countries (not Japan) and significant in all except France.
We find it particularly significant that, in general, the results are similar for the five countries with the notable exception for patent value both when it appears as an independent variable in the equations explaining inter-firm mobility, technological mobility and productivity and when it appears as the dependent variable. These results may indicate that countries differ in their responses to determinants of patent values because of differences in their institutional arrangements, especially their approaches to national systems of innovation.
This last point appears very important since that it delineates a possible research agenda for the future. We feel that our work to date, on several countries and over a relatively long time period, might provide a basis, in terms of data, estimates, and trends in inventor characteristics (productivity, mobility, career) for constructing a fresh analysis of national innovation systems.

