


 nova página do texto(beta)
 Inglês (pdf)
 Artigo em XML
 Referências do artigo
 Enviar este artigo por email
 Citado por SciELO
  Similares em
SciELO
Similares em
SciELO 
 Permalink
Introduction
Dynamical systems theory is one of the most interesting theories in today’s physics, and nowadays it has important practical applications. Its object of study is the behavior of different systems by analyzing their variables over time in a space called phase space.1,2 The geometric structure generated in a phase space is called attractor.3 Two types of systems are known: predictable and unpredictable; the first one takes two forms: the point and the cycle; in the second one, an irregular behavior is observed called chaotic attractor, quantifiable with fractal geometry.1
The probability is a dimensionless mathematical measure of a finite number of possible events in an experiment that quantifies the possibility of occurrence of an event in the future.4 The entropy has been redefined according to the context in which its basic notions are applied, for example in the design of thermal machines,5 kinetic theory of gases,6 statistical mechanics7 and artificial intelligence.8
Electrocardiograms (ECG) are used and interpreted by doctors in different specialties, such as cardiology, internal medicine, family medicine and emergency medicine. ECG interpretations contribute to clinical decision making, so the physician must have a sufficient knowledge bases to make an accurate diagnosis. The physician must have an adequate knowledge to define, recognize and understand the basic pathophysiology of certain electrocardiographic abnormalities.9 Currently, the ECG serves as the gold standard for the noninvasive diagnosis of arrhythmias and conduction disorders, and is sometimes the only marker indicating the presence of heart disease.10
Outpatient ECGs are complex to analyze, because they are composed of waveforms series, influenced differently by a variety of pathological and pathophysiological factors.9 Moreover, the interpretation varies among specialists.11 On the other hand, an ECG reader should be able to compare the current path with the previous paths to make a correct diagnosis. All abnormal tracings must be compared to the previous available tracings. However, this is not enough since the specialist must be able to identify the errors committed in technical practice.9
Dynamic systems theory generated great interest among researchers who wanted to explore the chaotic behavior of biological systems and apply their findings to biology and medicine.12 However, when this theory was applied to the cardiovascular system, its analysis was considered complex. Investigations from this new perspective have been developed by Goldberger et al., who showed abrupt changes and sustained low frequency oscillations of the heart rate (HR) in patients with a high risk of sudden death.13 Subsequently, they found that the loss of complexity is associated with pathological conditions, such as the decrease in HR before sudden death and due to aging.14 Ivanov et al.15 demonstrated that the heartbeat modulation is even more complex than previously thought, requiring analysis of multiple scale exponents for characterization. In order to do this, Costa et al.16 developed a methodology to quantify the complexity through multiple scales, leading to the idea that an apparent loss of multiscale complexity is associated with life-threatening conditions, considering these measures of clinical importance.17 However, these investigations require additional studies to confirm and in many cases, to adjust its clinical applicability.12,18
Other investigations developed from the same context, based on the application of physical and mathematical theories, have succeeded in giving rise to predictive methodologies of clinical application, with which it is possible to make more precise mathematical distinctions between normal and abnormal cases. From this perspective, it has been possible to evaluate cardiac dynamics through continuous electrocardiographic records and Holters in 21, 16 and 15 hours19,24 by means of a methodology that evaluates cardiac dynamics by entropy proportions of the attractor with Holter records in 18 hours, allowing to make more precise distinctions between normality, chronic disease, acute illness and evolution between these states.19 To confirm the reproducibility and clinical applicability of the methodology, blind studies have been developed to evaluate the cardiac dynamics of 400, 450 and 600 Holter records;20-22 also, there were evaluated cases with clinical diagnosis of arrhythmia.23 The concordance between the conventional and mathematical diagnosis resulted in values of sensitivity and specificity of 100% and a kappa coefficient of one, thus indicating the level of certainty of the methodology, even in cases underdiagnosed from the conventional parameters.24
The purpose of the present investigation is to confirm the clinical applicability of the diagnostic methodology designed to evaluate cardiac dynamics with the entropy proportions of the attractor, by a blind study with 550 dynamics, including both Holter and continuous electrocardiographic records,19 comparing its diagnostic capacity to the conventional diagnosis, taken as gold standard.
Materials and methods
Definitions
Delay map: represents in a geometric way the dynamics of a system, locating for it ordered pairs of values of a dynamic variable consecutive in time in a space of two or more dimensions resulting in a specific type of attractor.
Ordered cardiac frequency pair: represents any consecutive combination of two cardiac frequencies in ranges of five lat/min which will be located on the x-axis, and the y-axis of the delay map.
Probability of consecutive ordered pairs in ranges of 5: represents the quotient between the number of ordered pairs that occupy that range and the total of ordered pairs of the whole plot.
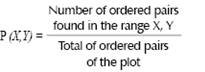 Equation 1
Entropy of the cardiac attractor: the calculation of the entropy for each of the numerical attractors generated is found by the following equation:
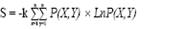 Equation 2
S is the entropy, K the Boltzmann constant (1.38 x 10⁻²³ Joules/Kelvin), P (X, Y) is the probability for each range (X, Y).
Proportions of the entropy of the cardiac attractor: the proportions are calculated from the algebraic clearance of the constant k to leave it in terms of:
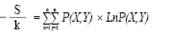 Equation 3
The summations of equation 3 correspond to:
 Equation 3(a)
Equation 3 can be simplified as follows
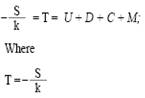 Equation 4
The proportions between the parts (U, D, C, and M) and the totality (T) are determined as follows:
Regions of the attractor to be evaluated: Region 1: it comprises all HR ranges common to normal electrocardiographic records. Region 2: is the totality of ranges occupied by normal electrocardiographic records, excluding those of region 1. Region 3: the total remaining region of the delay map, i.e., HR ranges that are not occupied by normal electrocardiographic records.
Population
To confirm the clinical applicability of the diagnostic methodology, the behavior of 550 Holter and continuous electrocardiographic records, 100 normal and 450 with different pathologies, aged 21 years and older, were analyzed. The selected patients come from a file of previous investigations of the Insight group, which have not been used in previous studies related to the same methodology. These records were evaluated by an expert cardiologist. Clinical diagnoses established by the expert were masked for statistical analysis.
Process
Values of HR and number of beats were taken every hour for 18 continuous hours. A numerical attractor was generated in the delay map from the ordered pairs of the HR; then, the probability of each of the regions was calculated with equation 1.19 Subsequently, the entropy was evaluated with equation 2.
After having computed the entropy for each attractor with equation 3, there were evaluated the proportions between each adding up to the total (ratio s/k), as well as the proportions between hundreds and thousands, and tens and hundreds for each region determined with equation 4. Subsequently, the diagnostic parameters of the previously developed methodology were applied,15 evaluating whether at least two of the proportions in any of the three regions were outside the limits of normality, which was the differentiating parameter between abnormality and normality.
For the severity level of pathological dynamics, there were taken the extreme values of the entropy proportions of the normal attractor, previously defined,19 with which it is established that upper limit of normality is subtracted from values of the proportions that are above these limits, while values below the minimum normal value were subtracted from that limit value. The differences obtained by this process were summed according to orders of magnitude of units, tens, hundreds and thousands with which finally, it was quantified how far or close they were to normality. In this way, the highest values correspond to more acute pathologies and lower values to less severe pathologies.
Statistical analysis
In order to confirm the applicability and clinical reproducibility of the diagnostic methodology, sensitivity and specificity were calculated considering the clinical diagnosis as the gold standard. For this, the conventional clinical conclusions of the registers were unmasked, to make the comparisons. For these calculations, true positive were denominated to the cases that have been diagnosed as pathological by both methodologies, false positives to the cases that were mathematically evaluated as sick and by the clinical expert within the limits of normality. The false negatives were the cases diagnosed mathematically as normal but classified by the expert as pathological, and finally, the true negative cases were diagnosed as within normal limits by both methodologies. Also, it was obtained the kappa coefficient that evaluates the concordance between the physical-mathematical and the conventional diagnosis.

Co is the number of observed concordances, which correspond to the number of patients with the same diagnosis from the mathematical methodology and the gold standard; To represents all cases; Ca corresponds to the number of random attributable concordances that are calculated through the following equation:
Where f1 is the number of cases with mathematical values of normality; C1 represents the number of cases diagnosed as normal by the clinical expert; F2 represents the number of cases mathematically evaluated as diseased; C2 represents the number of cases categorized from the conventional clinical diagnosis with some pathology; to represents the total number of cases.
Ethical aspects
The present study counts with previous approval of the ethics committee of the institution that allowed the taking of the electrocardiographic records. Additionally, the study is declared as a minimum risk investigation, according to Resolution 8 430 of 1 993 of the Colombian Ministry of Health, so that physical and mathematical calculations are performed on reports of non-invasive examinations and paraclinics that have been previously prescribed, according to conventionally established protocols, protecting the integrity and anonymity of the participants. The evaluation developed by the team did not affect the clinical decisions that were made about the treatments that patients should receive, since the data were taken from archives. The development of this research, as well as the application of its results, has no environmental impact in its realization. It also complies with the ethical principles of the Helsinki Declaration of the World Medical Association.
Results
The values of the S/k ratio obtained, ranged from -5 115 to -4 703 for normal cardiac dynamics, and ranged from -4 809 to -3 214 for the remaining cases. On the other hand, the entropy varied between 6,49 x 10-(23) and 7,06 x 10-(23) in the normal registers; for cases of disease these values were between 4,44 x 10-(23) and 6,64 x 10-(23). The previous maximum and minimum values distinguish both groups, but they do not allow to differentiate acute states from chronic ones. Proportional entropy values for the group of patients with normality ranged from 0 to 3 513, and for the group diagnosed with disease, these values ranged from 0 to 2 650 (Table I).
Table I: Values of entropy proportions for the three evaluated areas, of the 20 dynamics presented in table III.

In the diseased dynamics registers, there were found sums of the subtractions of hundred values outside the limits of normality, varying between 0,035 and 4,694 (Table II). It was obtained that at least two of the proportions of the abnormal attractors, in any region, were not within the limits of normality, and thus the diagnostic parameter previously found was confirmed.
Table II: Entropy values (S), s/k relation and sums of the subtractions of the entropy proportions of the values out of the normal limits, grouped by magnitude orders of units (U), tens (D), hundreds (C) and thousands (M) for the 20 cases in table III.

The dynamics with the greatest value in the sums of the subtractions of thousands were found in patient 24, with clinical diagnosis of acute coronary syndrome (Table III). Other patients, such as 08, 11 and 17, showed the lowest values of thousands of the entire population under study (Table II).
The values for the specificity and sensitivity were 100% when comparing the mathematical diagnosis to the gold standard; in the same way, the value corresponding to the concordance between the physical mathematical diagnosis and the conventional clinical diagnosis, determined by the kappa coefficient was equal to 1. It confirms the applicability and clinical reproducibility of the methodology.
Table III: Clinical diagnosis of 20 patients selected for the study, whose electrocardiographic records were evaluated with conventional parameters in medicine.

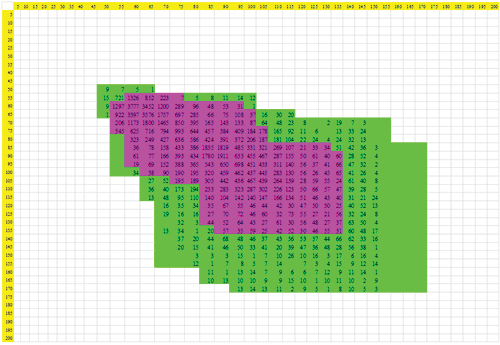
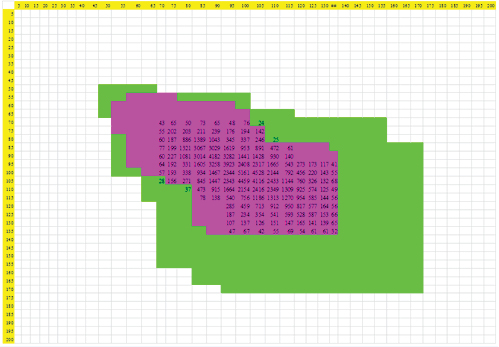
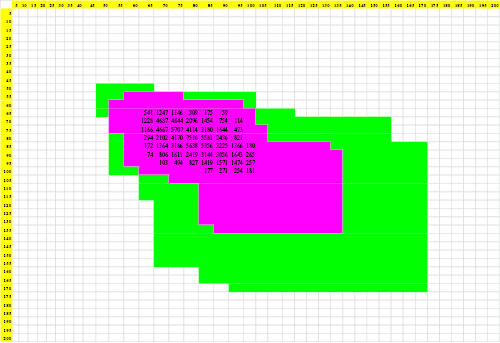
Figures 1 to 3 represent attractors of dynamics 9, 12 and 15, corresponding to cases of normality, chronic disease and acute illness respectively, evidencing the way in which the numerical attractor decreases its spatial occupation as pathological states worsen.
The results of the present investigation evidenced the clinical applicability of the new diagnosis of clinical application. In addition, it was possible to make mathematical distinctions that fit the previously established mathematical values for normality and abnormality in the methodology that underlies this new study.19
Discussion
This is the first work that confirms the diagnostic capacity of the methodology developed from the calculation of the entropy proportions and the analysis of the appearance of dynamics ordered pairs of chaotic attractors in the phase space, through a blind study with 550 patients, including normal cases and with different cardiac pathologies. There were found values for sensitivity and specificity of 100%, as well as a kappa coefficient of 1, confirming that the methodology allows establishing differences between normality, abnormality and evolution between them, with predictive diagnostic capacity for each particular case without the need of population parameters of epidemiology, thus constituting a methodology of clinical applicability.
Other methodologies based on dynamical systems theory, fractal geometry and chaos theory have demonstrated the possibility of evaluating cardiac dynamics in an objective and reproducible way, with clinical applicability.25-28 Such is the case of a mathematical law that evaluates the cardiac dynamics, differentiating normality from disease and evolution between these states.25 The clinical applicability of the methodology was confirmed by a diagnostic test, whose blind study evaluated 115 cardiac dynamics, finding values of sensitivity and specificity of 100% and a kappa coefficient of one.26 Other applications of the methodology have evaluated cardiac dynamics with arrhythmia diagnosis, quantifying the degree of evolution towards acute disease, as well as slight changes in cardiac dynamics that are not classified clinically as pathological.29 Although both methodologies are based on the construction of attractors from the dynamic systems, the present investigation is based on a new type of attractor, the numeric one that can be analyzed from probability and entropy, obtaining quantifications of evolution processes between normality, chronic disease and acute illness.
There are descriptive studies in the medical literature that analyze certain risk factors that may compromise correct cardiac functioning based on Holter records.30,31 Recently, a study of the functioning of New York firemen cardiac dynamics that are in service during their activities was made.30 The results were evaluated from the conception of cardiac variability as a predictor of cardiac events31 or cardiac death.30 However, other studies developed in the context of the theory of dynamical systems and fractal geometry, have revealed that disease is associated with a very regular or very irregular cardiac behavior, whereas normality presents an intermediate behavior between them, contradicting the traditional homeostatic conception,32 which supports studies based on statistical analyzes of heart rate variability. From fractal geometry, mortality parameters have been developed in patients with acute myocardial infarction with an ejection fraction of less than 35%, exceeding all conventional clinical parameters.33
However, the investigations developed from epidemiological parameters, and also the works made from non-linear perspectives present difficulties for its application or require additional studies to confirm its applicability.12 On the other hand, the present methodology, based on strict physical and mathematical theories and designed independently of the conventional clinical approaches, such as cardiac variability and homeostasis, achieves objective, reproducible and applicable diagnoses in each particular case.
The present work is supported by a form of inductive reasoning with which theories such as gravitational or relativity, have been created. For this, abstractions and mathematical inductions of the phenomenon are made, generally characterized by the formulation of theories and laws, which are then applicable to each particular case. It is also supported in an acausal perspective which allows to establish objective and reproducible measures of predictive nature.
From this new line of research, Rodríguez et al. have developed other predictive methodologies, derived from the establishment of mathematical orders with which the predictions can be made. It has been possible to evaluate neonatal cardiac dynamics, based on Holter records,34 as well as three key moments before presenting the clinical manifestations of sepsis.35 In addition, there have been developed other methodologies in areas such as arterial,36,37 cellular,38-40 and ventricular;41 also in infectology,42,43 public health,44 and immunology.45 Recently, a diagnostic methodology of adult cardiac dynamics was developed from Zipf’s Law,46 and also a mortality predictor method from dynamic systems and set theory in ICU.47

