


 nueva página del texto (beta)
 Inglés (pdf)
 Artículo en XML
 Referencias del artículo
 Enviar artículo por email
 Citado por SciELO
  Similares en
SciELO
Similares en
SciELO 
 Permalink
Introduction
Teaching and learning strategies using innovating technologies, such as the development of software or an understanding of the theoretical concepts of a piece of analytical equipment, can be essential tools for knowledge construction. Due to the intrinsic characteristics of these technologies, a multidisciplinary approach should be applied in the development of the necessary skills and competences for the execution of these activities. Problem-based learning (PBL) and team-based learning (TBL) skills are also required for the successful accomplishment of these tasks1. Several reports have cited improvements in the consolidation of knowledge and the potential for better preparedness of the students in terms of problem-solving of issues in their future career using these pedagogical strategies2,3, including the benefits derived from collaborative efforts in different disciplines4. These kinds of activities, which are mostly undertaken with the purpose of providing hands-on experience, are very necessary and should be encouraged in science, technology, engineering, and mathematics (STEM) degree programs5.
Based on these concepts, the use of low-cost equipment in undergraduate classes has been extensively investigated and forms an important theme in learning theories, especially for STEM students6,7,8,9. Following the growing emergence and popularisation of new technologies, these pedagogical practices have been emphasised10. Successful examples include several works involving the construction of low-cost spectroscopy and spectrophotometric equipment11,12,13,14,15,16,17,18. In addition to spectrophotometers, other analytical equipment such as pH instruments19,20,21 and potentiostat15 have been used as didactic resources, since the understanding of these devices involves fundamental physical and chemical concepts. A common feature in these works is the use of low-cost electronic microcontrollers, since the cost is a major concern when planning and implementing cost-effective class practices for numerous students. Hence, the use of an Arduino microcontroller for these educational purposes is noticeably increasing, as this device offers an open-source platform19,20,23,24,25.
We, therefore, based on the employment of Arduino microcontroller and RGB LED lights, proposed the construction of an innovative and low-cost colorimeter-like device which can be used to highlight important questions and concepts regarding the physics and chemistry teaching in undergraduate courses. Thus, this article presents some guidelines for teachers to conduct their students to construct a low-cost colorimeter by a PBL and a TBL approaches, and use it as a learning object, through which students can learn some principles about spectrophotometry.
Materials and methods
Colorimeter hardware design and construction
The Table 1 shows the materials (and an estimated price) required for construction of the device hardware.
Table 1 List of materials required for construction of the colorimeter hardware
| Quantity | Material | Function | Cost ($) |
| 1 | Arduino Uno (or similar) | Device control and to data acquisition | 10.00 |
| 1 | RGB LED (anode common) | Light source | 0.80 |
| 1 | LDR sensor (5mm) | Light detector | 0.60 |
| 3 | Electric resistor (270 Ω) | Modulator of the circuit electrical voltage | 0.30 |
| 2 | Electric resistor (10 kΩ) | Modulator of the circuit electrical voltage | 0.20 |
| 1 | Push button switch (2 pins) | Start button | 1.00 |
| 1 | Single sided copper clad (7 cm x 10 cm) | Electronic circuit confection | 0.20 |
| 1 | Glossy paper for laser printer | Electronic circuit printing | 0.10 |
| 1 | Powered iron perchloride (200g) | Copper clad corrosion | 1.00 |
| 7 | Male-male jumper cable (20 cm) | Electronic components connection | 2.00 |
| 6 | Female-female jumper cable (20 cm) | Electronic components connection | 2.00 |
| 1 | Welding tin | Electronic components welding | 2.00 |
| 1 | Silicone glue | Device framing | 1.00 |
| 1 | 3D printing | Frame device confection | 3.00 |
| 1 | Plastic cuvette (1cm x 1 cm) | Solution holder | 3.00 |
| Total | 27.20 |
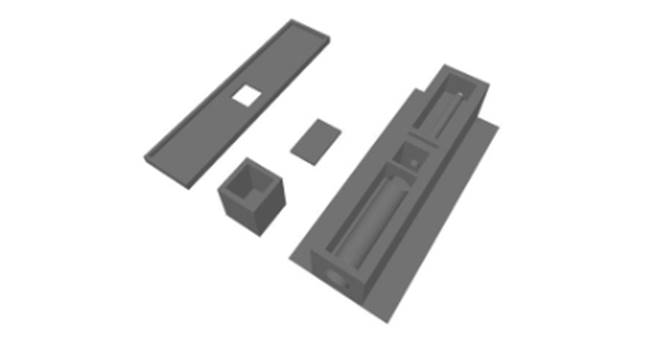
The colorimeter-like device frame was designed to accommodate the RGB LED and the LDR sensor. This frame needed to be aligned with a screen containing a small hole located between these two electronic components. The optical path should allow only the passage of a thin beam of light to avoid saturation of the signal received by the microcontroller in the LDR sensor. In figure 1, we show a suggestion for the frame design, which can be built using mouldable cardboard and silicone glue. The figure also shows a case made with a 3D printer, as an alternative to manual construction (Supplementary File 1).
We used a transfer technique to print the circuit board (PCB), first printing the electric circuit diagram on glossy paper using a laser printer and then transferring the toner from the paper to the copper-clad, using a conventional clothes iron. In this process, the printed paper was placed on a board and ironed for five minutes at the maximum setting. To avoid failure of the transfer, the copper plate was first cleaned using hot water, neutral detergent and a steel sponge. figure 2A shows the electronic circuit used in our device, and figure 2B illustrates the circuit diagram.
Following this, the printed copper clad was immersed in a solution containing 600 ml water and 200 g iron perchloride for 10 min (to allow corrosion of the copper) with gentle mixing at intervals of 1 min. The plate was then cleaned using a paper wipe moistened with thinner. All the electronic components were welded to the copper plate using tin and a conventional welding iron, and finally, the hardware was assembled as shown in figure 3.
Development of control and to signal-acquiring software to the colorimeter
A C++ script was developed to control the LED irradiance and to perform the acquisition of LDR data. The primary challenge in this step was to synchronize the combination of irradiance of each color (red, green and blue) so that a simulation of the entire visible spectrum could be emitted by the LED (a proposed script is presented in Table 2).
Table 2 The proposed C++ script for the microcontroller.
| Script for Microcontroller |
| double r;
//variable used to store the irradiance values for
the red color double g; //variable used to store the irradiance values for the green color double b; //variable used to store the irradiance values for the blue color double t; //parametric variable int rr; //normalized irradiance output for red color int gg; //normalized irradiance output for green color int bb; //normalized irradiance output for blue color int j; //auxiliar variable double l; //wavelength [400nm,700nm] int photocell; //input values read on the LDR sensor void setup () { Serial.begin(115200); //this value must be set for your computer pinMode (7, INPUT); //LDR sensor pinMode (9, OUTPUT); //blue LED pinMode (10, OUTPUT); //green LED pinMode (11, OUTPUT); //red LED } void loop () { if (digitalRead(7) == HIGH) { { for (j = 1; j < 11; j++) { for (l = 400; l < 701; l++) { r = 0.0; g = 0.0; b = 0.0; if ((l >= 400.0) && (l < 410.0)) { t = (l - 400.0) / (410.0 - 400.0); r = +(0.33 * t) - (0.20 * t * t); } else if ((l >= 410.0) && (l < 475.0)) { t = (l - 410.0) / (475.0 - 410.0); r = 0.14 - (0.13 * t * t); } else if ((l >= 545.0) && (l < 595.0)) { t = (l - 545.0) / (595.0 - 545.0); r = +(1.98 * t) - (t * t); } else if ((l >= 595.0) && (l < 650.0)) { t = (l - 595.0) / (650.0 - 595.0); r = 0.98 + (0.06 * t) - (0.40 * t * t); } else if ((l >= 650.0) && (l < 700.0)) { t = (l - 650.0) / (700.0 - 650.0); r = 0.65 - (0.84 * t) + (0.20 * t * t); } if ((l >= 415.0) && (l < 475.0)) { t = (l - 415.0) / (475.0 - 415.0); g = +(0.80 * t * t); } else if ((l >= 475.0) && (l < 590.0)) { t = (l - 475.0) / (590.0 - 475.0); g = 0.8 + (0.76 * t) - (0.80 * t * t); } else if ((l >= 585.0) && (l < 639.0)) { t = (l - 585.0) / (639.0 - 585.0); g = 0.84 - (0.84 * t); } if ((l >= 400.0) && (l < 475.0)) { t = (l - 400.0) / (475.0 - 400.0); b = +(2.20 * t) - (1.50 * t * t); } else if ((l >= 475.0) && (l < 560.0)) { t = (l - 475.0) / (560.0 - 475.0); b = 0.7 - (t) + (0.30 * t * t); } rr = r * 220; gg = g * 220; bb = b * 220; analogWrite(9, bb); analogWrite(10, gg); analogWrite(11, rr); delay(50); photocell = analogRead(0); Serial.print(int(l)); Serial.print(“;”); Serial.println(photocell); delay(50); } } } } } |
Light emission from the RGB LED was simulated from 400 to 700 nm in increments of 1 nm. In this procedure, the script used the microcontroller pins 9, 10 and 11 as digital outputs to control the combination of the irradiance of each colour of the RGB LED, while pin 7 was used as input to acquire data from the LDR sensor data. In our script, we used a combination of RGB LED irradiance to produce the frequencies of the visible spectrum that was proposed by Rabiei in the Stack Overflow community of programmers26. Nonlinear combinations of RGB irradiance were used with the intention to emulate the visible frequency of the electromagnetic spectrum using an RGB LED for further analysis of methylene blue (MB), methylene orange (MO) and cobalt chloride (CC) aqueous solutions. Thus, in the proposed script there are a combination of RGB irradiances (i) which are calculated for each wavelength (l). The combination of all these presented conditions and functions generates RGB irradiances at the wavelength domain (i(l)) as shown in figure 4.
Figure 4 Graphical representation of the RGB irradiance as a function of wavelength (i(l)). The RGB values were normalized between 0 and 220 because the RGB LED should be connected to the microcontroller PWM ports.
All equations in the script were parameterized as a function of a parameter t, resulting in r, g and b values ranging from 0 to 1. However, since the microcontroller PWM digital ports operate with values between 0 and 255, new variables were added in the script (rr, gg and bb) to normalize the r, g and b values. The maximum output values for PWM pins were normalized to 220 because previous experiments showed a saturation effect in the irradiance from the RGB LED for PWM values greater than 220. The previous experiments using a spectral measurement device also showed that the combination of irradiances not actually produced a full scan of the visible spectrum and, therefore, we chose to name the device as colorimeter, and not spectrophotometer.
Our script does not need an additional library and can be loaded directly into the Arduino microcontroller. The irradiance wavelength and theoretical transmittance data were displayed on the Arduino’s serial monitor using push-button triggering. For more accuracy, we performed 10 scans of the same solution sample or control (water in our experiments).
Absorbance experiments and calculation of the calibration curve
Aqueous solutions of methylene blue (MB), methylene orange (MO) and cobalt chloride (CC) at different concentrations (C1 = 1.25∙10-3 gL-1, C2 = 2.5∙10-3 gL-1, C3 = 4.0∙10-3 gL-1, C4 = 5.0∙10-3 gL-1, C5 = 6.0∙10-3 gL-1, C6 = 7.5∙10-3 gL-1, and C7 = 1.0∙10-2 gL-1 for MB and MO, and C1 = 8∙10-3 gL-1, C2 = 1.5∙10-2gL-1, C3 = 2.2∙10-2 gL-1, C4 = 2.9∙10-2 gL-1, C5 = 3.6∙10-2 gL-1, C6 = 4.3∙10-2 gL-1, and C7 = 5.0∙10-2 gL-1 for CC) were used to test the efficiency of the low-cost calorimeter-like based on their absorbance spectra and calibration curves. The average value of ten scans was used to build the absorbance spectra of each solution and concentration tested (C1 = 2.4∙10-6 gL-1, C3 = 1.0∙10-5 gL-1, C5 = 5.0∙10-5 gL-1, and C7 = 1.0∙10-4 gL-1 for MB and MO, and (C1 = 8 gL-1, C2 = 22 gL-1, C3 = 36 gL-1, and C4 = 50 gL-1 for CC). The absorbance values were determined by calculating the difference between the transmittance obtained in a control experiment using ultrapure water and the transmittance obtained for each solution at seven different concentrations. All the measures obtained in each scan using the low-cost device were adjusted by a one-term or two-term gaussian curve to eliminate signal noise. The MB, MO, and CC calibration curves were calculated using the seven solutions prepared for each compound and based on the average values calculated from ten scans. The same experiments were also replicated using a conventional UV-Vis spectrophotometer UV-M51 (BEL PHOTONICSTM).
Dynamic light scattering assays
DLS assays were performed with MB in deionised water with the following concentrations for MB: C1 = 1.25∙10-3 gL-1, C3 = 4.0∙10-3 gL-1, C5 = 6.0∙10-3 gL-1, and C7 = 1.0∙10-2 gL-1. Data from 100 measurements were collected at room temperature (25 °C) at a fixed angle of 90° using Dynapro TITAN equipment (Wyatt TechnologyTM). All of the results were analysed using Dynamics v.6.10 software (Wyatt TechnologyTM).
Results and discussion
In figure 5, 7 and 8, we compared the absorbance spectra of the compounds MB, MO and CC at four different concentrations obtained from the proposed calorimeter-like with equivalent data obtained from a conventional UV-Vis spectrophotometer. These compounds were chosen because each one of them present known absorbance peak close to each RGB colors.
Figure 5 Absorption spectra of MB solutions with different concentrations (C1 = 2.4∙10-6 gL-1, C3 = 1.0∙10-5 gL-1, C5 = 5.0∙10-5 gL-1, and C7 = 1.0∙10-4 gL-1), obtained using: (A) a low-cost calorimeter-like device; and (B) a conventional UV-Vis spectrophotometer.
Figure 6 Methylene blue (MB) particle dimensions observed in dynamic light scattering (DLS) experiments at different MB concentrations (C1 = 2.4∙10-6 gL-1, C3 = 1.0∙10-5 gL-1, C5 = 5.0∙10-5 gL-1, and C7 = 1.0∙10-4 gL-1).
Figure 7 Absorption spectra of MO solutions with different concentrations (C1 = 2.4∙10-6 gL-1, C3 = 1.0∙10-5 gL-1, C5 = 5.0∙10-5 gL-1, and C7 = 1.0∙10-4 gL-1), obtained using: (A) a low-cost colorimeter-like device, and (B) a conventional UV-Vis spectrophotometer.
Figure 8 Absorption spectra of CC solutions with different concentrations (C1 = 8∙10-3 gL-1, C3 = 2.2∙10-2 gL-1, C5 = 3.6∙10-2 gL-1 and C7 = 5.0∙10-2), obtained using: (A) a low-cost colorimeter-like device; and (B) a conventional UV-Vis spectrophotometer.
Figure 5A and 5B show the absorbance results obtained from the experiments with four MB solutions (C1, C3, C5, and C7) carried out with the conventional UV-Vis spectrophotometer and the low-cost device, respectively. With the low-cost equipment, it was possible to clearly identify an absorption peak around 622 nm at all concentrations and an additional absorption peak around 568 nm at the highest concentration (C7), while the commercial device detected two MB absorption peaks (approximately at 609 nm and 667 nm, respectively) in all the tested concentrations. Thus, despite the displacement of the highest absorption peak observed in the measurements obtained using the assembled colorimeter, the results demonstrated that the low-cost device was able to identify an unambiguous peak in the expected range of the MB absorption spectrum.
In order to investigate the secondary absorption peak detected by the low-cost device in the most concentrated MB solution we performed dynamic light scattering (DLS) experiments to verify the possible degree of molecular aggregation in solution. Curiously, the DLS experiments indicated the presence of MB aggregation particles in the solution with concentration C7, where was detected particles with a mean hydrodynamic radius (RH) of approximately 0.1 nm (a dimension compatible with that of isolated MB molecules) and other particles with dimensions close to 0.3 nm and 9.8 nm (figure 6). This process of MB aggregation may be related to the secondary absorption peaks around 609 nm identified by the UV-Vis spectrophotometer measurements at all the tested concentrations. It was remarkable that this pattern was not observed in the low-cost colorimeter-like experiments since the secondary absorption peak was observed only at the highest MB concentration.
The experiments performed using the low-cost colorimeter-like device and the UV-Vis spectrophotometer for the MO and CC solutions showed very similar absorption peaks. In relation to MO, the low-cost device identified an absorption peak around 455 nm for the solutions C1, C3, C5, and C7, while the UV-Vis spectrophotometer measured a peak at 467 nm, resulting in a shift of only 12 nm (figure 7A and 7B). An even smaller deviation was observed in the CC experiments: the absorption peaks measured by the colorimeter-like and conventional devices were, respectively, 507 and 513 nm considering the solutions C1, C3, C5, and C7 concentrations (a difference of only 6 nm) (figure 8A and 8B).
The low-cost colorimeter-like produced significant noise in the absorbance signal for all substances, which can be seen in the raw data in figure 5(A), 7(A) and 8(A). It is likely that this noise was inherent in the process due to the low accuracy of the electronic components used in the experiment, which were not designed for this purpose. As explained in the methodology, we can artificially eliminate the noise by fitting the raw data by gaussian curves of one term (for CC solutions) and two terms (for MB and MO solutions). We also highlight that previous experiments showed that our device was not able to finely scan the visible spectrum, thus the absorption spectra presented in the cited figures aims the identification of the wavelength combinations for which the solutions used in this study present the highest absorbance.
An analysis of the MB, MO, and CC absorption spectra obtained by the colorimeter-like equipment also reveals an expected pattern: higher solute concentrations increased the intensities of the absorbance peaks. This result indicated that feasible calibration curves could be calculated based on the measurements of the low-cost device, using the values of maximum absorbance intensity as a function of the concentration of the solutions. As shown in figure 9, the calibration curves calculated using data from the low-cost colorimeter-like also show a linear relationship between the concentration and absorbance of the compounds tested, with R2 values of approximately 0.96, 0.95, and 0.99 for the experiments involving, respectively, the MB, MO, and CC solutions. Therefore, these results demonstrated clearly that the proposed device can be used to determine the solution concentrations of the compounds tested and probably other substances with similar absorption spectrum ranges.
Figure 9 Calibration curves obtained from the low-cost colorimeter-like device calculated for: (A) MB solutions (C1 = 1.25∙10-3 gL-1, C2 = 2.5∙10-3 gL-1, C3 = 4.0∙10-3 gL-1, C4 = 5.0∙10-3 gL-1, C5 = 6.0∙10-3 gL-1, C6 = 7.5∙10-3 gL-1, and C7 = 1.0∙10-2 gL-1); (B) MO solutions (C1 = 1.25∙10-3 gL-1, C2 = 2.5∙10-3 gL-1, C3 = 4.0∙10-3 gL-1, C4 = 5.0∙10-3 gL-1 C5 = 6.0∙10-3 gL-1, C6 = 7.5∙10-3 gL-1, and C7 = 1.0∙10-2 gL-1); and (C) CC solutions (C1 = 8∙10-3 gL-1, C2 = 1.5∙10-2 gL-1, C3 = 2.2∙10-2 gL-1 C4 = 2.9∙10-2 gL-1, C5 = 3.6∙10-2 gL-1, C6 = 4.3∙10-2, and C7 = 5.0∙10-2). The calibration curves are linear, indicating the feasibility of a calibration curve based on the data from the low-cost device.
Conclusions
The results demonstrated that the low-cost colorimeter-like was able to identify unambiguous peaks in the expected range of the MB, MO and CC absorptions spectrum. However, we emphasize that there are divergences between the theoretical wavelengths produced by the equipment and the real wavelengths emitted by the RGB LED. For this reason, our low-cost device was classified as colorimeter-like device instead of a regular spectrophotometer. An analysis of the experiments also showed that higher MB, MO or CC concentrations increased the intensities of the absorbance peaks detected by the low-cost device. In this way, a feasible calibration curve of different solutions could be calculated based on the measurements from the low-cost device, using the values of maximum absorbance as a function of the solution concentration. Finally, these findings showed that our novel colorimeter-like device based on the use of a RGB LED can be useful for experiments aiming the teaching of important chemistry and physics concepts in undergraduate courses.

