


 nueva página del texto (beta)
 Inglés (pdf)
 Artículo en XML
 Referencias del artículo
 Enviar artículo por email
 Citado por SciELO
  Similares en
SciELO
Similares en
SciELO 
 Permalink
Introduction
The chemical analysis has its origin in ancient times. The first known chemical reaction used in the analysis was developed by Caius Plinius Secundus (23-79 A.D.) and was used to detect qualitatively the presence of ferrous sulfate in verdigris (platinum) (Hillis, 1945). In the second half of the 17th century, Robert Boyle studied the application of chemical reactions for the identification of several substances also introducing new analytical chemicals. In the beginning of the 20th century, the work of Theodor Behrens and Fritz Feigl concerning microanalysis introduced new technique in the field (Szabadváry, 1966).
As pointed out by Benedetti-Pichler and co-workers, some chemistry teachers already recognized the superiority of qualitative analysis as a teaching instrument (Benedetti-Pichler et. al., 1957). Since the 60’s, the main focus of the qualitative analytical chemistry became teaching activities whose goal was spreading out the chemical knowledge and improving the learning process. In addition, the course would comprise instrumental techniques, ion separation and the investigation of the composition of unknown samples. Such procedure should be responsible for encouraging the student’s creativity (Alvim e Andrade, 2006; Senise, 1982; Frank, 1957).
Nowadays, the qualitative analysis lab classes, in many Brazilian universities, comprise separation and identification of cations and anions, by means of individual or group tests. The cations are divided into five groups according to their precipitation reactions and the group reagent. Apart from of group V, the cation analysis comprises some procedure sequences which aim to separate the interfering ions and obtain the desired species, which is then confirmed by means of specific tests (Abreu et al., 2006; Vogel, 1979).
On the other hand, despite the existence of proposals for grouping the anions according to their volatility or silver salt reactions, there is a great difficulty in determining the composition of anionic mixtures due to chemical incompatibility or similarity of these species (Vogel, 1979). Thus, the anion analysis is frequently carried out by means individual tests.
The systematic approach previously described for the five cation groups allows a fruitful discussion between teacher and students concerning some Chemistry fundamentals concepts, as equilibria of precipitation, acidity and basicity, and solubility. The same principle cannot be stated for the individual anion study, which favor memorization instead of learning, limiting the development of students’ scientific and investigative sense.
A laboratory investigative activity allows developing some cognitive skills as hypotheses formulation, understanding of variables, careful observation and interpretation of results, enabling the development of knowledge necessary for scientist’s formation (Raghubir, 1979). In order to conduct an investigative laboratory the teacher must lead the class to work the chemical knowledge based on macroscopic observation, what can be visualized during the experiment; microscopic interpretation such as scientific theories that explain the studied phenomena; and representational expression, the use of scientific language such as chemical reactions, formulas, graphs and models that represents the phenomena observed (Silva, et. al., 2010; Avila and Matos, 2017). In this sense, our research group developed recently a didactic approach concerning the systematic analysis of the chloride (Cl-), bromide (Br-) and iodide (I-) anions (Souza et al., 2015). Our methodology has been satisfactorily applied in Chemistry undergraduate courses at University of Lavras, in Brazil, since 2014.
In the present work, we report a new laboratory investigative experiment for separation and identification of the carbonate (CO32-), phosphate (PO43-) and chromate (CrO42-) anions. We believe that the proposed experiment can improve the study of anions in undergraduate courses through the discussion of essential topics in chemistry what also contribute to students training. In addition, questions to the students were suggested in order to encourage their active participation in the experimental work.
Reagents and Equipment
The experiment is conducted with ammonium or potassium carbonate ((NH4)2CO3 or K2CO3), potassium chromate (K2CrO4), tribasic potassium phosphate (K3PO4), barium nitrate (Ba(NO3)2), barium hydroxide (Ba(OH)2), hydrogen peroxide (H2O2 30%(v/v)), sodium hydroxide (NaOH), acetic acid (H3CCOOH), hydrochloric acid (HCl) and isoamyl alcohol (C5H11OH). For acidity measurements, we recommend J Prolab pH indicator strips (with 4 colors). For separations, a centrifuge such as the Q-222TM model (Quimis).
Experimental Procedure
Use a pipette to add 0.5 mL of (NH4)2CO3 (1.0 mol L-1), 0.5 mL of K3PO4 (1.0 mol L-1) and 0.3 mL of K2CrO4 (1.0 mol L-1) to a test tube. To the stirred resulting mixture add 0.2 mL of saturated Ba(OH)2. Add 1.9 mL of Ba(NO3)2 (1.0 mol L-1) and use the centrifuge at 3000 RPM for 3 minutes due to the formation of a precipitate. Discard the supernatant into appropriated residue flask. To the precipitate slowly add approximately 5mL of CH3COOH (3.0 mol L-1) until pH 3 and observe the effervescence. Then use the centrifuge for another 3 minutes at 3000 RPM. Keeps the precipitate in its original tube, at this stage, named “tube A”. Place the supernatant into another test tube, named “tube B”. Into the tube B slowly add NaOH (3.0 mol L-1) until pH 5. At this point, a white solid is formed. Into tube A, add 1.0 mL of HCl (3.0 mol L-1) until full solubilization of the precipitate. The pH will reach 2 after solubilization. At this point, observe the color change. Then add 1.0 mL of C5H11OH to the test tube. This results in a system with two phases. To such system, add the H2O2 3.0% (v/v) and observe the formation of distinct colors: one in the aqueous phase, another in the organic phase and also another in the interface of the resulting system.
Results and Discussion
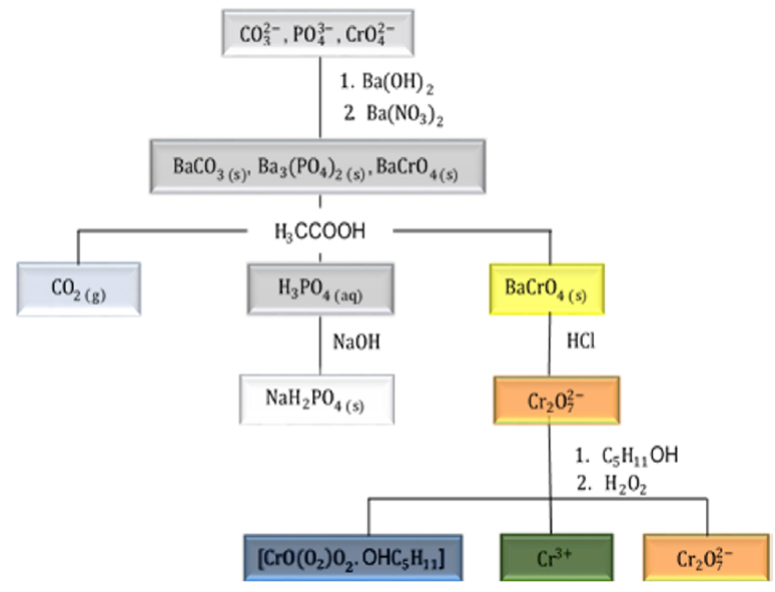
At first, the teacher should ask the students about the possibility of qualitative separate carbonate, phosphate, and chromate anions in an aqueous solution. For teaching aims, the incomplete flowchart depicted in Figure 1 is presented and discussed. On the basis of this flowchart, the first point introduced corresponds to the precipitation equilibrium and solubility.

In 1899 Walther Nernst showed that the equilibrium between an ionic solid and its
aqueous solution is governed by a solubility-product constant (Ksp). For the overall
equilibrium
The Ba(NO3)2 was chosen as precipitating reagent because all studied anions herein form insoluble compounds with Ba2+. The addition of this reagent results in the formation white and yellow precipitates. At this point, we suggest addressing the following questions to the students: What the precipitates were formed, in view of the ions present in solution? Would you be able to write the equations that describe the chemical equilibria involved in the formation of these salts?
These equations are showing in 1,2,3. The Table 1 containing the solubility product constant (Ksp) and solid colors (Skoog et al., 1992) should be presented to students and discussed on the basis of the colors of the chromium ions and salt solubility.
Table 1 Solubility product constant (Ksp), at 25ºC for BaCO3, Ba3(PO4)2 e BaCrO4 with colors
| Compound | Ksp | Color |
|---|---|---|
| BaCO3(s) | 5,0 x 10⁻⁹ | White |
| Ba3(PO4)2(s) | 1,3 x 10⁻²⁹ | White |
| BaCrO4(s) | 2,1 x 10⁻¹⁰ | Yellow |
At this point, the discussion is focused in the Kps values that can be used to
determine the molar solubility (s) of the salts, that corresponds to the number of
moles of a substance that can be dissolved per liter of solution before the solid
formation. For BaCO3 and BaCrO4 salts, the charges of the ions
are the same (2+ and 2-). Therefore, the teacher should argue that s can be obtained
by the square root of Kps (see table) what corresponds to 7,1 x 10⁻⁵
mol.L-1 and 1,4 x 10⁻⁵ mol.L-1 for
BaCO3 and BaCrO4, respectively. For the
Ba3(PO4)2 the ion charges are different (2+ and
3-) and the molar solubility is then determined by slightly more complicated
equation, what can be promptly discussed with the undergraduate students. For such
salt,
The simultaneous CO3 2-, PO4 3- e CrO4 2- anion separation was conducted by addition of CH3COOH to the precipitates. This acid was slowly added until pH 3 (the students should measure the pH). Along the acid addition, an effervescence will be observed. Moreover, part of the initial precipitate will dissolve. As expected, a yellow precipitate will remain in the test tube, since the BaCrO4 is insoluble in dilute acetic acid (Vogel, 1979).
At his point, for teaching aims, carbonate and phosphate speciation diagrams (Figure 2 and 3, respectively) should be discussed. These diagrams represent the molar fraction of each species at different pH. The discussion should be focused on which species would be present in the pH of the solution after acetic acid addition (pH 3).


According to Figure 2 when acid is added to a salt of carbonate or to a CO3 2- solution this anion tends to react with the H+ of the acid and form protonated species. At pH values smaller than 6, H2CO3 is produced but quickly decomposes to CO2(g) and H2O. Indeed, the diagram shows that CO2 is the unique compound at pH close to 3. Clearly, the acetic acid addition eliminates all CO3 2- anions from the mixture, what is attested by the effervescence. Simultaneously, Ba3(PO4)2 was solubilized and separated from BaCr2O4.
The Ba3(PO4)2 is soluble in acid media what can be understood on the basis of the phosphate diagram (Figure 3). The acid addition also makes the PO4 3-protonation and at pH values near 3, the dihydrogen phosphate (H2PO4 -) and phosphoric acid (H3PO4) soluble species coexist. Thus, the students are encouraged to investigate which species are present in each phase of the solution: the gas, aqueous and solid phase. Furthermore, the teacher should request that students whrite the equation for the decomposition of carbonic acid (4) and the equation related to the Ba3(PO4)2 solubilization (5).
According to the proposed experimental procedure, the supernatant containing the H3PO4 and H2PO4 - should be transferred to the test tube B. The BaCr2O4 will remain in the test tube A. Into tube B, the PO4 3- anion characterization is carried out by slow addition of NaOH until pH 5. In such procedure will be observed the formation of a partially soluble white solid. At this point, the teacher should ask some questions related to the speciation diagram for instance, what is the predominant species at pH 5? Once the predominant species is found, what is the composition of the salt formed? Would you be able to write the equation for the PO4 3- characterization reaction? According to Figure 3, the H3PO4 is deprotonated as the pH of the solution increases. At pH values near 5, the predominant ion is the dihydrogen phosphate (H2PO4 -). Thus, the sodium dihydrogen phosphate (NaH2PO4) will be the obtained salt according to equation 6.
In the presence of dilute mineral acids, such as HCl, the BaCrO4 is fully soluble and a yellow solution of chromate (CrO4 2-) becomes orange-red due to conversion these ions in dichromate ions (Cr2O7 2-) (Vogel,1979). For his particular distribution, the discussion should be slightly more rigorous. The diagram for the Cr (VI) species is depicted in Figure 4. Such diagram should be discussed with the students.
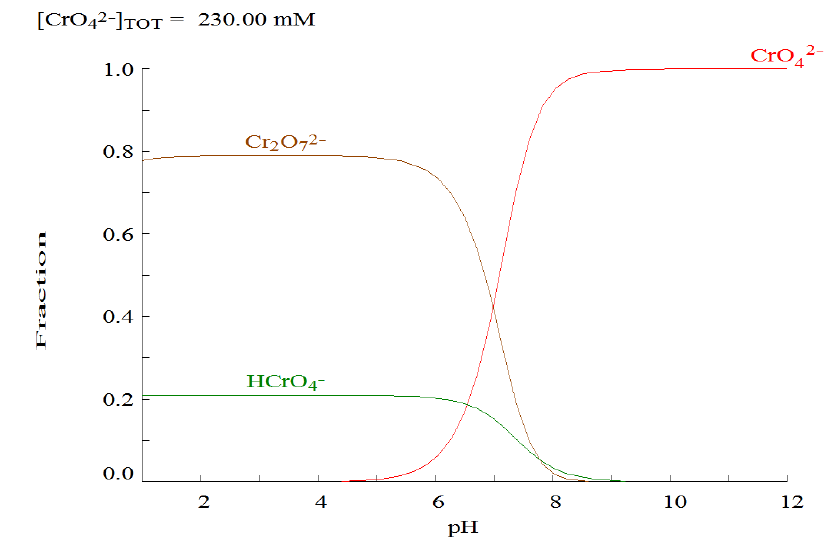
When HCl is added in the BaCrO4, the yellow salt will be fully solubilized giving rise to an orange resulting solution, at pH equals to 2. The chromate speciation diagram in Figure 4 allows a rigorous discussion. The teacher should ask at first, about the predominant ion at this pH. According to the Figure 4 this solution contains several species in equilibrium, that can be discussed based on the Equations 7 and 8 (Kalbus, et al. 1991; Vogel, 1979).
According to the diagram in Figure 4, above pH 8, CrO4 2- predominates and below pH 6 HCrO4 - and Cr2O7 2- are the principal species. The predominant color of the solution depends on the particular ion concentration. The orange color identified after the HCl addition is justified by Cr2O7 2- presence in high concentration. According to the literature, the protonation of the chromate ion (Equation 7) and the dimerization of the HCrO4 - acid (Equation 8), are numerically described by the logβ1 and logKD, that corresponds to 6.09 and 1.77, respectively (Gans, 2000). The dimer contains two chromium atoms and therefore, its concentration is half that of the monomer and therefore, the total chromium concentration corresponds to [CrO4 -2] + [HCrO4 -] + (1/2)[Cr2O7 -2]. The students can be encouraged to construct the speciation diagram depicted in Figure 4 through the demonstration that [Cr] = [(β1 x [H+])-1 + 1][HCrO4 -] + (1/2)KD x [HCrO4 -]2; for which [HCrO4 -] can be evaluated bearing in mind that for the experiment [Cr] = 0.23 molL-1. The students may also be stimulated to demonstrate that [CrO4 -2] = [HCrO4 -] x (β1 x [H+])-1 and that [Cr2O7 -2] = KD x [HCrO4 -]2.
At the end of the discussion concerning the Cr VI speciation diagram, the teacher should ask about the initial pH of the solution. At the beginning of the experiment Ba(OH)2 solution was added in order to alkalize the initial solution containing the CO3 2-, PO4 3- and CrO4 2- anions. The students should explain why this procedure is necessary. As previously discussed, such procedure is necessary since in an acid media the high H+ ions concentration leads to CO3 2- decomposition what decreases the CrO4 2- anion concentration due to Cr2O7 2- formation and causes the protonation of the PO4 3- anion, making the formation of the precipitates impossible (Vogel, 1979).
The final steps in the experimental procedure correspond to the addition of an organic compound and peroxide. The system will acquire another liquid phase. The addition of peroxide will result in a two-phase system with three colors. This part of the experiment serves to motivate the undergraduate students to study and discuss another fundamental chemical aspect such as redox and complexation and also liquid-liquid extraction. For teaching aims, the following explanation can be the object of debate.
When amyl alcohol (C5H11OH) is added to the solution containing Cr2O7 -2 ions, the separation of the solution in two layers takes place. This because amyl alcohol and water are partially miscible liquids. The addition of peroxide results in a three colors solution being blue, the apolar layer (amyl alcohol), orange, the polar layer (water) and the green, the interface as illustrated in Figure 5.

At this stage, the Equations (9), (10) and (11) can be discussed by the teacher.
In a general line, Equation (9) accounts for the chromium pentoxide formation (CrO(O2)2·H2O). This complex is formed by one oxo (O2-) and two peroxo ([O2]2-) ligands. The chromium oxidation state still corresponds to VI. The oxidation-reduction equation that accounts the decomposition of CrO(O2)2·H2O is represented by (10). The teacher should discuss the change in the oxidation state of the chromium and the corresponding green color formed in the interface of the test tube. Finally, the Equation (11) accounts for the coordination of the C5H11OH, solvent employed for CrO(O2)2 extraction and stabilization, what results in the establishment of the blue color in the organic phase. This procedure is know as liquid-liquid extration, and is based on the distinct miscibility of a particular compound (Vogel, 1979).
The teacher can discuss that CrO(O2)2·H2O is soluble in water but highly unstable (quickly decomposes making a Cr3+ ion). To avoid this decomposition, an alternative corresponds to extract this complex by changing the water by an oxygenating organic ligand as illustrated in Figure 6 (Rich, 2007; Buchera et al., 2005). The blue color is the result of the complex formed between CrO(O2)2 and C5H11OH as also shown Figure 6.

The polar phase remains orange due to Cr2O7 2- ions.
There are in literature a discussion concerning the reaction of chromium VI species with peroxide at distinct pH. Is important to mention that such reaction is still discussed (Aiyar, et al. 1990; Lianbo and Lay, 1998; Griend, et al., 2002; Buchera et al., 2005) showing that apparently, simple chemistry combinations can become a rich source of inspiration.
At the end of the experiment, the completed flowchart depicted in Figure 7 should be presented and discussed.
Conclusion
The experiment provided is an interesting approach for teaching qualitative chemistry for undergraduate students, highlighting relevant concepts related to precipitation, chemical equilibrium, solubility, and pH influence in the chemical species (speciation diagrams). Furthermore, the applied methodology encourages the developed of the investigative sense of the undergraduate students since promote the macroscopic observation, microscopic interpretation, and representational expression, essential requirements for scientific training.

