


 nueva página del texto (beta)
 Inglés (pdf)
 Artículo en XML
 Referencias del artículo
 Enviar artículo por email
 Citado por SciELO
  Similares en
SciELO
Similares en
SciELO 
 Permalink
Introduction
The increase in general availability of computing power represents the fastest and longest sustained technological advance in human history (Bedolla & Bermúdez, 2009). The maturing of hardware and software increased significantly our ability to statistically analyze data (Schlotter, 2013). Consequently advances in computation gave new horizons to chemistry research and education (Ferreira, Da Costa, De Miranda, Figueiredo, & Ginarte, 2014) because now interpretation of a great number of atomic/molecular properties is possible, helping chemists investigate simple and complex systems (Ferreira et al., 2009). However when you have a large set of data, it is not an easy task to analyze so many variables and extract useful information from them. Besides it seems that this process requires infinite patience (Ferreira, Figueiredo, Barbosa, & Pinheiro, 2012). Then what to do?
Whenever you have to find patterns by analyzing a huge data matrix, it is certainly difficult to make comparisons by visualizing the raw data. So application of a pattern recognition method is desirable. A very simple approach that can be easily performed and understood is the k nearest neighbor (k -NN) method. The algorithm in this method classifies an object into a distinct class when there are two or more groups of objects of known class. It is based on the concept of proximity and makes no assumption about the distribution in the classes (Miller & Miller, 2005). This similarity technique assumes that the closer objects lie in measurement space, the more likely they belong to the same category or they are similar with respect to the variables under study. In general, when the number of measurements is two or three, the classification of objects can be done by simple graphical approaches in two or three dimensions, respectively. But in the cases where there are more than three variables, as is usual in chemistry, it is necessary to extend the concept of distance to one in multidimensional space, each axis representing a variable. Although we cannot visualize more than three dimensions, computers can handle geometry in an indefinite number of dimensions, and the idea of distance is easy to generalize (Brereton, 2007).
In this work the k nearest neighbor (k -NN) method is used to classify the representative elements as metal or nonmetal according to their periodic properties. The properties considered are atomic radius (size), first ionization energy (the energy required to remove an electron from a gaseous atom), electron affinity (the energy change involved in adding an electron to a gaseous atom) and electronegativity (a measure of the tendency of an atom to attract electron in a chemical bond). One special aspect about the periodic properties is that generally they vary regularly as we move across a period or up to down in a family. The knowledge of periodicity helps understand chemical and physical properties of the elements and their compounds. The importance of the periodic table of the chemical elements is that it is the principal organisational feature of chemistry (Glasser, 2011).
The representative elements, which are also called main-group elements, comprise both metals and nonmetals. They are found, in the long-form periodic table, in groups numbered 1, 2 and 13 through 18 or, as an older classification, groups numbered 1 through 8 with each number followed by a letter A. The disposition of these columns is into two blocks of columns separated by the transition metals. Groups 1 and 2 are on the left side of the table and are called the s -block elements while groups 13 through 18 are on the right side and are called p -block elements. One common aspect about the representative elements is that every element in the group has the same valence electron configuration and shows distinct and fairly regular variations in their properties with changes in atomic number. For the transition elements, the variations are not so regular because electrons are being added to an inner shell. In this discussion the noble gases were not included because they are generally not listed in electron affinity/electronegativity tables. They have no affinity for electrons since they have eight electrons in their outermost shells (except for He, which has two), as a consequence any additional electron must be added to the next higher electron shell.
Metallic elements are typically solid (mercury is the only liquid), lustrous, malleable, ductile, conduct electricity and heat well and tend to lose electrons in chemical reactions. On the contrary, nonmetals may be solid, liquid (only bromine) or gaseous and generally are characterized as presenting low electrical conductance. We must remember that the periodic table of the elements does not exist in only a single form and different formats are possible as it is well discussed by Rich and Laing (2011). For example, the frontier between these two classes in the periodic table is not a definite matter. One of the common forms considers a division indicated by a "staircase" line that runs from the top of group 13 to the bottom of group 16. The metals lie to the left of this division (except hydrogen) whereas the nonmetals lie to the right.
The main pedagogical objective of this paper is to show how statistical method such as k -NN can be used in data analysis in Chemistry, particularly in making comparisons, as it is described in this example with the representative elements. So this work is a guide to the use of k -NN classification technique intended to teachers and advanced college students. Authors believe that chemometrics, the use of statistics in chemistry, is important to anyone who deals with chemical information. Chemometric methods enjoy an ever-increasing popularity and there is a need to introduce more graduate students to these research tools (Öberg, 2006). The topics involved that emerges from Chemistry and Statistics can be visualized in Fig. 1.

Methodology
The start point in this statistical analysis is the construction of the data matrix 38 × 4 (Table 1): 38 lines for chemical elements and 4 columns for periodic properties. Sometimes auto scaling data as preprocessing is necessary before running k -NN algorithm. Auto scaling a value is just subtracting mean followed by division by standard deviation. The results are scaled variables with zero mean and unit variance. This is required in order that the values have the same importance regarding the scale (Ferreira, 2002). Afterwards the chemical elements receive a priori their true classification (in this case, metal or nonmetal).
Table 1 Elements and the four periodic propertiesa selected to run k-NN method.
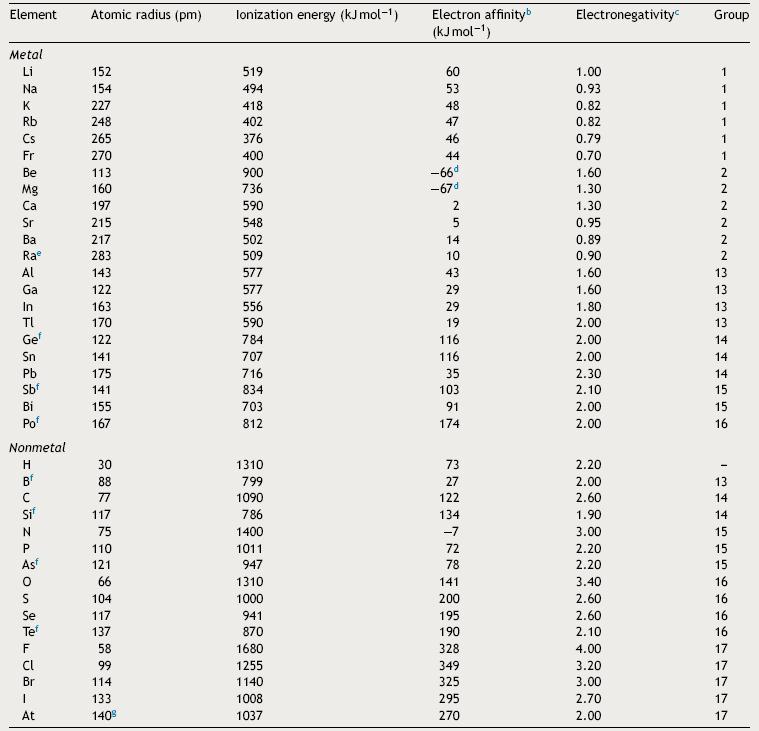
a Atkins and Jones (2009).
b The convention adopted in this work is the same in ref. a: positive electron affinity corresponds to an exothermic process while negative electron affinity corresponds to an endothermic process.
c Pauling scale.
d Lee (1996).
e Periodic Table (2014): http://www.rsc.org/periodic-table/element/88/radium.
f Metalloid.
g Zumdahl and Zumdahl (2007).
In the next step the geometric distance of an element to all other elements of the training set is calculated. Usually Euclidean distance is computed (Massart, Vandeginste, Deming, Michotte, & Kaufman, 2003). Euclidean distance is a common numerical measure of similarity used in multivariate analysis that is calculated through Eq. (1), where d is the distance between two points (chemical elements) in n dimensional space with coordinates (x 1 , x 2 , ..., x n ) and (y 1 , y 2 , ..., y n ). The distances are ranked in order. The class of an object is predicted according to the class of its k nearest neighbors, that is the origin of the name of the method. k assumes values ranging from 1 to a maximum k value (k max ), one less than the total number of objects in the training set, but as the size of k approaches the number of objects in the training set the comparisons are in fact made to far neighbors. In practice, one could try several values of k and use the one with the best error rate (Rencher, 2002).
 1
1
The process of classification is quite similar to polling because every k closest object gives one vote for its class. Then the object is assigned to the class with the most votes. This method is self-validating since each object in the training set is compared to the others but not with itself. Fig. 2 shows an example of the process of classification of an unknown object, identified by a plus sign. If k = 1, only the closest neighbor and its class are taken into account and the unknown object is assigned to this class. In this case the shortest distance (d 1 ) is associated to an object of the square class, consequently the unknown object also belongs to this category. But if k = 3, the method considers the three closest objects. Thus the unknown object is classified as belonging to the triangle class, because it receives two votes (d 2 and d 3 ) from the triangle class and only one vote (d 1 ) from the square class. In the specific case that there is a tie, the classification is based on the summed accumulated distances and the class with smallest accumulated distances is attributed to the object. This technique also can be used when the groups are not separated by a plane as occurs in Fig. 2. Perfect agreement between true and predicted class suggests a distinct separation of categories with respect to the variables under consideration. On the contrary, there may be overlap among classes or the presence of outliers or even objects of different categories close in distance.

Figure 2 k-NN process of classification of unknown object. An example for k=3, two classes and two variables.
Before k -NN algorithm is run, the elements had their true category (metal or nonmetal) assigned in the matrix in a column. The model built used auto scaled data and ten as k max . This activity can be easily reproduced with any software that performs k -NN analysis. Authors employed Pirouette package, version 4.5 (2011).
Results
The main purpose of this work is to employ the k -NN method to classify the representative elements as metal or nonmetal taking as variables periodic properties as stated before. So the results can be summarized in Table 2, which lists the prediction for the elements according to a certain k value. Column number corresponds to k setting so that the first column of this matrix holds the class for each element when only one neighbor (the nearest) is polled whereas the last column holds the class for the elements when 10 neighbors are polled.
Table 2 Classification of the representative elements according to k-NN method. C for correct and I for incorrect classification.

a Metalloid
The majority of elements received a correct classification for all 10-nearest neighbors, which is indicated by the letter C. However seven elements received a wrong classification, indicated by the letter I. Five nonmetals were classified as metals whereas two metals were classified as nonmetals for at least one k value. Silicon was misclassified for all ten values of k , tellurium, nine; boron and germanium, four; polonium, three; arsenic, two; and phosphorus only one. These elements are metalloids, except phosphorus. Table 3 presents the number of elements wrongly classified for each k value and the rate of error.
Table 3 Number of misclassifications and error rate for each k value.
| Class | Number of elements | Number of elements misclassified | |||||||||
|---|---|---|---|---|---|---|---|---|---|---|---|
| k 1 | k 2 | k 3 | k 4 | k 5 | k 6 | k 7 | k 8 | k 9 | k 10 | ||
| Metal | 22 | 2 | 2 | 0 | 0 | 0 | 0 | 1 | 0 | 2 | 0 |
| Nonmetal | 16 | 2 | 2 | 3 | 2 | 2 | 2 | 4 | 3 | 3 | 3 |
| % Error rate | 10.5 | 10.5 | 7.9 | 5.3 | 5.3 | 5.3 | 13.2 | 7.9 | 13.2 | 7.9 | |
As stated before, the separation between elements typically metallic from those nonmetallic as traditionally drawn by a simple line in the periodic table is something relative to the property under consideration. When we consider the periodic properties the distinction is not so rigid. Actually a perfect classification would only be possible if the elements in both classes had distinct range for these properties, that is, there should be no overlap in multidimensional space, but this is not the case here.
Fig. 3 is a line plot of the data in Table 1, which exhibits response values for the periodic properties. This plot shows that metals (blue lines) and nonmetals (red lines) are categories not perfectly distinguishable considering these variables individually because it is apparent that there are overlaps of values as we analyze minimum and maximum values for each property. The range for the properties can be better visualized in Table 4. The elements listed in the table are those that received a wrong classification and the values in the parenthesis are for the respective periodic property. Overlap for silicon is present in all four periodic properties. By the way this element was given an incorrect class when all 10-nearest neighbors were analyzed. Tellurium, boron germanium, polonium and arsenic showed overlap for three properties and phosphorus only two. This last element received only incorrect prediction for k = 3.

Figure 3 Line plot for the periodic properties. Overlap of lines for all periodic properties occurs and suggests no completely distinguishable range between metal and nonmetal.
Table 4 Ranges (minimum and maximum) for the periodic properties and the misclassified elements.

a Pauling scale
Variations in periodic properties are mainly a result of n principal quantum number and shielding and penetration effects. Shielding is the reduction of the true nuclear charge felt by an electron resulting from repulsion forces on this electron that are caused by the presence of other electrons. Penetration is the presence of an electron closer to the nuclear charge. Consequently this electron feels a stronger attraction by the nucleus. The typical trends in the periodic table are that atomic radius increases down a group and decrease across a period while ionization energy, electron affinity and electronegativity increase up a group and across a period.
However irregularities occur along the groups and across the periods and even within metals or nonmetals. For example the properties of elements in the second period usually differ significantly from those of other elements in their families, because second-period elements have no low-energy d orbitals. Going from groups 13 to 15, electrons are going singly into separate p orbitals, where they do not shield one another significantly. The general left-to-right increase in ionization energy for each period is interrupted by a dip between groups 2 and 13 because the 2p electrons are slightly higher in energy than the 2s electrons. The same dip is found between groups 15 and 16 but the explanation for this behavior is the fourth p electron in the group 16, which is paired with another electron in the same orbital, so it experiences greater repulsion than it would in an orbital by itself. This increased repulsion makes it easier to remove the p fourth electron in an outer shell for group 16 than the third p electron in an outer shell for group 15. The values of electron affinity usually become larger on moving across a period from left to right, but the trend is not smooth. The elements in groups 2 and 15 appear not to follow the general trend since the added electron would start a p subshell or would be paired with another electron in the p subshell, respectively (McMurry & Fay, 2003; Zumdahl & Zumdahl, 2007). As a numerical example involving irregularities we have the atomic radius for the nonmetal silicon (117 pm). This value is close to that for germanium (122 pm), a metal, but more distinct in size than that for carbon (77 pm), another nonmetal. The same irregularity occurs for electronegativity: silicon (1.90), germanium (2.00, metal) and carbon (2.60, nonmetal).
Besides the elements in groups 13 through 16 exhibit different classes within a column since the elements at the head of the group are nonmetals and those at the foot of the group are metals. For the elements in group 15 the change is so great that, with regard to monoatomic ions, elements at the top tend to form anions and those at the bottom tend to form cations. There are also allotropic variations in the sense that some elements exist as both metals and nonmetals. An example is group 15: nitrogen and phosphorus are nonmetals, but arsenic exists as nonmetal, metalloid, and metallic allotropes, and antimony and bismuth are metals. Elements in the p block typically form several allotropes (Atkins, Overton, Rourke, Weller, & Armstrong, 2010). All these aspects reinforce the presence of elements with intermediate characteristics between metals and nonmetals.
Conclusion
k -NN method of classification reveals that among all representative elements only seven elements received a wrong classification for at least one k value when 10-nearest neighbors are considered. Five nonmetals were classified as metals (boron, silicon, phosphorus, arsenic and tellurium) whereas two metals as nonmetals (germanium and polonium). Of course any classification of an element depends on the properties considered. In this work this classification took into account as properties the atomic radius, ionization energy, electron affinity and electronegativity. The reason for misclassifications lies in the irregularities in the periodic properties found along the groups and across the periods and even within metals or nonmetals. Consequently, the common division indicated by a "staircase" line that runs from the top of group 13 to the bottom of group 16 is really something relative to a certain point.

