


 nueva página del texto (beta)
 Inglés (pdf)
 Artículo en XML
 Referencias del artículo
 Enviar artículo por email
 Citado por SciELO
  Similares en
SciELO
Similares en
SciELO 
 Permalink
Introduction
Cocoa (Theobroma cacao L.) is a species native to the Amazon region of South America; its products are used worldwide for the chocolate, pharmaceutical and cosmetic industry (Wickramasuriya and Dunwell, 2018). The global market for cocoa beans is expected to grow at a compound annual growth rate of 7.3 % from 2019 to 2025 (Voora et al., 2019). World production in 2018 was led by Africa (71.1 %), followed by Latin America (16.1 %), Asia (11.9 %) and Oceania (1 %), with Ivory Coast being the main producing country (1,963,949 t). Colombia produced 52,743 tons in 2018, being the tenth world-producing country (FAO, 2020). Santander is the main producer state of Colombia (23,042 t per year), and it has a 38.06 % of Colombia planted area, followed by Antioquia (8.93 %), Arauca (8.32 %), Huila (7.97 %) and Tolima (7.58 %) (FEDECACAO, 2019).
Currently, there is a wide range of cocoa genotypes planted in Colombia. Clones TCS 01 (Theobroma Corpoica La Suiza), TCS 06, TCS 13, and TCS 19 are recommended by Agrosavia for the Mountain of Santander region (Agudelo et al., 2018; ICA, 2014;). These clones are being evaluated for other regions of Colombia, such as the Mountain of Antioquia, due to their high yield (clones TCS 01 and TCS 19), disease resistance (clone TCS 06) and high quality of the grain. In Colombia, cocoa cultivation predominates in agroforestry systems with other perennial woody species (FEDECACAO, 2020). The shade generated in these systems modifies the environmental conditions and benefits the physiology of the crop providing greater longevity and stability in cocoa production (Jagoret et al., 2018; Niether et al., 2018).
Ecophysiology studies the physiological mechanism and the interactions between plants and their physical, chemical and biotic environment (Lambers et al., 2008). Among these processes, the photosynthetic activity allows to know the behavior and performance of a species and its interaction with environmental conditions (Miguel et al., 2007) and to identify the behavior of the plant and its response to specific growth conditions (Rodrigo, 2007).
Niether et al. (2018) indicated that the reduction of radiation generated by forest trees improves environmental conditions for cocoa cultivation because cocoa has a low light saturation point. The 95% maximum photosynthesis occurs with photosynthetically active radiation of 200 μmol m-2 s-1 (Baligar et al., 2008). Cocoa photosynthesis is also sensitive to high vapor pressure deficit (VPD) (Köhler et al., 2014), CO2 assimilated decreases when leaf VPD is higher than 2kPa (Balasimha et al., 1991). Under agroforestry system values for photosynthesis rates (3 to 7 μmol CO2 m-2 s-1) and stomatal conductance (0.05 and 0.12 mol CO2 m-2 s-1) for cocoa trees are reported (Araque et al., 2012; Baligar et al., 2008; Jaimez et al., 2018; Mielke et al., 2005), while in transpiration rate (E), the values vary between 4 y 6 mmol H2O m-2 s-1 (Jaimez et al., 2018). This study aimed to evaluate the photosynthetic performance of five cocoa genotypes planted in the agroforestry system in the Colombian humid tropical forest.
Material and methods
Experimental site
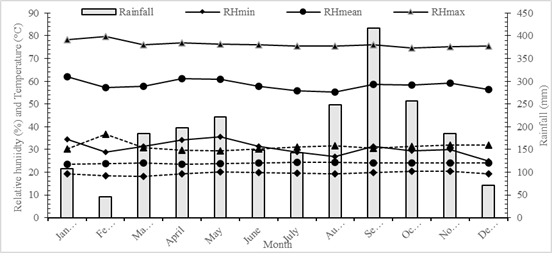
The study was conducted at the Research Center El Nus (Agrosavia), San Roque, Antioquia, Colombia (06° 26' 17.2'' N, 74° 49' 32.1'' W). The weather conditions in 2018 were an average minimum temperature of 18 ºC, an average maximum temperature of 36 °C, average relative humidity of 79 % and annual accumulated rainfall of the region of 2229 mm (Figure 1).
Plant material and experimental design
Five cocoa clones (TCS01, TCS06, TCS13, TCS19 and, CCN51) were evaluated under a complete randomized blocks experimental design with four replications; the experimental unit was a group of 20 plants per clone.
Plantation management
Cocoa trees were planted in December 2016 (3 years old) at a distance of 3 × 3 m following a triangle arrangement. The study was carried out in an agroforestry system with permanent trees of abarco (Cariniana pyriformis Miers). Agudelo-Castañeda et al. (2018) recognized abarco for its potential to regulate incident radiation with less variability; it was considered the forest species to generate a permanent shade on the canopy of cocoa trees. The abarco trees were planted in 2015 (4 years old). At the time of evaluation, they had an average height of 5.1 m and a diameter of 6.04 cm at 1.20 m from the soil surface. The trees were established in 16-m double rows at a distance of 4 × 4 m from each other in a triangle arrangement.
Variables measured
Leaf gas exchange measurements were carried out in September 2018 with a portable photosynthesis measuring system that incorporates an infrared gas analyzer (LCi-ADC Bioscience, Hertfordshire, UK). Measurements were performed on a young, fully expanded leaf of six plants from each cocoa clone for five consecutive days. Net photosynthesis (A, μmol CO2 m-2 s-1), transpiration (E, mmol H2O m2 s-1), stomatal conductance (gs, mol CO2 m-2 s-1) and photosynthetically active radiation (PAR, µmol photons m-2 s-1) were registered every hour from 08:00 to 17:00 hours. In addition, the A/E and A/PAR ratio, respectively, calculated the instantaneous water use efficiency (WUEi, mmol CO2 mmol-1 H2O) and radiation use efficiency.
Vapor pressure deficit (VPD, measured in kPa) was calculated from daily temperature and relative humidity records, according to Equation [1] proposed by Rosenberg et al. (1983). The temperature and humidity values were registered with a thermo-hygrometer (Thermo Hygro & Clock, VAPRECISION, Fountain Valley, California, USA) at 30-minute intervals during the day (8:00 to 17:00 hours).
An SS1 SunScan Canopy Analysis System (Delta-T Devices Ltd, Cambridge, UK) was used to measure the percentage of incident light intercepted by shade trees canopy. Incident radiation flux above the canopy, radiation flux transmitted below the shades tree canopy, extinction coefficient (k), and leaf area index (LAI) were also recorded every half hour, from 08:00 to 17:00.
Daily integral photosynthesis
To determinate the accumulated value throughout the day of the physiological variables A, gs, E and PAR, the area under the curve (AUC) was estimated for each gas exchange variable by fractioning the total into trapezoidal areas, and the individual areas were calculated using the trapezoid (Equation 2) through a macro of the statistical environment SAS® 9.4 using the analysis referenced by Córdoba et al. (2018), which was adapted from routines described by Huang and Xiao (2010) and Shiang (2004).
Where m i corresponds to the ith measurement, while t i is the ith time; therefore, the AUC is the sum of all the individual areas estimated (Equation 3).
Statistical analysis
Analysis of variance of the AUC was performed. The Tukey test separated treatments with statistical differences at P ≤ 0.05 probability. Both analyses were carried out “agricolae” package (Mendiburu, 2020) of the statistical environment (R Core Team, 2020).
Results and discussion
Light habitat and vapor pressure deficit
Abarco (Cariniana pyriformis Miers) generated a shade level between 9.93 and 20.3 % over cocoa canopy (Figure 2F). Under that condition, the environment temperature below the tree canopy and over cocoa canopy was between 23 and 31 °C and relative humidity was between 42 and 73 %; PAR was between 200 and 1000 μmol photons m-2 s-1 (Figure 2D). Increasing rates of net photosynthesis (A) have been reported as radiation (PAR) reaches photosynthetic photon flux densities (PPFD) between 300 and 750 μmol photons m-2 s-1 (Avila et al., 2016; Da Matta et al., 2001; Mielke et al., 2005). Likewise, as shown in Figure 3, the highest incident radiation was concentrated between 200 and 500 μmol photons m-2 s-1, near light saturation point for cocoa, which is close to 200 y 500 µmol photons m-2 s-1, where plants reach 95 % of the maximum photosynthetic activity. Values close to 1000 μmol photons m-2 s-1 tend to reduce net photosynthesis. As explained by Baligar et al. (2008), the photosynthetic speed decreases if the photosynthetic apparatus is exposed to PPFD higher than 1800 μmol m-2 s-1; thus, the exposure affects the photosynthetic apparatus of the cocoa leaf (Raja Harun and Hardwick, 1988; cited by Almeida and Valle 2007).
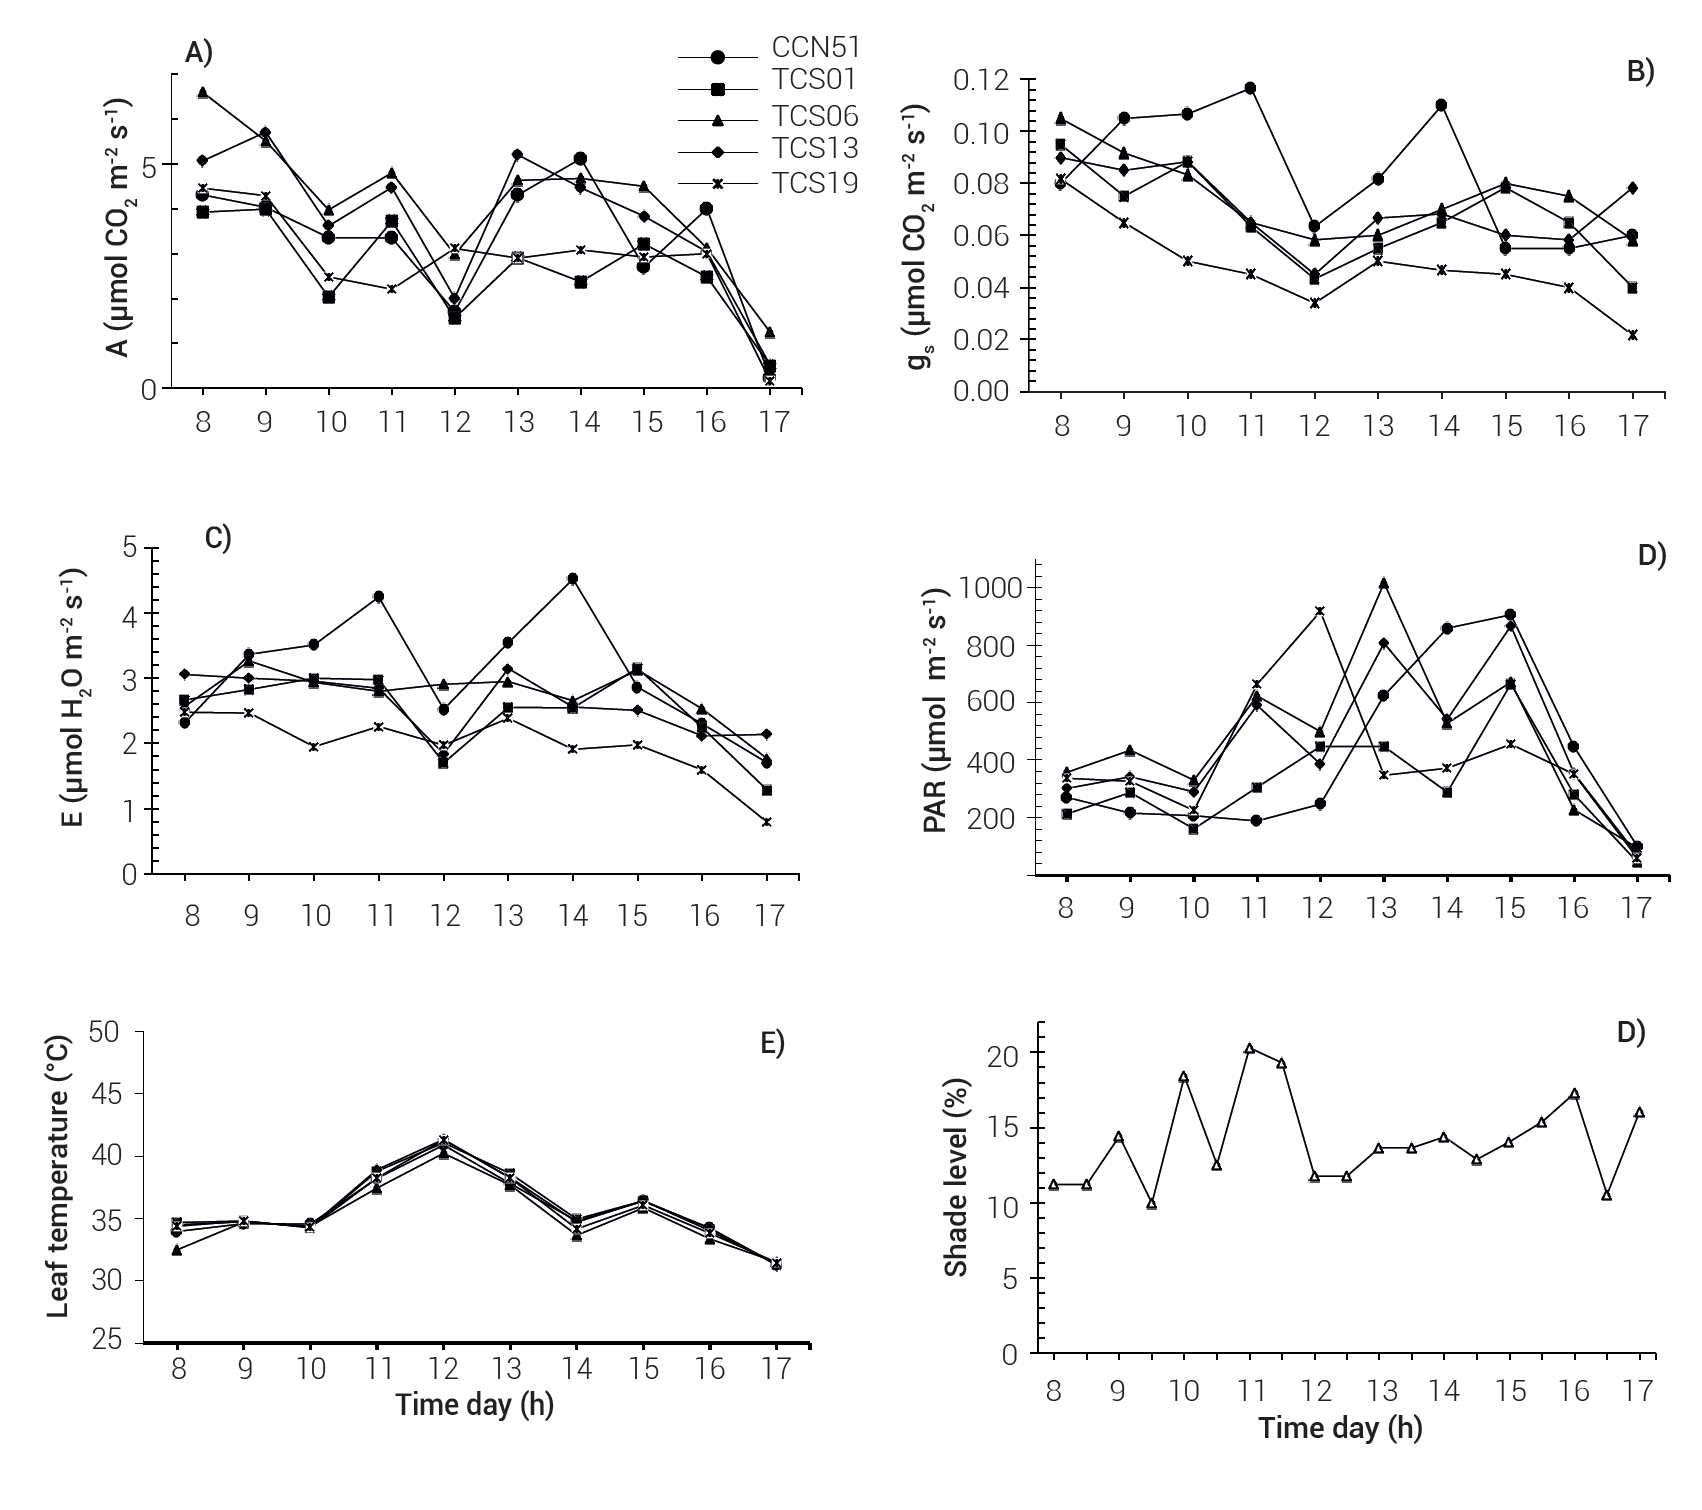
Figure 2 Diurnal variation of gas exchange parameters of five cocoa clones. A) net photosynthesis, B) stomatal conductance, C) transpiration, D) photosynthetically active radiation, E) leaf temperature, F) shade level at the top of Theobroma cacao trees.

Figure 3 Net photosynthetic rate (A) and Photosynthetic Photon Flux Density (PPFD) relation of five Theobroma cacao clones planted in an agroforestry system.
According to Agudelo-Castañeda et al. (2018), abarco, as a forest species of the system, has been recognized for its potential to regulate incident radiation with less variability. It allows cocoa plants to achieve higher rates of photosynthesis (5.39 μmoles CO2 m-2 s-1) because this species has the lowest percentage of natural leaf removal in the dry season. The aforementioned allows maintaining radiation levels suitable for cocoa cultivation throughout the year, compared to other species such as teak (Tectona grandis L. f.- Verbenaceae) and rubber (Hevea brasiliensis (Willd. ex A. Juss.) Müll Arg. - Euphorbiaceae).
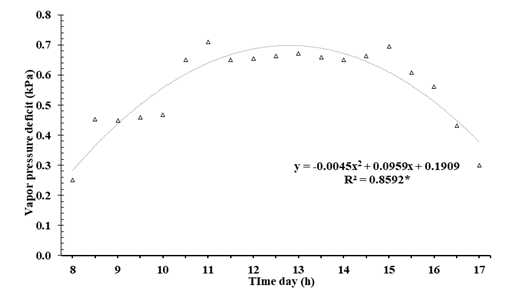
The VDP reached the lowest values in the arly hours of the day (0.25 to 0.45 kPa) and in the late afternoon (0.43 to 0.3 kPa), while the highest VDP values (0.71 kPa) were registered when the temperature reached 30 °C and a relative humidity of 40 % (Figure 4). Mielke et al. (2005) indicated that high VPD values could induce stomatal closure and limit the entry and diffusion of CO2; thus, the highest VPD near noon can explain the stomatal closure between 11:00 and 14:00 hours and, consequently, the decrease in photosynthetic activity. Similar results were found by Almeida et al. (2014), who stated that the reduction in CO2 assimilation is associated with the stomatal closure by increasing VPD.
Gas exchange
All cocoa clones, except for CCN51, reached their highest photosynthetic capacity between 08:00 and 09:00 hours, showing a maximum A of 6.6 μmol CO2 m-2 s-1 (TCS06), 5.72 μmol CO2 m-2 s-1 (TCS13), 4.46 μmol CO2 m-2 s-1 (TCS19) and 3.99 μmol CO2 m-2 s-1 (TCS01), while at noon, a reduction in photosynthetic activity was observed to rates of 2.98 μmol CO2 m-2 s-1 (TCS06), 2.01 μmol CO2 m-2 s-1 (TCS13), 3.12 μmol CO2 m-2 s-1 (TCS19) and 1.57 μmol CO2 m-2 s-1 (TCS01); after this decreasing, clone TSC19 was the only one that remained constant in the rate of CO2 fixation with values close to 3.12 μmol CO2 m-2 s-1 in the afternoon, unlike clones TCS13 and CCN51, which for the afternoon showed an increase of A, reaching values of 5.20 and 5.12 μmol CO2 m-2 s-1, respectively (Figure 2A).
In general, the photosynthetic rates observed in this study were between 3.0 and 8.8 μmol CO2 m-2 s-1, similar to those reported by several authors (Almeida et al., 2014; Araque et al., 2012; Jaimez et al., 2018; Mielke et al., 2005; Ribeiro et al., 2016;). Cocoa has a relatively low net assimilation rate (A) compared to other crops (Alvim, 1977). Cocoa A coincides with those reported for C3 plants, as the case of coffee (Coffe arabica), with low values of A (3 to 12 μmol CO2 m-2 s-1) and lower than C4 plants, as maize (Zea mays L.), with A values of 60 to 90 μmol CO2 m-2 s-1 (Polanía et al., 1982).
According to Agudelo et al. (2018), clones TSC19 and TCS13 showed the highest photosynthetic rate (4.8 and 4.36 μmoles CO2 m-2 s-1, respectively) between 08:00 and 12:00 hours, compared to other regional clones, such as ICS95. In this study, clones TCS13 and TCS06 stood out by their photosynthetic performance. Regarding gs and E, a reduction towards noon was observed, similar to the A trend (Figure 2B and 2C). The gs values ranged from 0.03 (TCS19) to 0.06 mol CO2 m-2 s-1 (TCS06 and CCN51). In terms of E, values of 1.70 (TCS01) to 2.91 mmol H2O m-2 s-1 (TCS06) were recorded, coinciding with the time when the highest leaf temperature occurred (41 °C) (Figure 2E).
Throughout the day, clone CCN51 stood out for presenting the highest values of gs at 11:00 and 14:00 hours (0.12 and 0.11 mol CO2 m-2 s-1, respectively) and, consequently, higher E (4.25 and 4.52 mmol H2O m-2 s-1, respectively); however, clone CCSN51 did not show the highest photosynthetic activity. Several gs are reported, ranging from 0.02 to 0.14 mol CO2 m-2 s-1 (Araque et al., 2012; Baligar et al., 2008; De Almeida et al., 2016; Jaimez et al., 2018; Mielke et al., 2005), while transpiration ranged between 0.39 and 6.0 mmol H2O m-2 s-1. Mielke et al. (2005), Baligar et al. (2008), Almeida et al. (2014) and Jaimez et al. (2018) found a direct relationship between the values of gs and A, the greater the conductance, the greater photosynthesis (gs 0.03 mol CO2 m-2 s-1 / A 4 μmoles CO2 m-2 s-1 and gs 0.13 mol CO2 m-2 s-1 / A 8.5 μmoles CO2 m-2 s-1). On the other hand, Araque et al. (2012) found that variation in the parameters A, gs, and E was related to the moisture regime; all cultivars exhibited a 60 % reduction in gs with drought, with a 73 % decrease in A and E; meanwhile, De Almeida et al. (2016) reported a positive relationship between the values of gs and A, but in turn, these were influenced by different water levels.
Jaimez et al. (2018) showed that gs, unlike E, is influenced by PAR variation, and that high values of gs resulted in a greater CO2 availability for carboxylation by Rubisco during the Calvin cycle; in contrast, Baligar et al. (2008) indicated that the main factor influencing E is VPD, presenting a direct relationship between both parameters.
The daily integral of gas exchange (Area under the curve-AUC)
There were variaritions for cocoa clones (P ≤ 0.01) in the daily integral of A, gs, and E. The highest values of these parameters were found in clones TCS06, TCS13 and CCN51, while the lowest ones were found in clone TCS19. Clone TCS06 presented 137,300 µmol CO2 m-2 day-1, corresponding to a variation of 44 and 40 % more CO2 fixed than clones TCS19 and TCS01, respectively. A similar behavior was observed for E; clone CCN51 showed significantly (P = 0.00299) more stomatal conductance and transpiration rates than clone TCS19, reaching values of 108,300 mmol H2O m-2 day-1 compared to 66,730 mmol H2O m-2 day-1 in TCS19. Regarding gs, clone TCS19 showed the lowest value (1484 mol CO2 m-2 day-1), which was significantly different for the stomatal conductance reached by the remaining four clones. Regarding the efficiency of the use of water and radiation, the clones did not differ significantly (P > 0.05) (Table 1). Agudelo et al. (2018) reported that clone TCS13 achieved a greater efficient use of water (2.8 μmol CO2 mmol-1 H2O) compared to clones like ICS95, which coincides with what was found in this study, where the clone TCS13 reached the highest values in WUE (1.6 μmol CO2 mmol-1 H2O).
Table 1 The daily integral of net photosynthetic rate (A), transpiration rate (E), stomatal conductance (gs), water use efficiency (WUE), and radiation use efficiency (RUE) measured in leaves of five Theobroma cacao clones planted in an agroforestry system.
| Parameter | Clones | p Value | |||||||||
| TCS19 | TCS06 | CCN51 | TCS13 | TCS01 | |||||||
| A (µmol CO2 m-2 day-1) | 94,820 | b | 137,300 | a | 111,100 | ab | 126,600 | ab | 97,990 | b | 0.00507** |
| E (mmol H2O m-2 day-1) | 66,730 | b | 92,920 | ab | 108,300 | a | 81,330 | ab | 91200 | ab | 0.00299** |
| gs (mol CO2 m-2 day-1) | 1,488 | b | 2,394 | a | 2,748 | a | 2,235 | a | 2398 | a | 0.00186** |
| PAR (µmol photons m2 day-1) | 13,880 | b | 20,530 | a | 13,960 | b | 1,5710 | b | 12860 | b | 0.0177* |
| WUE (A/E) | 1.418 | a | 1.472 | a | 1.072 | a | 1.615 | a | 1.133 | a | 0.0354* |
| RUE (A/PAR) | 0.0075 | a | 0.0067 | a | 0.0087 | a | 0.0082 | a | 0.0080 | a | 0.395ns |
Means followed by the same letter in the rows are not significantly different (Tukey, P ≤ 0.05) *: P ≤ 0.05, **: P ≤ 0.01.
Regarding the selection of forest species used as shade for cocoa trees, it is necessary to consider the climatic, edaphic, and environmental requirements and some morphophysiological characteristics that affect the percentage and durability of the shade on the cocoa canopy; among them, the foliar density and the longevity of the leaves (Chavarría, 2013).
Agudelo-Castañeda et al. (2018) stated that trees used in agroforestry systems influence the ecophysiological behavior of cocoa clones, mainly in photosynthesis rates. Abarco has greater benefits, especially in wet and dry seasons, which allows maintaining the physiological activity of cocoa throughout the year; thus abarco is a recommended tree for the studied region, which has two rainy seasons (March-June and September-November) and two periods of less precipitation (December-February and July-August). In this sense, cocoa-producing areas with high radiation intensity and water-deficient seasons, abarco can be helpful in agroforestry arrangements with cocoa; however, in the cocoa-producing areas with high cloudiness and periods without water deficit, abarco can be a forest alternative. Greater spacing between forest components should be considered to guarantee adequate shade and radiation availability to carry out photosynthesis. Similarly, the cocoa-abarco spacing arrangement needs to consider the light requirements of the cocoa genetic material to be used. As observed in this study, clone CCN51 requires more radiation to achieve high photosynthetic rates, unlike clones TCS 01, TCS 06 and TCS 19, which achieved higher values of fixed carbon at lower radiation.
Conclusions
Clone TCS06 presented the highest photosynthesis as a function of the daily integral of the gas exchange compared to TCS19 and TCS13. Vapor pressure deficit (VPD) regulates gas exchange behavior in terms of gs and E. The most stable material in stomatal conductance, with variations in VPD, was TCS06 compared to clone TCS19. Clone CCN51 requires higher photosynthetically active radiation (PAR) to achieve maximum photosynthetic activity, unlike that observed in other TCS clones, where its performance is obtained with lower PAR values.

