


 nueva página del texto (beta)
 Inglés (pdf)
 Artículo en XML
 Referencias del artículo
 Enviar artículo por email
 Citado por SciELO
  Similares en
SciELO
Similares en
SciELO 
 Permalink
Introduction
Allometric equations are essential tools for estimating forest biomass and carbon stocks in forests (Tashi et al., 2017). These estimates make it possible to evaluate the impact of forests on climate change mitigation (Ngoma et al., 2018) and, henceforth, to support the adoption of environmental mechanisms and policies (Agrawal et al., 2011). These type of equations generally express the relationships between tree biomass and the diameter at breast height (DBH), tree height or any other easy-to-measure dendrometric variables in forest inventories (Fonseca et al., 2009; Henry et al., 2013; Ketterings et al., 2001; Picard et al., 2015; Razakamanarivo et al., 2012).
Ideally, ad hoc allometric equations should be used for local conditions and species in order to minimize prediction errors (Watzlawick et al., 2001; Zapata-Cuartas et al., 2012). According to Cole and Ewel (2006), application of generic equations to specific sites or species frequently results in uncertain estimations. Analogously, Chave et al. (2014) and Koala et al. (2017) agree that the use of species-specific equations gives rise to lower uncertainties.
Globally, multiple equations for aboveground biomass prediction have been developed by well-established methods; whereas, few belowground biomass equations have been established (Cairns et al., 1997; Razakamanarivo et al., 2012). The belowground component of trees is the least studied one, due to the methodological difficulties, that result in slow and expensive processes (Brown, 1997; Návar, 2015). Moreover, there is no agreement on accurate methods to be used for such a challenge (Addo-Danso et al., 2016; Brown, 2002; Gárate and Blanco, 2013).
Nevertheless, belowground biomass is an important carbon pool that should be included in the local, regional and global carbon estimations (Varik et al., 2013), since it may represent up to 40 % of green biomass in conifer forests (Litton et al., 2003). Accordingly, in order to contribute information on belowground biomass, this study aimed to develop allometric equations for estimating belowground biomass and carbon content, both at the whole-tree level and at the individual-root level, for Pinus patula, which is an important tree species from the ecological and economic viewpoints.
Materials and methods
Study area
The present study was carried out at the municipalities of Huayacocotla, Veracruz; Acaxochitlán, Hidalgo; Zacualtipan, Hidalgo; Chignahuapan, Puebla; and Zacatlan, Puebla, Mexico, between the coordinates 19° 46’ 05”-20° 37’ 8.7” N and 98° 00’ 21.9”-98° 36’ 29.3” W. The mean elevation of the sampled sites varied from 2055 to 2600 masl. Pinus patula Schiede ex Schldl. et Cham. is a species native to Mexico, it grows from 17 to 24º latitude N (Perry, 1991; Vela, 1980). Hidalgo, Puebla and Veracruz are the states where the most abundant populations are found. According to Vela (1980), the lowest temperatures along the Pinus patula natural distribution area occur during the months of December or January. The highest temperatures take place in May. Minimum temperatures vary from 0.9 to 7.9 °C and the highest ones fluctuate from 20.3 to 27.2 °C. Sites where P. patula grows are moist and have good drainage, with annual precipitation varying from 1000 to 1500 mm. P. patula grows in pure stands or it may associate with P. greggii Engelm., P. maximinoi H. E. Moore, P. pseudostrobus Lindl., P. teocote Schiede. ex Schltdl. et Cham., P. leiophylla Schiede ex Schltdl. et Cham., P. patula Schiede ex Schltdl. et Cham. var. longipedunculata Loock ex Martinez, Abies religiosa (Kunth) Schltdl. et Cham., P. montezumae Lamb., P. ayacahuite Ehrenb. ex Schltdl. var. veitchii (Roezl) Shaw, and Quercus spp. (Perry, 1991). Soils vary from moderately to very deep, with loamy texture in the shallow horizons and clayey texture in the deepest horizons (Vela, 1980).
Sampling procedure
The study aimed to develop two groups of allometric equations: 1) tree-level belowground biomass equations, and 2) individual-root level biomass equations. In both cases, a destructive sampling of trees was used, which consisted of extracting the roots from selected healthy trees, with a single straight stem. Trees were dominant in their populations and were strategically located throughout the species natural distribution area, in order to assure their representativeness. Root extraction was conducted from June 2016 to September 2017.
For the first group of equations, seven P. patula trees were selected in the following sites: two trees at Huayacocotla, Veracruz; two trees at Chignahuapan, Puebla; one tree at Zacatlán, Puebla; one tree at Acaxochitlán, Hidalgo and one tree at Zacualtipan, Hidalgo. The DBH ranged from 1.5 to 57.0 cm. Due to the high degree of difficulty and the high costs involved in root extraction, it was only carried out in this number of trees, which is intended to represent the entire main natural distribution area of this species, and also the most common range of tree dimensions. There are no reports on belowground biomass equations for large P. patula trees, that is why large trees were included, despite selecting a small sample size. In other studies, successful belowground allometric equations for small trees have been developed by using sample sizes similar or even lower than the one used in this study (Xiao et al., 2003; Xiao and Ceulemans, 2004), or by using two or three trees per diameter class (Rathore et al., 2018).
To develop the individual-root set group of equations, 11 trees were selected, from which 66 roots with basal diameter (RBD) ranging from 6.82 to 155.0 cm were extracted. Some of the roots came from the aforementioned seven trees, but many other roots were extracted from independent trees also located in the mentioned localities, in order to assure a wide morphological variability of the roots.
Dasometric variables measured
Variables measured on each of the standing trees were: 1) DBH in cm; this variable was measured on standing trees at a height of 1.3 m above ground level by using a diameter tape; 2) crown diameter (CD) in m, this variable was measured by using a metric tape; 3) after felling off the tree, its total height in m was determined with a metric tape. As for the individual roots, the RBD as well as the total root length (RL; cm) were measured in the field, after extracting the whole root; for large roots (RBD > 5 cm) the RBD was measured by using a diameter tape; for small roots (RBD ≤ 5 cm) a caliper was used.
Belowground biomass and carbon content
To determine the root biomass, each of the seven selected trees were felled; then, with conventional agricultural and gardening tools (shovels, picks, hoes, trowels, etc.), the coarse roots around the tree trunk were identified and marked. Thereafter, excavation along each individual root was continued, until exposing the whole root, including both the coarse and the fine components. In this process, when a root portion, whatever the order it was, got accidentally excised, it was recollected, and the excision point labeled for later integration. By using this procedure, the totality of the tree roots, including the tap root was extracted. Regarding individual-root biomass, from each of the 11 selected trees one or several roots were exposed and extracted by following the procedure explained before.
In laboratory, roots were cleaned and classified as primary, secondary and tertiary or higher order roots (Atkinson, 2000); moreover, each of these groups were reclassified into coarse (root diameter > 2 mm) or fine roots (root diameter ≤ 2 mm) (IPCC, 2006). Each group was placed into perfectly labeled paper bags that were introduced into a forced-air oven (Sheldon Model 1675-S®, Cornelius, Oregon, USA) calibrated to 70 °C. Sample bags containing the biggest pieces of root wood were weighted daily and all the bags were taken out the oven when weight of sample materials became constant. Thereafter, the bags were weighted by using an OHAUS scale 2 kg in capacity and 1 g in precision (OHAUS Corp., Parsippany, New Jersey, USA). The classification process gave rise to the following root components: 1) tap root (TaR), is the root originating from the tree root collar, generally goes down into deep soil horizons; this root gives rise to the lateral roots; 2) primary roots (PR), come directly from the tap root; 3) secondary roots (SR), emerging from the primary roots; 4) tertiary roots (TR), emerge from the secondary roots; 5) coarse roots (CR), include all-order roots with diameter ≥ 2 mm; 6) fine roots (FR), include all-order roots with diameter < 2 mm; 7) coarse primary roots (CPR); 8) fine primary roots (FPR); 9) coarse secondary roots (CSR); 10) fine secondary roots (FSR); 11) coarse tertiary roots (CTR), and 12) fine tertiary roots (FTR).
The belowground carbon content of the seven-sample trees was determined by multiplying the total belowground biomass of each of the trees by the average carbon concentration for Pinus patula reported by Diaz-Franco et al. (2007).
Aboveground biomass
Aboveground biomass, that is, the biomass of stems, branches and foliage of the seven trees processed was quantified by using the method that, according to the size of the trees, would optimize time and cost, as well as precision of the estimates. In the case of small trees (DBH < 10 cm), after splitting the aboveground components, all the biomass was processed (dried) in laboratory. Aboveground biomass of the 16.4 cm DBH tree was determined by sampling using the dry weight/fresh weight ratio. First, the fresh weight of each of the structural components was obtained with an OHAUS® AS-100 scale 100 kg in capacity and 100 g in precision (OHAUS Corp., Parsippany, New Jersey, USA). The fresh weight of 9 to 12 random samples per component was also recorded. The samples were subsequently dried in laboratory in a Sheldon Model 1675-S® forced air-circulation oven at 70 ºC until constant weight. Once both weights were obtained, the moisture content of the sampling units was determined (Equation 1; Flores-Nieves et al., 2011) and then, the dry weight of components was computed by applying Equation 2. Finally, the total aboveground biomass of the tree was estimated by integrating the biomass of the several structural components (Domínguez-Cabrera et al., 2009). The aboveground biomass of the structural components of trees with DBH higher than 25.5 cm was estimated by the allometric equations reported by Castellanos et al. (1996) for P. patula.
where MCs is the moisture content of the sampling unit (%), fws is the fresh weight of the sampling unit (kg), dws is the dry weight of the sampling unit (kg), DWc is the dry weight of the tree component (kg), FWc is the fresh weight of the tree component (kg) and MCm is the mean moisture content of the component sample (%).
After obtaining the total below and aboveground biomass in the seven harvested trees, the root/shoot ratio was determined, as well as the proportion of the below and aboveground biomass in relation to the total biomass. Table 1 summarizes the variables measured for each observation.
Table 1 Summary of the variables measured in the Pinus patula sampled trees.
| Tree | DBH (cm) | H (m) | CD (m) | Belowground biomass (kg) | Aboveground biomass (kg) | Total biomass (kg) | Belowground carbon content (kg) | R | B/T (%) | A/T (%) |
| 1 | 1.5 | 2.5 | 1.2 | 0.05 | 0.39 | 0.44 | 0.03 | 0.13 | 12.1 | 88.0 |
| 2 | 9.0 | 9.8 | 2.7 | 3.19 | 16.20 | 19.38 | 1.60 | 0.20 | 16.4 | 83.6 |
| 3 | 16.4 | 21.8 | 2.5 | 13.13 | 85.23 | 98.37 | 6.61 | 0.15 | 13.4 | 86.7 |
| 4 | 25.5 | 16.6 | 6.4 | 61.12 | 247.70 | 308.81 | 30.75 | 0.25 | 19.8 | 80.2 |
| 5 | 35.5 | 20.7 | 9.3 | 111.39 | 528.33 | 639.72 | 56.04 | 0.21 | 17.4 | 82.6 |
| 6 | 46.7 | 20.6 | - - | 196.41 | 990.43 | 1186.84 | 98.81 | 0.20 | 16.6 | 83.5 |
| 7 | 57.0 | 32.5 | 8.0 | 420.66 | 1564.29 | 1984.95 | 211.63 | 0.27 | 21.2 | 78.8 |
| Mean | 27.4 | 17.8 | 4.3 | 115.14 | 490.37 | 605.50 | 57.92 | 0.20 | 16.7 | 83.3 |
DBH: diameter at breast height, H: total height, CD: crown diameter, R: root/shoot ratio, B/T: belowground biomass/total biomass ratio, A/T: aboveground biomass/total biomass ratio.
The RBD for the 66 individual roots ranged from 6.8 to 155.0 mm and length varied from 60 to 2173 cm. Total root biomass (ToRB) displayed the highest variation (s = 3967.8 g), followed by CR (s = 3956.9 g). Only five out of 66 roots extracted had fine primary roots, indicating that this type of roots is infrequent in P. patula trees (Table 2).
Table 2 Descriptive statistics of individual roots by components.
| Variable | N | Minimum | Mean | Maximum | SD |
| RBD (mm) | 66 | 6.82 | 62.70 | 155 | 38.20 |
| RL (cm) | 64 | 60.00 | 469.49 | 2173 | 403.04 |
| ToR (g) | 66 | 12.16 | 3194.62 | 18152 | 3967.83 |
| PR (g) | 60 | 7.30 | 2255.63 | 14769 | 2786.67 |
| SR (g) | 59 | 3.00 | 931.23 | 8116 | 1458.14 |
| TR (g) | 58 | 0.20 | 248.96 | 2468 | 453.83 |
| CR (g) | 66 | 10.31 | 3173.84 | 18090 | 3956.92 |
| FR (g) | 65 | 0.94 | 21.10 | 116 | 20.86 |
| CPR (g) | 60 | 7.30 | 2255.47 | 14769 | 2786.78 |
| FPR (g) | 5 | 0.33 | 1.87 | 3 | 1.19 |
| CSR (g) | 59 | 2.00 | 926.85 | 8113 | 1458.53 |
| FSR (g) | 49 | 1.00 | 5.28 | 19 | 4.40 |
| CTR (g) | 48 | 0.16 | 279.57 | 2411 | 469.21 |
| FTR (g) | 58 | 0.20 | 17.59 | 110 | 19.12343 |
N: number of roots, SD: standard deviation, RBD: root basal diameter, RL: total root length, ToR: total root biomass, PR: primary roots, SR: secondary roots, TR: tertiary roots, CR: coarse roots, FR: fine roots, CPR: coarse primary roots, FPR: fine primary roots, CSR: coarse secondary roots, FSR: fine secondary roots, CTR: coarse tertiary roots, FTR: fine tertiary roots.
Statistical analysis
The data obtained from belowground biomass, belowground carbon content, and the dasometric variables measured on the seven sampled trees, allowed to test models that are frequently used for tree allometry. The independent variables H, CD and DBH were tested one by one. The DBH showed the highest association with the dependent variable (belowground biomass). In the scatter plot of the observed values of belowground biomass for P. patula (Figure 1) with respect to DBH, a potential relationship was determined. Fonseca et al. (2009) suggested that DBH is the variable most strongly associated with biomass.

Figure 1 Dispersion of values and trend line for belowground biomass in relation to diameter at breast height (DBH).
The models that more appropriately described the dispersion of data were selected, trying those models that were simple and more frequently cited in the relevant literature on the subject (Table 3). Based on those models, allometric equations were developed for the prediction of total and by- component belowground biomass and the corresponding carbon content at the tree level, as a function of DBH and H or simply DBH as the independent variable. On the other hand, biomass data for individual roots fitted better to model 3 (Table 3). The allometric equations to estimate total and by-component biomass of individual roots, used only RBD as the independent variable. Also, as a function of this variable, a special equation for the tap root and its components was developed, since such tree structure exhibits a particular morphometry.
Table 3 Models selected to estimate belowground biomass and carbon content of Pinus patula.
| Model | Equation | Author |
| 1 | y =β 0 DBH β1 H β2 | Schumacher and Hall (1933) |
| 2 | y =β 0 DBH β1 | Ter-Mikaelian and Korzukhin (1997) |
| 3 | ln (y) = ln (β 0 ) + β 1 ln (RBD) | Baskerville (1972) |
y: belowground biomass or belowground biomass component (kg), DBH: diameter at breast height (cm), H: tree total height (m), RBD: root basal diameter (mm) β 0 , β 1 , and β 2 : parameters to be estimated, ln: natural logarithm.
Model fitting was carried out by linear and nonlinear regression using the MODEL and REG procedures of the Statistical Analysis System (SAS) version 9.4 for Windows (SAS Institute, 2011). The parameters used to evaluate model goodness of fit was the adjusted R2, which provides the variability of the dependent variables explained by the model, considering the number of parameters, the root mean square error (RMSE) and the Akaike’s Information Criterion (AIC), which is frequently used for comparisons between models (Akaike, 1974; Picard et al., 2012). The relative error was calculated using Equation 3 (Djomo et al., 2010). In the case of individual root models, the goodness of fit was evaluated based on the coefficient of determination (R2) and RMSE.
where RE is the relative error (%), Pi is the predicted biomass for the i th tree (kg), Mi is the observed biomass for the i th tree (kg).
Results and discussion
Tree-level belowground biomass and carbon content equations
One- and two-input models were used in this study; that is, the regression equations produced for belowground and carbon content biomass estimation tree-level used DBH and H as independent variables, in order to take advantage of the contribution of H. In both cases, according to the evaluation statistics (RMSE, AIC, RE and adjusted R2), model 1, which included H as an additional independent variable, resulted in lower values for RMSE, AIC and RE, and higher adjusted R2 (0.99). In contrast, the adjusted R2 for model 2 was 0.98 (Table 4; Table 5). Model 1 tended to overestimate belowground biomass (RE = 6.1 %), while model 2 underestimated it (RE = -28 %; Table 4). Similar results were obtained for carbon content, with mean relative errors of 4.9 and -32 %, respectively (Table 5). The mean relative error is considerably lower in both estimations when model 1, which included DBH and H as independent variables, was used. Djomo et al. (2010) reported contrasting results for aboveground biomass estimations since they got a mean relative error of 7.4 % when used DBH only as the independent variable; however, when they added tree height or wood density as independent variables, the estimations did not improve significantly.
Table 4 Model parameters and statistics of goodness of fit to estimate total belowground biomass for Pinus patula.
| Model | Estimated parameters | SE | Pr > |t| | adj-R2 | AIC | RMSE (kg) | RE (%) | |
| 1 | β 0 | 0.0074 | 0.0035 | 0.0979 | 0.99 | 33.87 | 8.40 | 6.1 |
| β 1 | 2.0780 | 0.2061 | 0.0005 | |||||
| β 2 | 0.7294 | 0.1623 | 0.0109 | |||||
| 2 | β 0 | 0.0023 | 0.0027 | 0.4212 | 0.98 | 44.53 | 18.55 | -28.0 |
| β 1 | 2.9883 | 0.2872 | 0.0001 | |||||
SE: standard error, adj-R2: adjusted coefficient of determination, AIC: Akaike’s information criterion, RMSE: root mean square error, RE: relative error.
Table 5 Model parameters and statistics of goodness of fit to estimate belowground carbon content for Pinus patula.
| Model | Estimated parameters | SE | Pr > |t| | adj-R2 | AIC | RMSE (kg) | RE (%) | |
| 1 | β 0 | 0.0037 | 0.0017 | 0.0979 | 0.99 | 24.25 | 4.22 | 4.9 |
| β 1 | 2.0780 | 0.2061 | 0.0005 | |||||
| β 2 | 0.7294 | 0.1623 | 0.0109 | |||||
| 2 | β 0 | 0.0011 | 0.0013 | 0.4214 | 0.98 | 34.91 | 9.33 | -32.0 |
| β 1 | 2.9888 | 0.2873 | 0.0001 | |||||
SE: standard error, adj-R2: adjusted coefficient of determination, AIC: Akaike’s Information Criterion, RMSE: root mean square error, RE: relative error.
Nam et al. (2016) pointed out that allometric models should not only be precise, but also as simple as possible. Besides of being an easy to measure variable, DBH is preferred as an independent variable because of the lower uncertainty it brings about as compared to tree height, which is a hard-to-measure variable (López, 2005). Peichl and Arain (2007) suggested that DBH as an independent variable is sufficient to precisely estimate above- and belowground biomass; however, it is important to consider the error of estimations. In this study, even though model 2 (which included only DBH as the independent variable) showed an appropriate fitting to data, model 1 (whose independent variables are DBH and H) resulted in significantly lower relative error.
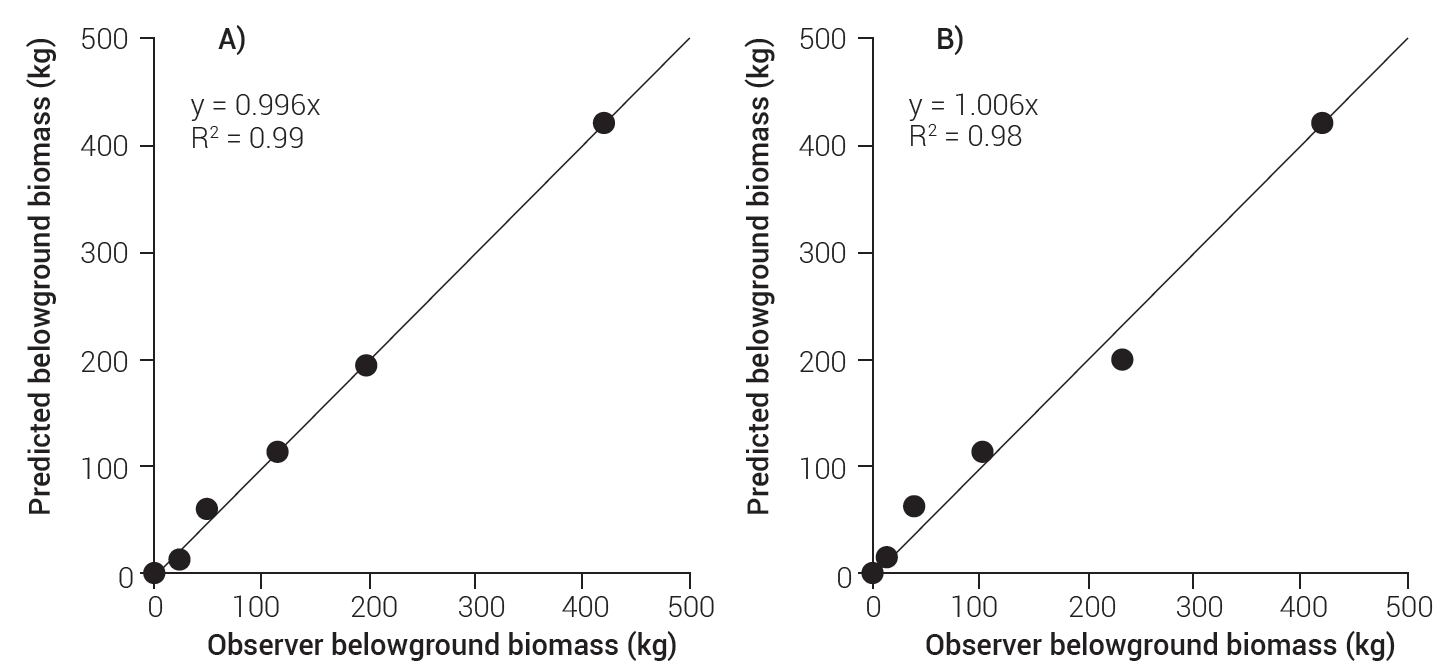
When the belowground biomass, estimated with models 1 and 2, was plotted against the observed belowground biomass, the values looked quite close to the regression line, which suggests a good fit in both cases. Similarly, slopes and determination coefficients for the linear regression were nearly 1 (R2 = 0.99 for model 1 and R2 = 0.98 for model 2). According to Figure 2, model 1 makes better predictions of total biomass than model 2.
Tree-level belowground biomass equations by components
In general, biomass of the most abundand root components, CPR and FTR, is more closely linked to DBH, while that of the least frequent components, FPR and FSR, exhibits the lowest dependance to DBH. For model 2, R2 values were 0.95 and 0.86 for CTR and FTR, respectivelly, while for the same components the adjustment parameters of model 1 were significant with higher determination coefficients that reached 0.99 (Table 6). Correlations between FR and DBH or H were too low, probably because quantification of FR included biomass of the fine primary roots, a variable that showed extremely small values, regardless of tree size. Perhaps an increase in the sample size (addition of sampled trees) could allow an improved model fitting. It was not possible to generate models for FR and FPR (Table 5). When fitting preliminary models, Mugasha et al. (2013) and Liepins et al. (2018) recommend to try little improvements in model fitting. This seems to be the case of this study, since it shows that model 1 when adjustment was possible, resulted in R2 values higher than 0.90. The use of DBH alone as the independent variable is likely to be sufficient to explain the variation of the root biomass components, except for FSR and components including tertiary roots; in those cases, only the use of both independent variables allowed to parametrize the models or to improve model fitting.
Table 6 Model parameters and goodness of fit statistics to estimate the belowground biomass per component at the tree level.
| Component | Model | Estimated parameters | SE | Pr > |t| | adj-R2 | RMSE (kg) | |
| TaR (kg) | 2 | β0 | 0.00018 | 0.0002 | 0.4369 | 0.98 | 6.48 |
| β1 | 3.38595 | 0.2970 | < 0.0001 | ||||
| PR (kg) | 2 | β0 | 0.00099 | 0.0027 | 0.7308 | 0.91 | 18.84 |
| β1 | 2.98429 | 0.6913 | 0.0076 | ||||
| SR (kg) | 2 | β0 | 0.00774 | 0.0066 | 0.2925 | 0.98 | 2.91 |
| β1 | 2.21286 | 0.2158 | 0.0002 | ||||
| TR (kg) | 2 | β0 | 0.00017 | 0.0003 | 0.6309 | 0.95 | 1.36 |
| β1 | 2.83178 | 0.4927 | 0.0022 | ||||
| CR (kg) | 2 | β0 | 0.00374 | 0.0070 | 0.6156 | 0.95 | 20.33 |
| β1 | 2.74436 | 0.4712 | 0.0021 | ||||
| CPR (kg) | 2 | β0 | 0.00099 | 0.0027 | 0.7309 | 0.91 | 18.84 |
| β1 | 2.98448 | 0.6915 | 0.0076 | ||||
| CSR (kg) | 2 | β0 | 0.00685 | 0.0062 | 0.3171 | 0.98 | 3.03 |
| β1 | 2.24293 | 0.2284 | 0.0002 | ||||
| CTR (kg) | 2 | β0 | 0.00009 | 0.0002 | 0.6422 | 0.95 | 1.24 |
| β1 | 2.97466 | 0.5092 | 0.0021 | ||||
| FTR (kg) | 2 | β0 | 0.00130 | 0.0025 | 0.6232 | 0.86 | 0.17 |
| β1 | 1.66772 | 0.4906 | 0.0193 | ||||
| TR (kg) | 1 | β0 | 0.0000043 | 0.0000031 | 0.2477 | 0.99 | 0.25 |
| β1 | 5.10711 | 0.2999 | < 0.0001 | ||||
| β2 | -1.59354 | 0.1549 | 0.0005 | ||||
| CTR (kg) | 1 | β0 | 0.0000012 | 0.0000011 | 0.3368 | 0.99 | 0.25 |
| β1 | 5.46879 | 0.3705 | 0.0001 | ||||
| β2 | -1.67034 | 0.1855 | 0.0008 | ||||
| FSR (kg) | 1 | β0 | 0.00085 | 0.0015 | 0.6014 | 0.96 | 0.06 |
| β1 | -2.95403 | 0.4221 | 0.0022 | ||||
| β2 | 4.92840 | 0.8096 | 0.0037 | ||||
| FTR (kg) | 1 | β0 | 0.00094 | 0.0004 | 0.1242 | 0.99 | 0.03 |
| β1 | 3.21843 | 0.2113 | 0.0001 | ||||
| β2 | -1.75394 | 0.1595 | 0.0004 | ||||
SE: standard error, adj-R2: adjusted coefficient of determination, RMSE: root mean square error, TaR: tap root, PR: primary roots, SR: secondary roots, TR: tertiary roots, CR: coarse roots, CPR: coarse primary roots, CSR: coarse secondary roots, FSR: fine secondary roots, CTR: coarse tertiary roots, FTR: fine tertiary roots.
Biomass equations by components for individual roots
Several equations for individual root components were derived from data collected from 66 individual roots. The equations presenting the best fitting were ToR, PR, SR, CR, CPR and CSR; all of them showed R2 values higher than 0.7. All the equation parameters were significant (P ≤ 0.05), except those for FR, FPR, and FSR which, consequently, experienced the lowest determination coefficients (Table 7).
Table 7 Model parameters and goodness of fit statistics to estimate the belowground biomass by component at the individual root level.
| Component | Model | Estimated parameters | SE | Pr > |t| | R2 | RMSE (g) | |
| ln (ToR; g) | 3 | β0 | -3.25206 | 0.4230 | < 0.0001 | 0.90 | 0.64 |
| β1 | 2.57339 | 0.1059 | < 0.0001 | ||||
| ln (PR; g) | 3 | β0 | -2.94077 | 0.5147 | < 0.0001 | 0.86 | 0.67 |
| β1 | 2.41009 | 0.1266 | < 0.0001 | ||||
| ln (SR; g) | 3 | β0 | -4.39779 | 0.7805 | < 0.0001 | 0.74 | 1.02 |
| β1 | 2.46898 | 0.1922 | < 0.0001 | ||||
| ln (TR; g) | 3 | β0 | -5.73979 | 0.9800 | < 0.0001 | 0.64 | 1.21 |
| β1 | 2.41135 | 0.2399 | < 0.0001 | ||||
| ln (CR; g) | 3 | β0 | -3.49708 | 0.4323 | < 0.0001 | 0.90 | 0.66 |
| β1 | 2.62623 | 0.1083 | < 0.0001 | ||||
| ln (FR; g) | 3 | β0 | -0.68053 | 0.4860 | 0.1664 | 0.43 | 0.74 |
| β1 | 0.85737 | 0.1219 | < 0.0001 | ||||
| ln (CPR; g) | 3 | β0 | -2.96208 | 0.5158 | < 0.0001 | 0.86 | 0.67 |
| β1 | 2.41485 | 0.1269 | < 0.0001 | ||||
| ln (FPR; g) | 3 | β0 | 2.68750 | 0.8520 | 0.0511 | 0.58 | 0.36 |
| β1 | -0.46453 | 0.2264 | 0.1325 | ||||
| ln (CSR; g) | 3 | β0 | -5.14299 | 0.8185 | < 0.0001 | 0.74 | 1.07 |
| β1 | 2.63212 | 0.2015 | < 0.0001 | ||||
| ln (FSR; g) | 3 | β0 | 1.53599 | 0.5615 | 0.0088 | 0.0003 | 0.71 |
| β1 | 0.01692 | 0.1398 | 0.9042 | ||||
| ln (CTR; g) | 3 | β0 | -9.18095 | 1.7626 | < 0.0001 | 0.55 | 1.41 |
| β1 | 3.15863 | 0.4144 | < 0.0001 | ||||
| ln (FTR; g) | 3 | β0 | -1.72452 | 0.5671 | 0.0036 | 0.50 | 0.70 |
| β1 | 1.04305 | 0.1388 | < 0.0001 | ||||
SE: standard error, ToR: total root biomass, PR: primary roots, SR: secondary roots, TR: tertiary roots, CR: coarse roots, FR: fine roots, CPR: coarse primary roots, FPR: fine primary roots, CSR: coarse secondary roots, FSR: fine secondary roots, CTR: coarse tertiary roots, FTR: fine tertiary roots.
More than 90 % of the observed variability in ToR, PR, TR, CR, CPR, FSR and CTR was explained by the basal diameter of the tap root. In the case of CSR, correlation with tap-root basal diameter also was significant, although tap-root basal diameter explained a lower proportion of its variability. The equations that had non-significant parameters were SR, FR and FTR. As fine roots, and particularly fine primary roots along the tap root are scarce, it was not possible to fit the FPR data to a model (Table 8).
Table 8 Model parameters and goodness of fit statistics to estimate biomass of the tap root and components.
| Component | Model | Estimated parameters | SE | Pr > |t| | R2 | RMSE (g) | |
| ln (ToR; g) | 3 | β0 | -0.65185 | 0.4998 | <0.0001 | 0.98 | 0.35 |
| β1 | 2.97697 | 0.1483 | <0.0001 | ||||
| ln (PR; g) | 3 | β0 | -0.90522 | 0.5927 | 0.2014 | 0.98 | 0.67 |
| β1 | 2.98988 | 0.1744 | <0.0001 | ||||
| ln (SR; g) | 3 | β0 | -3.11284 | 3.4604 | 0.4633 | 0.79 | 0.92 |
| β1 | 2.69974 | 0.9718 | 0.1088 | ||||
| ln (TR; g) | 3 | β0 | -13.37030 | 1.8928 | 0.0195 | 0.97 | 0.50 |
| β1 | 5.23915 | 0.5316 | 0.0101 | ||||
| ln (CR; g) | 3 | β0 | -0.75880 | 0.4986 | 0.2027 | 0.99 | 0.3469 |
| β1 | 2.99123 | 0.1467 | <0.0001 | ||||
| ln (FR; g) | 3 | β0 | -1.43166 | 1.2584 | 0.3379 | 0.73 | 0.85 |
| β1 | 1.11657 | 0.3883 | 0.0638 | ||||
| ln (CPR; g) | 3 | β0 | -0.90522 | 0.5927 | 0.2014 | 0.98 | 0.41 |
| β1 | 2.98988 | 0.1744 | <0.0001 | ||||
| ln (CSR; g) | 3 | β0 | -1.98434 | 1.7350 | 0.3165 | 0.85 | 1.21 |
| β1 | 2.53033 | 0.5106 | 0.0077 | ||||
| ln (FSR; g) | 3 | β0 | -2.81838 | 0.7673 | 0.0668 | 0.93 | 0.20 |
| β1 | 1.12295 | 0.2155 | 0.0349 | ||||
| ln (CTR; g) | 3 | β0 | -15.08499 | 2.1697 | 0.0061 | 0.96 | 0.63 |
| β1 | 5.75540 | 0.5905 | 0.0023 | ||||
| ln (FTR; g) | β0 | -1.38823 | 1.3761 | 0.3874 | 0.67 | 0.93 | |
| β1 | 1.05075 | 0.4247 | 0.0897 | ||||
SE: standard error, ToR: total root biomass, PR: primary roots, SR: secondary roots, TR: tertiary roots, CR: coarse roots, FR: fine roots, CPR: coarse primary roots, CSR: coarse secondary roots, FSR: fine secondary roots, CTR: coarse tertiary roots, FTR: fine tertiary roots.
In general, better fittings were observed to the belowground biomass data at the tree-level than to the individual-root data. It appears that belowground biomass is highly correlated with DBH; contrarily, dependence of individual-root biomass to its basal diameter is weak, although such correlation could be species-dependent. Ríos-Carrasco and Návar-Chaidez (2010) found a R2 of 0.84 for pinion pine root biomass as a function of root basal diameter. Variation of biomass of individual roots of P. patula is likely to be explained by factors such as water and nutrient availability, soil compaction or texture, among others.
Below- and aboveground biomass
The root/shoot biomass ratio varied from 0.13 to 0.27, with a mean value of 0.20 (Table 1). In the study conducted by Sanquetta et al. (2011), which included two pine species, they reported a belowground/aboveground biomass ratio of 0.17, which is slightly lower than the value obtained in this study. On the other hand, Liepins et al. (2018) found higher values than those of this sudy: 0.20 to 0.25 for P. sylvestris L., 0.21 to 0.30 for Picea abies L. Karst, 0.23 to 0.34 for Betula pendula Roth and 0.21 to 0.39 for Populus tremula L. In 10- and 20-years old P. ponderosa Dougl. ex Laws plantations, the belowground to aboveground biomass ratios ranged from 0.21 to 0.24 for the sampled trees; however, for the whole stands, the values varied from 0.23 to 0.25. In both cases, the highest mean values were registered in the younger plantation (Laclau, 2003). This situation is similar to that found by Peichl and Arain (2007) in Canada, who determined that the root/aboveground biomass ratio decreased as the stand age of P. strobus L. increased.
In this study, the proportion of belowground biomass in relation to total biomass ranged between 13.4 and 21.2 %, being 16.7 % the mean value (Table 1). This value is lower than that reported for Vochysia guatemalensis Donell-Smithii, where the belowground biomass reached 18.6 % of the total tree biomass (Fonseca et al., 2012). In the study conducted by Martínez et al. (2016) the proportion of root biomass in relation to total biomass of P. cooperi B. Blanco (eight to 13 years old and 7.6 to 12.2 cm DBH) was 17.57 %, thus, being a value quite similar to the observed in this study, even though in that case, dimensions of the trees were lower than those in this research.
The proportion of belowground biomass in relation to total biomass in P. patula trees increased as the DBH went up (Figure 3). This trend coincides with that reported by Grier et al. (1981) for Abies amabilis Douglas ex J. Forbes stands, and also with that of Magnani et al. (2000), who registered an increased biomass of fine roots as the age of the P. sylvestris stands increased from 7 to 59 years.
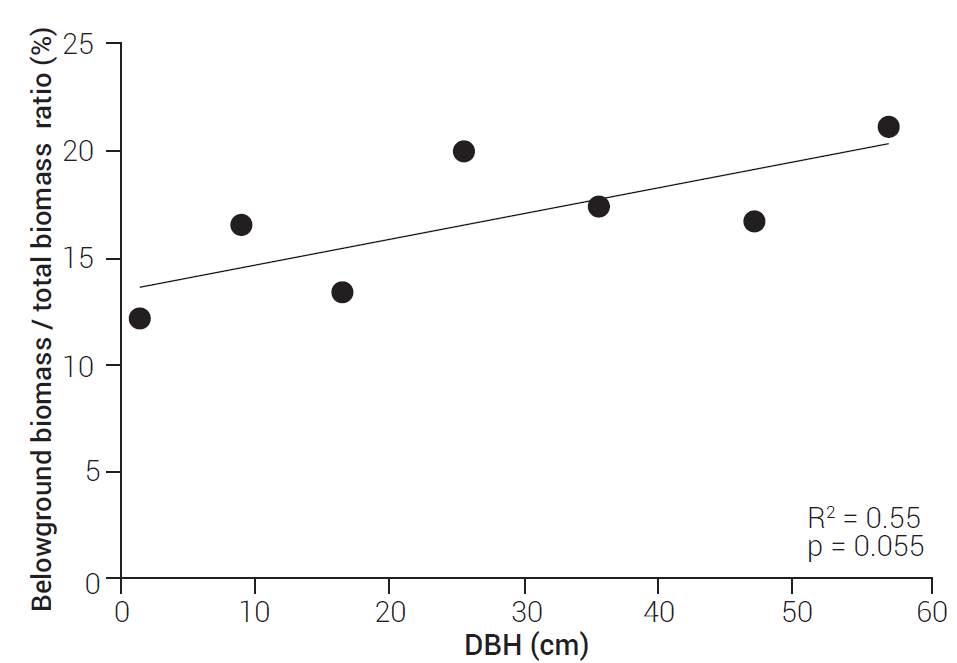
Figure 3 Change in the belowground biomass / total biomass ratio with changing Diameter at Breast Height (DBH).
Nevertheless, another study on P. sylvestris reported a decrease in this proportion as the trees got larger (Kenina et al., 2018), which means that the B/T ratio may be determined not only by the species, but also by the site conditions, since root extraction methodology was similar to the employed in this study, except that fine root biomass was not determined for P. sylvestris.
The belowground biomass and total biomass ratios apparently are determined by the species, but they are affected by the sampling methods of both, belowground and aboveground biomass (Adame et al., 2017; Beets et al., 2007; Brassard et al., 2011). Because of the use of a variety of methodologies for tree root sampling, published allometric equations show variations in their mathematical structure and varying uncertainty in their estimations (Waring and Powers, 2017; Yuen et al., 2016).
Conclusions
The relationship between belowground biomass and DBH can be described by a potential model. The model that best predicts belowground biomass and carbon content at the tree-level is the one of Schumacher and Hall that includes both DBH and H as independent variables. When DBH and H are included in the equations to estimate tree level belowground biomass by component, the improvement in fitting is slight. Tree-level equations for belowground biomass components exhibit a better fitting than individual-root equations. Biomass of the most abundant roots, CPR and FTR, highly depends on DBH; in contrast, biomass of the least frequent roots, FPR and FSR, show a lower dependance from DBH. In the sampled trees of P. patula between 1.5 and 57.0 cm in DBH, the average root/shoot ratio is 0.20 and the belowground biomass/total biomass ratio (B/T) ranges between 13.4 and 21.2 %.

