


Serviços Personalizados
Journal
Artigo
 texto em
  Inglês (pdf)
 Artigo em XML
 Referências do artigo
 Enviar este artigo por email
Indicadores
-
 Citado por SciELO
 -
 Acessos
Links relacionados
-
 Similares em
SciELO
Similares em
SciELO
Compartilhar

 Permalink
Frontera norte
versão On-line ISSN 2594-0260versão impressa ISSN 0187-7372
Frontera norte vol.35 México Jan./Dez. 2023 Epub 15-Abr-2024
https://doi.org/10.33679/rfn.v1i1.2334
Article
Reexamining the “Border Development Paradox” of Northern Mexico: Higher Income with Deficiencies in Public Services?

1El Colegio de la Frontera Norte, México, opelaez@colef.mx
2Centro Internacional de Mejoramiento de Maíz y Trigo, México, fidel.castaneda13@gmail.com
The objective of this paper is to verify if the urban population of the municipalities of the northern border of Mexico has higher incomes than those of other municipalities in the country, while suffering worse living conditions; that is what some authors have called “border development paradox”. To verify this issue, proportions were compared based on multidimensional poverty data from Coneval for the period 2008-2020, and more municipalities and population were considered than in any previous research. The results show that urban residents of the northern border have higher incomes, but also better access to services and less social deprivation. These results—which contradict some previous research, but confirm others—are maintained throughout the entire period analyzed and with different territorial groups. Therefore, it is concluded that there is no evidence of said paradox.
Keywords: income poverty; social deprivation; proportions test; northern border of Mexico; Baja California
El objetivo del artículo es comprobar si la población urbana de los municipios de la frontera norte de México percibe mayores ingresos que la de otros municipios del país, al tiempo que padece peores condiciones de vida; esto es lo que algunos autores denominan la “paradoja del desarrollo fronterizo”. Para verificar esta cuestión, se contrastaron proporciones con base en los datos de pobreza multidimensional del Coneval del período 2008-2020, y se consideraron más municipios y población que los de cualquier investigación precedente. Los resultados indican que los residentes urbanos de la frontera norte tienen mayores ingresos, pero también mejor acceso a servicios y menos carencias sociales. Estos resultados –que contradicen a algunas investigaciones previas, pero confirman a otras– se mantienen a lo largo de todo el período analizado y con distintas agrupaciones territoriales. Por ello se concluye que no hay evidencia de dicha paradoja.
Palabras clave: pobreza de ingreso; carencias sociales; contraste de proporciones; frontera norte de México; Baja California
INTRODUCTION
The border between Mexico and the United States spans 3 185 kilometers, running from the mouth of the Rio Grande in the Gulf of Mexico to the Pacific Ocean between the cities of Tijuana and San Diego. Its current delineation is a direct result of Mexico’s defeat in the 1846-1848 war against the United States and the subsequent treaties of Guadalupe Hidalgo in 1848 and the Gadsden Purchase in 1853. These treaties compelled Mexico to sell the territories that now make up the states of California, Nevada, Utah, Arizona, New Mexico, Texas, and parts of Wyoming, Colorado, Kansas, and Oklahoma (Tamayo & Moncada, 2001).
At that time, the border region was practically uninhabited. Even in the year 1900, Matamoros, the Mexican city with the highest population on the border, had only 8 347 inhabitants. It was followed by Ciudad Juárez (8 218 inhabitants), Porfirio Díaz (now Piedras Negras, 7 888 inhabitants), and Nuevo Laredo (6 548 inhabitants) (INEGI, 2022). On the U.S. side, San Diego (17 700 inhabitants), El Paso (15 906 inhabitants), and Laredo (13 429 inhabitants) were the three most populous cities, with Brownsville (6 305 inhabitants) trailing at a greater distance (Moffat, 1996; Texas State Historical Association [TSHA], 2015).
Durand and Massey (2003, p. 52) explain that in “the last quarter of the 19th century and the beginning of the 20th century, smuggling helped keep the towns alive and mark the border.” During the years of the Mexican Revolution, they served as “privileged places for the procurement of weapons” and, during the Prohibition era, as havens for “prostitution, smuggling, and the production of alcoholic beverages” (2003, p. 52). As Rhi-Sausi and Oddone (2009) argue, the border, being situated far from the national capitals and traversing sparsely populated areas, began to be perceived as a strategic area that allowed for the exploitation of differences in legislation, cultures, currencies, and more.
On the Mexican side, “irrigation projects and President Cárdenas’s policy of granting ejidos in the border region during the 1930s allowed for the creation of physical infrastructure and social networks that made internal migration possible” (Durand & Massey, 2003, p. 52). Additionally, the region’s industrial development was promoted through the implementation of “free trade zones” (Taylor, 2003, p. 1046). In the 1970s, the National Border Program (PRONAF, Spanish acronym for Programa Nacional Fronterizo) and the Border Industrialization Program (PIF, Spanish acronym for Programa de Industrialización de la Frontera) began operating, with the latter being a response to the cancellation of the Bracero Program by the United States. This industrial activity drove the expansion of urban areas, which was further facilitated by the growth of the tertiary sector. The dynamism of the labor market attracted new residents, and as a result, the rate of growth of border cities significantly surpassed the national average.
These circumstances gave rise to a unique development of urban areas along the northern border, aligning with what Guillén (1990, p. 115) calls “the paradox of border development.” This paradox is defined as “the contradiction between higher income levels, but the absence of better living conditions in the immediate environment of its population” (p. 115). In this context, border cities offered relatively well-paying jobs and even opportunities to work in the United States (Orraca, 2015; Vega, 2016), resulting in high incomes that attracted new migrants (Mungaray et al., 2014). This resulted in a population growth rate that outpaced the provision of public services and the construction of quality housing. As Carrión (2008, p. 34) puts it, “the accelerated population growth exceeds the capacity of local governments to provide basic services.” Explained in this manner, the phenomenon appears more logical than paradoxical. What’s unusual—or the paradox within the paradox—is that subsequent research (Vázquez, 1996; Carrión, 2008; Castañeda, 2016) does not find clear evidence of the mentioned contradiction between income levels and living conditions in the cities of the northern border.
The objective of this article is to verify whether the urban population of municipalities in the northern border of Mexico perceives higher incomes compared to other municipalities in the country while experiencing inferior living conditions, specifically in terms of access to fewer or lower- quality public services. The hypothesis is that this indeed occurs, meaning that the situation described by Guillén’s “paradox of border development” (1990, p. 115) is observed.
The databases for measuring multidimensional poverty in Mexico, as published by the National Council for the Evaluation of Social Development Policy (Consejo Nacional de Evaluación de la Política de Desarrollo Social [CONEVAL]), provide larger sample sizes than previous research, encompassing more municipalities and covering a longer time period (from 2008 to 2020). The results and conclusions drawn from this data are robust and clearly verify some previously discussed issues: is income poverty lower among the urban population in the northern border, yet accompanied by greater service deficiencies and poorer housing quality? Do urban residents in the northern border face more housing deficiencies at an equivalent income level?
To do this, the original proposition of the “paradox of border development” and subsequent attempts to analyze it are reviewed below. In the third section, the data sources and analysis techniques used to test the working hypothesis are described in detail. In the fourth section, the results are discussed and compared. Finally, the conclusions regarding the paradox are presented.
STATE OF THE ISSUE
The paradox of border development, characterized by higher incomes but worse living conditions, was first discussed in Guillén’s article (1990). This article conducted a comparative analysis of the living conditions in some northern Mexican border cities and those in the interior of the country. The research relied on data from the Annual Socioeconomic Survey of the Border (ESAF, Spanish acronym for Encuesta Socioeconómica Anual de la Frontera [ESAF]) from 1987 and 1988 and notes that the percentage of the population lacking connected sewage, piped water, and electricity is higher in the analyzed border cities (Ciudad Juárez, Tijuana, Nuevo Laredo, Reynosa, and Nogales) than in the cities in the interior of the country (San Luis Potosí, Torreón, and Monterrey). This pattern held true when comparing both groups as a whole and city by city, with one exception: Ciudad Juárez had a higher percentage of the population with piped water in their homes compared to Monterrey and Torreón. In all other comparisons, the non-border cities had better living conditions. Furthermore, Guillén (1990) categorizes these populations into three socioeconomic strata, confirming the same pattern. More specifically, he finds that the middle socioeconomic stratum in border cities experiences similar levels of deficiencies as the lowest stratum in interior cities.
At the same time, he explains that the income structure is relatively better in border cities, where “the international nature of the labor market (...) allows a significant portion of the economically active population to earn income in dollars and acquire certain goods at lower costs than domestic prices, thereby increasing their purchasing power relatively” (p. 104). Among these goods, Guillén (1990) highlights appliances, furniture, and automobiles. From this, he deduces that social marginalization in the border region has distinct characteristics. According to the author, it is “a differentiated, partial marginalization” (p. 107), “unbalanced (in some areas, yes, in others, no)” (p. 101); “it is not a generalized marginalization across all social indicators but rather is concentrated, particularly in those elements that nominally should give an urban character to the cities in the northern border” (p. 103). The shortcomings are not due to insufficient income or formal employment opportunities related to market dynamism but rather to the lack of housing with sewer, water, and electricity services, caused by rapid population growth and the relative scarcity of public resources to meet the demand for these services. This is the paradox of border cities, “the relative disconnect between their economic growth and the ability to provide urban living conditions for their residents” (Guillén, 1990, p. 107).
Guillén and Ordóñez (1992) do not directly refer to the paradox, but they revisit some of its fundamental elements when analyzing 50 settlements without electricity in Tijuana and 40 in Mexicali. They observe that the population in these settlements is fully integrated “into the regional economic structure, especially in the case of Tijuana” (p. 160), and they have access to “educational and health services” (p. 163) but lack electrical service, piped water in their homes, sewer connected to the public network, garbage collection, street paving, mail services, and inhabit dwellings with only one room and wooden walls. According to the authors, this is, therefore, “a ‘partial’ marginality, not generalized across all socio-economic indicators that usually identify this phenomenon” (p. 151), but “limited to housing and public service variables” (p. 160). Guillén and Ordóñez (1992) conclude that the conditions of the housing in these marginal settlements are not related to the income and education levels of their residents, reflecting a significant disconnect between the economic structure and urban infrastructure. However, they do not make comparisons with cities in the interior of the country or analyze data from other border areas, but they argue that “most likely, the cases of Tijuana and Mexicali reflect the extreme points where the rest of the larger border cities fall” (p. 163).
The idea that urban marginality in the northern border operates only through some of the variables typically associated with the definition of social marginality is revisited by Guillén (2007), who once again conducts comparisons between urban areas. To do this, he uses data from the “Encuesta sobre Calidad de Vida, Competitividad y Violencia Social, Colef/Sedesol, 2006”3 (p. 12). He works with data from four metropolitan areas in the northern border (Tijuana-Playas de Rosarito, Mexicali, Juárez, and Reynosa-Río Bravo) and four from the interior of the country (Mérida, Querétaro, Aguascalientes, and Morelia). The author finds that the per capita income of the lowest decile is 52% higher in the border metropolitan areas, but the percentage of households without water is more than double in the border, and households without sewer, electricity, and paved roads almost double those in the interior of the country. Guillén (2007, p. 17) explains that the lag in providing these services “is due to both institutional factors (structure, capacities, resources, public responsibility) and economic factors (financing, effectiveness, efficiency) and their relationship with demand (population and territorial growth, among other factors),” thus reiterating the typical formula of “the paradox of border development: higher incomes but, at the same time, lower quality of life” (pp. 23-24).
Before this latest publication by Guillén on the subject, other researchers also explored the paradox. For instance, Vázquez (1996) explains that in border cities, “the contradictory aspect is, apparently, the relative disconnect between their economic growth and their ability to improve the living conditions of their residents” (pp. 20-21). She hypothesizes that “the development of border municipalities has not progressed in step with their economic growth, as the link between both processes has particular characteristics in the area” (p. 23), and she uses data from 1970 and 1990 to test this hypothesis. However, her results indicate that only access to electrical energy is lower in the northern border. The percentage of households with piped water and sewer exceeds that of the country. Furthermore, she questions the advantage of the border in terms of income due to the high level of inequality she observes in its distribution. While she does not dismiss the idea of the paradox of border development, the author finds nuances that limit its verification in the original terms.
Ruiz and Aceves (2000) pay attention to the inequality aspects highlighted by Vázquez (1996) and focus on the specific analysis of the city of Tijuana, for which they find that the problem is not unemployment but “the low levels of compensation obtained in certain segments of the labor market and high worker turnover” (p. 14). They also add the lack of housing and public services, emphasizing the existence of “enormous disproportion” (p. 22) between the production and demand for affordable and middle-class housing. They conclude that dynamism and economic growth are veils that conceal inequalities, as they have tended to concentrate in specific areas, distributing social wealth unequally and coexisting with deficiencies in public services and housing. Once again, the characteristics of the paradox appear, but with some unique features. The higher average incomes do not benefit the entire population; instead, they concentrate in certain cases and exclude others who may be experiencing very precarious living conditions due to housing and public service shortages.
Another study that builds on the implicit differences in the paradox of border development is that of Salazar (2002), where it is argued that social inequality in the northern border cannot be exclusively analyzed using income indicators. Variables that reflect the living conditions of the population add necessary nuances for making comparisons between border cities and those in the interior of the country. More precisely, the author finds that income and education levels do not contribute to marginalization in Tijuana in the year 2000; rather, it is more closely related to the characteristics of housing. He adds that neighborhoods with fewer services in their homes are also less accessible, meaning they are further from healthcare centers and workplaces.
Social exclusion in the Tijuana metropolitan area was also studied by Carrión (2008). Her approach begins by assessing the essence of the paradox: in this case, access to housing and public services should indicate a different quality of life compared to labor market indicators and income. However, the results she obtains using data from 2005 lead to the conclusion that her initial hypotheses “were not fully met” (p. 84). The employment dimension did verify expectations by benefiting almost the entire population, but the dimensions of goods and public services did not show the expected deficiencies. Instead, they had relatively high levels of inclusion, while incomes proved insufficient for a significant portion of the population. The author acknowledges that there were significant advances in correcting the disproportion that existed in the 1980s between housing production and demand.
In turn, Castañeda (2016) revisits the analysis of the entire northern border. He presents the hypothesis of the paradox of border development and, to verify it, uses municipal data from the Margination Index of the National Population Council (Conapo) for 1990, 2000, and 2010. He observes that only some urban municipalities in the border region show better wage conditions with deficiencies in basic housing services. He notes, for example, that Tijuana, Tecate, Mexicali, Caborca, and Nogales fit the paradox framework, but Agua Prieta, Nuevo Laredo, or Reynosa do not. Furthermore, he points out that by the year 2010, the wage advantage of border cities had weakened, so the dual condition of higher incomes with poorer housing services was only met in 5 out of 17 urban municipalities in the northern border.
During the 1990s, average household income increased more in the border states than in the rest of the country (Peach and Molina, 2002). However, from 2000 to 2010, this trend reversed (Castañeda, 2016). Additionally, the provision of housing and basic services varied (Carrión, 2008). These changes led Guillén himself to modify his initial predictions about the evolution of the paradox, but not its essence.
Initially, Guillén (1990, p. 97) anticipated “a growing imbalance between economic dynamism and the living conditions of large segments of the border population,” emphasizing that among these aspects, “the gap tends to progressively widen.” According to Guillén (1990, p. 107), the growth of border cities “appears to be accompanied by not only a constant but also progressively expanding lag.”
In contrast to this somewhat unfavorable perspective, Guillén (2007, p. 11) acknowledges some of the changes that have occurred when he explains that “the trajectory of recent years points towards an improvement in the quality of life” in the metropolitan areas of the northern border. However, he insists on the peculiarities “of border development: higher incomes, but at the same time, a lower quality of life” (Guillén, 2007, pp. 23-24). As previously mentioned, other research yields different results.
DATA SOURCES AND ANALYSIS TECHNIQUES
The databases created by CONEVAL to measure multidimensional poverty contain information for over 200,000 individuals per year and allow for the identification of the municipality of residence, the size of the locality, educational backwardness, lack of access to healthcare, social security, basic services in housing (sewer, water, electricity), nutrition, and the current income of each person, among other aspects. It is, therefore, similar information to what Guillén (1990, 2007) uses to describe the “paradox of border development,” with the advantage of representing a larger population, more urban areas, and a broader range of years than the original analyses.
Specifically, the databases for calculating multidimensional poverty cover the years from 2008 to 2018 using the CONEVAL methodology (2014), and from 2016 to 2020 using the new CONEVAL methodology (2018). In both cases, the information is collected biennially. In 2018, CONEVAL modified some definitions for the calculation of multidimensional poverty: the deprivation of food became nutritious and high-quality food; the criteria for classifying a person with educational backwardness; the construction of the non-food basic basket; and the expansion factors of the samples. Therefore, the figures from the new methodology are not strictly comparable to those from the previous one. However, as will be seen, they yield similar results for the analyzed elements and allow, in any case, the comparison of the living conditions of residents in the northern border with those in other areas of the country.
CONEVAL’s data (2019, 2021) facilitate the calculation of the percentages used by Guillén (1990, 2007) for his analyses and similar ones that also describe the living conditions of the population. Following the seminal publications, it seems essential to compare the percentages of residents who do not have access to water, sewer service, or electricity. To these, the six deprivations defining multidimensional poverty are added: educational backwardness, access to healthcare, access to social security, quality and living space, access to basic housing services, and nutrition (CONEVAL, 2018). Furthermore, it is necessary to verify that incomes favor residents in the northern border. To do this, calculating the percentages of the population with income below the poverty line (PL) and the extreme poverty line (EPL) is proposed. With this information, the incidence of each deprivation by geographic area can be determined for the total population and for specific income groups, specifically those with income below the EPL, between the EPL and PL, and those with income above the PL.
The geographic areas being compared are defined as follows: first, the analysis is restricted to residents of urban localities, those with populations of 2 500 or more. As Guillén (1990, p. 107) notes, “cities distinguish themselves from rural areas, among other aspects, by their ability to provide their residents with certain services such as piped water, public sewer systems, and electricity, in addition to other forms of communal infrastructure.” It is precisely these services that exhibit a relative scarcity in the cities of the northern border and characterize the “paradox of border development,” arising from the backwardness in these “elements that should, in theory, confer an urban character on the cities of the northern border” (p. 103).
The urban areas of the country are divided into two contrasting groups. On one hand, the analysis focuses on the urban population residing in the 38 municipalities along the northern border.4 In contrast, it considers the urban population in the 26 federal entities that do not share a border with the United States. This division allows us to emphasize the distinction between the border and non-border groups concerning this characteristic. To achieve this, the analysis excludes the population of non- border municipalities in Baja California, Coahuila, Chihuahua, Nuevo León, Sonora, and Tamaulipas. It’s worth noting that Guillén (1990) uses data from the cities of Torreón and Monterrey to represent the interior of the country. However, these two cities are not included in either of the aforementioned groups. The division is more in line with Guillén (2007), where metropolitan areas like Aguascalientes, Mérida, Morelia, and Querétaro serve as counterparts to Tijuana, Mexicali, Juárez, and Reynosa-Río Bravo.
The number of available observations for each group depends on the year considered. As indicated in Table 1, the maximum sample size corresponds to the year 2020, and the minimum to 2012 for urban residents in municipalities of the northern border. For residents in states without a border with the United States, the minimum corresponds to the year 2016. Even in these cases, there are more than 8 000 and 122 000 observations, respectively.
The original research on the paradox of border development is limited to calculating the sample percentages of each deficiency by group and comparing them directly without considering the sizes of these samples or the potential significance of the differences found. To consider these aspects, in this case, equality tests are performed on the proportions calculated from the samples for each year t and deficiency i, comparing the percentage for border residents, p̂0it, with that of non-border residents, p̂1it, using functions (statistics) of the type
where p̂it =
RESULTS
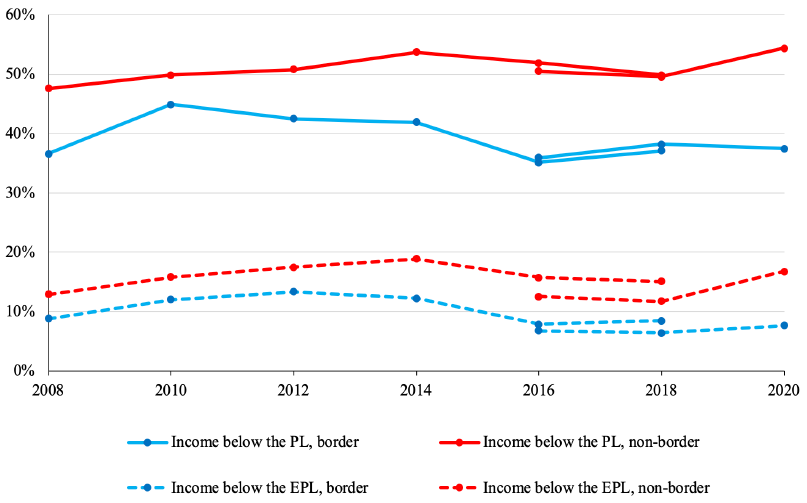
The “paradox of border development” is “the contradiction between better income levels but not better living conditions” in the urban areas of Mexico’s northern border (Guillén, 1990, p. 115). In this regard, Table 2 confirms that between 2008 and 2020, the percentages of the population with incomes below the poverty and extreme poverty lines were always significantly lower in this area compared to the non-border area. The most significant difference is observed in 2020 when only 37.49% of border residents experienced poverty due to income insufficiency, compared to 54.40% of non-border urban residents. The largest difference for the EPL also corresponds to the year 2020. The smallest gap between the two areas for both measures is in 2010 when income poverty increased more in the northern border than in the rest of the country, leading to a convergence by default, as also noted by Castañeda (2016). However, even in 2010, the difference is significant with at least 99.9% confidence. From then until 2020, the border region further expanded its income advantage (see Graph 1).
Table 2. Percentages of Population with Income Below the Poverty and Extreme Poverty Lines by Region, Year and Πit Values
| CONEVAL data (2019) |
CONEVAL data (2021) |
||||||||
|---|---|---|---|---|---|---|---|---|---|
| 2008 | 2010 | 2012 | 2014 | 2016 | 2018 | 2016 | 2018 | 2020 | |
| Income below the poverty line (PL) | |||||||||
| Border | 36.62 | 44.87 | 42.47 | 41.9 | 35.09 | 37.12 | 35.92 | 38.22 | 37.49 |
| Non-border | 47.56 | 49.87 | 50.79 | 53.69 | 51.87 | 49.84 | 50.52 | 49.53 | 54.4 |
| Π IPt | -20.16 | -9.19 | -14.49 | -24.89 | -37.69 | -28.35 | -32.82 | -25.21 | -41.62 |
| *** | *** | *** | *** | *** | *** | *** | *** | *** | |
| Ingreso menor a la línea de pobreza extrema (LPE) | |||||||||
| Border | 8.8 | 12.01 | 13.35 | 12.21 | 7.83 | 8.46 | 6.75 | 6.37 | 7.62 |
| Non-border | 12.91 | 15.81 | 17.47 | 18.85 | 15.75 | 15.1 | 12.48 | 11.69 | 16.75 |
| Π IPEt | -11.38 | -9.62 | -9.51 | -18.13 | -24.96 | -21.03 | -19.88 | -18.82 | -30.72 |
| *** | *** | *** | *** | *** | *** | *** | *** | *** | |
Source: Own elaboration based on CONEVAL data (2019, 2021).
Note:
***indicates that the difference is significant with a confidence level of at least 99.9%.
Source: Own elaboration based on CONEVAL data (2019, 2021).
Graph 1. Percentages of population with income below the poverty line (PL) and extreme poverty line (EPL) in the border and non-border regions (2008-2020)
The 2008 economic crisis had a greater impact on the border region than on the rest of the country, as explained by López and Peláez (2015). Due to its nature, this crisis affected many formal workers who ended up in poorly paid jobs. This increased the percentage of the population with income below the PL by 8.25 percentage points between 2008 and 2010. In the non-border region, the increase was only 2.31 percentage points. The difference between these two dynamics is noticeable in graph 1. The population with income below the EPL did not show these discrepancies and evolved similarly in both regions. It increased by 3.21 percentage points in the border region and 2.90 in the non-border region. The rest of the deficiencies, due to their structural nature, were not affected by the cyclical crisis.
The data also capture the initial months of the COVID-19 crisis in 2020. In this case, the non- border population was the most affected by income loss. The temporary suspension of non- essential activities, coupled with a higher proportion of informal employment may have driven the increases of 4.87 and 5.06 percentage points that occurred from 2018 to 2020 in the population with income below the poverty line (PL) and below the extreme poverty line (EPL), respectively. During the same period, in the border area, income poverty even decreased by 0.73 points, while extreme poverty increased by 1.25.
Although the differences vary over time, based on the results in Table 2 and Graph 1, it appears clear that income levels are higher in the urban areas of the northern border than in the rest of the country, as noted by Guillén (1990, 2007). However, this doesn’t prevent incomes from still being insufficient for a significant portion of the population, as argued by Vázquez (1996), Ruiz and Aceves (2000), and Carrión (2008). In any given year, more than 35% of urban residents in the northern border lack the income necessary “to acquire the goods and services needed to satisfy their (food and non-food) needs” (CONEVAL, 2018, p. 35), falling below the PL, while over 6% don’t even have the income to acquire the food required for adequate nutrition, classifying them as under the EPL.
The paradox posed by Guillén (1990, 2007) is that, even with lower income poverty, the cities in the northern border are characterized by higher percentages of the population lacking services (sewage, piped water, and electricity). On the other hand, Vázquez (1996) and Carrión (2008) find higher percentages of households with piped water and sewage compared to the country as a whole and relatively high levels of inclusion in access to public goods and services in the northern border. The results in Table 3 align more closely with the findings of the latter studies than with Guillén’s (1990, 2007). As seen, the percentages of the six deprivations included in multidimensional poverty are always lower in the border region. These differences are statistically significant for all years regarding access to social security, housing quality and space, basic housing services, and food. For educational backwardness and access to healthcare, there are some years where the percentage differences are not statistically significant, but they consistently show lower deprivations among urban residents in the northern border.
Table 3. Percentages of Population with Deficiencies by Region, Year and Πit Values
| CONEVAL data (2019) | CONEVAL data (2021) | ||||||||
|---|---|---|---|---|---|---|---|---|---|
| 2008 | 2010 | 2012 | 2014 | 2016 | 2018 | 2016 | 2018 | 2020 | |
| Educational backwardness | |||||||||
| Border | 17.6 | 16.13 | 14.47 | 13.65 | 13.2 | 13.34 | 14.31 | 15.34 | 15.75 |
| Non-border | 18.36 | 17.57 | 15.98 | 15.54 | 14.47 | 13.76 | 15.37 | 15.46 | 16.04 |
| Π EDUt | -1.8 | -3.49*** | -3.59*** | -5.5*** | -4.08*** | -1.39 | -3.29*** | -0.35 | -0.96 |
| Lack of access to healthcare services | |||||||||
| Border | 32.51 | 29.88 | 21.45 | 18.11 | 16.14 | 15.79 | 16.18 | 15.83 | 22.32 |
| Non-border | 38.37 | 30.49 | 23.31 | 19.31 | 16.89 | 17.98 | 16.9 | 17.98 | 29.3 |
| Π SALt | -11.1 | -1.21 | -3.83 | -3.21 | -2.26 | -6.39 | -2.16 | -6.26 | -18.98 |
| *** | *** | ** | * | *** | * | *** | *** | ||
| Lack of access to social security | |||||||||
| Border | 53.71 | 51.07 | 52.45 | 43.5 | 37.88 | 40.89 | 33.52 | 33.55 | 34.88 |
| Non-border | 61.53 | 57.41 | 58.33 | 55.57 | 52.98 | 54.43 | 50.44 | 49.81 | 48.97 |
| Π SSt | -14.74 | -11.77 | -10.37 | -25.55 | -33.93 | -30.22 | -38.01 | -36.25 | -34.64 |
| *** | *** | *** | *** | *** | *** | *** | *** | *** | |
| Lack of quality and space in housing | |||||||||
| Border | 9.41 | 9.09 | 8.43 | 7.51 | 6.41 | 7.23 | 6.42 | 7.27 | 6.12 |
| Non-border | 13.36 | 12 | 11.46 | 10.25 | 10.17 | 9.4 | 10.11 | 9.35 | 7.67 |
| Π CEVt | -10.76 | -8.28 | -8.35 | -9.61 | -14.22 | -8.38 | -13.99 | -8.04 | -7.2 |
| *** | *** | *** | *** | *** | *** | *** | *** | *** | |
| Lack of access to basic services in housing | |||||||||
| Border | 4.51 | 5.25 | 4 | 3.74 | 2.37 | 3.2 | 2.37 | 3.21 | 3.05 |
| Non-border | 13.28 | 12.46 | 12.11 | 11.9 | 10.86 | 11.04 | 10.78 | 10.95 | 10.07 |
| Π SBVt | -24.17 | -20.38 | -22.04 | -27.29 | -31.8 | -28.79 | -31.62 | -28.52 | -29.62 |
| *** | *** | *** | *** | *** | *** | *** | *** | *** | |
| Lack of access to food | |||||||||
| Border | 14.69 | 15.77 | 17.48 | 19.19 | 17.06 | 16.79 | 17.8 | 17.33 | 14.6 |
| Non-border | 19.83 | 23.7 | 21.71 | 21.46 | 19.25 | 19.49 | 20.94 | 21.23 | 22.27 |
| Π ALIt | -11.94 | -17.27 | -8.96 | -5.86 | -6.27 | -7.62 | -8.72 | -10.68 | -22.94 |
| *** | *** | *** | *** | *** | *** | *** | *** | *** | |
| Lack of access to water | |||||||||
| Border | 2.41 | 2.25 | 2.01 | 2.04 | 1.47 | 1.83 | 1.47 | 1.84 | 1.58 |
| Non-border | 7.32 | 5.41 | 5.5 | 5.14 | 4.74 | 4.55 | 4.7 | 4.51 | 4.15 |
| Π AGUt | -17.67 | -13.06 | -13.58 | -15.16 | -17.89 | -14.97 | -17.76 | -14.76 | -16.34 |
| *** | *** | *** | *** | *** | *** | *** | *** | *** | |
| Lack of sewer service | |||||||||
| Border | 2.41 | 2.99 | 2.3 | 1.08 | 0.89 | 1.77 | 0.88 | 1.79 | 1.48 |
| Non-border | 4.64 | 3.84 | 3.86 | 3.23 | 2.43 | 2.07 | 2.41 | 2.06 | 1.88 |
| Π DREt | -9.89 | -4.1 | -7.11 | -13.19 | -11.61 | -2.37 | -11.6 | -2.14 | -3.65 |
| *** | *** | *** | *** | *** | * | *** | * | *** | |
| Lack of electricity service | |||||||||
| Border | 0.06 | 0.14 | 0.28 | 0.41 | 0.25 | 0.1 | 0.25 | 0.1 | 0.16 |
| Non-border | 0.21 | 0.24 | 0.24 | 0.24 | 0.12 | 0.16 | 0.12 | 0.15 | 0.07 |
| Π ELEt | -3.08** | -1.85 | 0.73 | 3.62*** | 3.81*** | -1.69 | 3.88*** | -1.58 | 4.42*** |
Source: Own elaboration based on CONEVAL data (2019, 2021).
Note:
*,
**, and
***indicate significant differences with confidence levels of at least 95, 99, and 99.9 percent, respectively
The specific deficiencies considered by Guillén (1990, 2007) to outline the paradox of border development (sewer, water, and electricity) barely modify what has been discussed. The percentage of the population lacking access to water is significantly lower every year in the border area, with a 99.9% confidence level. Among non-border residents, the proportion of those without piped water in their homes doubles and even triples. Guillén (2007) found the opposite. According to his analysis using data from four metropolitan areas in the northern border and four from the interior of the country, the percentage of households without water was more than twice as high on the border as in non-border cities. The significant difference between these results cannot be attributed to the reference year. Guillén’s (2007) data are from a survey conducted in 2006, while the data presented here start in 2008. The discrepancies between the two must arise from the selection of cities or the sampling conducted within them.
The sewage figures also show differences. Guillén (2007) found that 8.7% of homes in the northern border lack sewage connected to the public network, while the corresponding percentage in non-border cities is 4.4%. This latter value is very similar to that in Table 3 for the year 2008, 4.64%, but the same does not apply to the former. Contrary to what Guillén (2007) claims, the lack of sewage is less in the border area: 2.41%. In fact, from 2008 to 2020, it is always lower with a confidence level of at least 95% in 2018 and 99.9% in the other years.
The only deficiency that has affected the northern border in greater proportion in recent years is related to electrical energy. This result corresponds to that obtained by Vázquez (1996), who also notes that only access to electrical energy is lower in the border region than in the rest of the country. In this case, it can be observed that the percentage of residents without electrical energy in the northern border exceeds that of non-border urban areas in the years 2012, 2014, 2016, and 2020, with the opposite occurring in 2008, 2010, and 2018 (graph 2). These differences are significant: in 2008 with a confidence level of 99%, with less deficiency in the border region; and in 2014, 2016, and 2020 with a confidence level of 99.9%, with less deficiency in non-border areas. In any case, the percentages of the population without electrical energy in these urban areas are minimal, always less than 0.5%.

Source: Own elaboration based on CONEVAL data (2019, 2021).
Graph 2. Percentages of Population Without Electrical Energy in the Border and Non-Border Regions (2008-2020)
In summary, the urban population in northern Mexico’s border region generally exhibits lower levels of income poverty and deficiencies, with the exception of occasional higher rates of electrical energy deficiency in some years. Based on this data, there is no clear evidence supporting what Guillén terms “the paradox of border development.”
Furthermore, when separating the groups by income levels, the contradictions that underlie the paradox are also not found. When considering only the population with income below the EPL (Table 4), the only deficiency with systematically higher percentages among urban residents in the northern border region is once again the lack of electrical service, which, in 2012, 2014, 2016, and 2020, shows Π values significantly positive with at least 99% confidence. Other deficiencies affect people in the border region to a lesser extent than in the rest of the country (Π () 0) with varying levels of significance. The only exceptions are the lack of access to health services in 2016 and the deficiency in housing quality and space in 2012, which are statistically higher in the border region at 99.9 and 99%, respectively.
Table 4. Πit Values for the Differences in Proportions in the deficiencies Among Urban Residents in Border Areas Compared to Non-Border Areas with Incomes Below the EPL
| Datos del Coneval (2019) |
Datos del Coneval (2021) |
||||||||
|---|---|---|---|---|---|---|---|---|---|
| Carencias | 2008 | 2010 | 2012 | 2014 | 2016 | 2018 | 2016 | 2018 | 2020 |
| education healthcare services |
-3.18 ** -4.3 |
-0.26 -1.24 |
-0.82 -2.94 |
-3.3 *** 0.31 |
-2 * 5.11 |
-0.38 -1.59 |
-2.36 * 6.13 |
-0.21 0.49 |
-0.86 -2.97 |
| *** | ** | *** | *** | ** | |||||
| social security | -8.54 | -6.62 | -7.36 | -13.54 | -13.79 | -14.84 | -14.58 | -16.25 | -9.84 |
| *** | *** | *** | *** | *** | *** | *** | *** | *** | |
| quality and space in | -4.6 | -5.23 | 3.01 | -9.29 | -11.01 | -7.37 | -10.5 | -8.88 | -8.2 |
| housing | *** | *** | ** | *** | *** | *** | *** | *** | *** |
| basic services in | -12.75 | -15.76 | -11.41 | -15.56 | -19.52 | -15.49 | -18.66 | -16.55 | -14.29 |
| housing | *** | *** | *** | *** | *** | *** | *** | *** | *** |
| food | 0.91 | -5.08 | -3.2 | -1.02 | -0.87 | -3.25 | -3.58 | -4.21 | -6.92 |
| *** | ** | ** | *** | *** | *** | ||||
| water | -8.14 | -8.31 | -5.08 | -7.35 | -9.56 | -5.06 | -8.66 | -6.38 | -7.9 |
| *** | *** | *** | *** | *** | *** | *** | *** | *** | |
| sewer services | -4.28 | -5.87 | -2.43 | -7.48 | -6.84 | -1.2 | -6.51 | -4.25 | -0.36 |
| *** | *** | * | *** | *** | *** | *** | |||
| electricity | -1.7 | -0.28 | 2.68 ** |
3.18 ** |
3.16 ** |
-1.85 | 2.91 ** |
-1.76 | 5.27 *** |
Source: Own elaboration based on CONEVAL data (2019, 2021).
Note:
*,
**and
***indicate significant differences with confidence levels of at least 95, 99, and 99.9 percent, respectively.
In the case of the urban population with incomes between the poverty and extreme poverty lines (Table 5), there are only four Π estimates that are positively significant at over 95%: the lack of quality and space in housing in 2020, food deficiency in 2014, sewer services in 2010, and electricity in 2014. In contrast, there are 52 significant negative Π values that indicate worse living conditions in the non-border region. Once again, at the same income level, urban residents in the northern border region experience fewer deficiencies.
Table 5. Πit Values for the Differences in Proportions in the deficiencies Among Urban Residents in Border Areas Compared to Non-Border Areas with Incomes Between the PL and the EPL
| CONEVAL data (2019) |
CONEVAL data (2021) |
||||||||
|---|---|---|---|---|---|---|---|---|---|
| Deficiencies | 2008 | 2010 | 2012 | 2014 | 2016 | 2018 | 2016 | 2018 | 2020 |
| education | -1.97 * |
0.25 | -1.52 | -0.53 | 1.4 | 1.06 | 1.68 | 0.9 | 0.65 |
| healthcare services | -10.23 | -6.14 | -5.72 | -4.17 | -4.34 | -9.23 | -4.89 | -9.83 | -11.55 |
| *** | *** | *** | *** | *** | *** | *** | *** | *** | |
| social security | -12.53 | -16.24 | -11.16 | -18.06 | -23.86 | -26.54 | -30.14 | -30.62 | -19.93 |
| *** | *** | *** | *** | *** | *** | *** | *** | *** | |
| quality and space in | -9.91 | -0.72 | -6.49 | -1.36 | -3.89 | 0.48 | -6.02 | 0.31 | 2.77 |
| housing | *** | *** | *** | *** | ** | ||||
| basic services in | -14.07 | -8.61 | -14.41 | -13.25 | -14.82 | -16.34 | -17.47 | -16.9 | -16.43 |
| housing | *** | *** | *** | *** | *** | *** | *** | *** | *** |
| food | -11.66 | -5.86 | -2.89 | 4 | 0.99 | -0.43 | -1.03 | -3.62 | -7.73 |
| *** | *** | ** | *** | *** | *** | ||||
| water | -9.90 | -6.26 | -9.31 | -7.47 | -8.21 | -9.91 | -9.9 | -9.53 | -9.17 |
| *** | *** | *** | *** | *** | *** | *** | *** | *** | |
| sewer services | -5.46 | 3.04 | -5.37 | -5.89 | -3.36 | 0.29 | -4.59 | 1.51 | -0.6 |
| *** | ** | *** | *** | *** | *** | ||||
| electricity | -2.18 * |
-1.36 | -1.73 | 4.03 *** |
1.32 | -1.06 | 1.35 | -1.17 | 1.38 |
Source: Own elaboration based on CONEVAL data (2019, 2021).
Note:
*,
**and
***indicate significant differences with confidence levels of at least 95, 99, and 99.9 percent, respectively.
The population with incomes above the PL exhibits the most deviations from the general trend. In this income group, the percentages of the population experiencing educational lag, a lack of quality and space in housing, and a lack of electricity service consistently show higher figures in the northern border region (Table 6). However, in the rest of the deficiencies, as well as in the availability of water and sewer, the estimates are predominantly negative
Table 6. Πit Values for the Differences in Proportions in the Deficiencies Among Urban Residents in Border Areas Compared to Non-Border Areas with Incomes Above the PL
| CONEVAL data (2019) |
CONEVAL data (2021) |
||||||||
|---|---|---|---|---|---|---|---|---|---|
| Deficiencies | 2008 | 2010 | 2012 | 2014 | 2016 | 2018 | 2016 | 2018 | 2020 |
| education | 5.45 | -2.89 | 0.16 | 0.68 | 3.12 | 5.03 | 2.73 | 5.88 | 8.2 |
| *** | ** | ** | *** | ** | *** | *** | |||
| healthcare services | -0.22 | 6.26 *** |
1.88 | 1.55 | 0.36 | 0.4 | 0.34 | 0.35 | -4.68 *** |
| social security | -0.63 | 3.41 | 2.59 | -4.99 | -7.48 | -5.31 | -9.58 | -9.52 | -7.48 |
| *** | ** | *** | *** | *** | *** | *** | *** | ||
| quality and space in | 4.6 | -5.17 | -5.16 | 2.69 | 2.88 | 1.86 | 2.99 | 2.21 | 5.76 |
| housing | *** | *** | *** | ** | ** | ** | * | *** | |
| basic services in | -10.16 | -8.49 | -8.48 | -11.88 | -11.95 | -10.24 | -11.5 | -9.49 | -9.26 |
| housing | *** | *** | *** | *** | *** | *** | *** | *** | *** |
| food water |
-0.55 -9.40 |
-14.69 *** -6.67 |
-3.03 ** -6.79 |
-2.18 * -7.82 |
4.49 *** -7.93 |
1.34 -6.41 |
1.58 -7.6 |
-1.04 -5.84 |
-7.67 *** -5.91 |
| *** | *** | *** | *** | *** | *** | *** | *** | *** | |
| sewer services | -3 ** |
-2.71 ** |
-1.19 | -5.54 *** |
-4.53 *** |
1.24 | -4.64 *** |
1.79 | 0.98 |
| electricity | -0.59 | -0.88 | 2.73 | 1.09 | 5.03 | 2.22 | 5.12 | 2.52 | 4.62 |
| ** | *** | * | *** | * | *** | ||||
Source: Own elaboration based on CONEVAL data (2019, 2021).
Note:
*,
**, and
***indicate significant differences with confidence levels of at least 95, 99, and 99.9 percent, respectively.
Even in this last case (with 22 statistically positive Π values and 37 negative ones), it seems difficult to argue that living conditions are worse in the northern border. In fact, they are mostly better.
Income levels have minimal impact on the results. It remains to be seen whether the definition of the geographical area under analysis significantly influences the findings. It’s worth noting that Guillén (2007) only utilizes data from the metropolitan areas of Tijuana-Playas de Rosarito, Mexicali, Juárez, and Reynosa-Río Bravo to compare them with Mérida, Querétaro, Aguascalientes, and Morelia. With this approach, the author finds, for example, that the percentage of households without water is more than double in the border region compared to non-border cities. Additionally, Guillén and Ordóñez (1992) limit their analysis to 90 settlements in Tijuana and Mexicali; Ruiz and Aceves (2000), Salazar (2002), and Carrión (2008) focus on the case of Tijuana; and Castañeda (2016) warns that the urban border areas of Baja California and some in Sonora best correspond to the characteristics of the border development paradox. On the other hand, Anderson and Gerber (2008) estimate that income levels and living conditions are not uniform across the northern border but tend to be better in the west and worsen towards the east. Therefore, it may be interesting to analyze the urban border areas of Baja California separately from the rest of the border and compare them with non-border urban areas.
Table 7 contains the values of the Π it functions for the percentage differences between these two areas for each deficiency and year. Most of the estimates are negative, indicating that the percentage of the population affected by the specific deficiency is lower in the group from Baja California. This is very clear for income poverty, but it also holds for five out of the six dimensions of multidimensional poverty according to CONEVAL. The percentages of the population with educational lag, lack of social security, lack of housing quality and space, lack of basic housing services, and food deprivation are consistently lower among the urban population in Baja California. Only the lack of access to health services is higher, although not in all years. Specifically, it was higher in Baja California in 2010 and 2016 with 95% confidence, but lower in 2008 and 2020 at 99.9% confidence. Furthermore, among the specific services analyzed by Guillén (1990, 2007), the lack of access to water is lower among the urban population in Baja California, as is the lack of sewer services until 2018. Only the electricity service has poorer coverage in the urban part of Baja California compared to the interior of the country, as was already the case when considering the entire northern border.
Table 7. Πit Values for the Differences in proportions Between Non-Border Urban Residents and Border Residents of Baja California
| CONEVAL data (2019) |
CONEVAL data (2021) |
||||||||
|---|---|---|---|---|---|---|---|---|---|
| Income | 2008 | 2010 | 2012 | 2014 | 2016 | 2018 | 2016 | 2018 | 2020 |
| poverty | -21.3 | -19.69 | -17.42 | -27.61 | -30.27 | -25.47 | -26.98 | -22.42 | -34.64 |
| *** | *** | *** | *** | *** | *** | *** | *** | *** | |
| extreme poverty | -10.89 | -13.23 | -11.83 | -18.13 | -19.21 | -16.38 | -15.66 | -15.42 | -23.49 |
| *** | *** | *** | *** | *** | *** | *** | *** | *** | |
| Deficiencies | |||||||||
| education | -2.6 | -4.27 | -6.15 | -4.94 | -4.13 | -1.63 | -4.3 | -1.45 | -1.18 |
| ** | *** | *** | *** | *** | *** | ||||
| healthcare services | -6.65 | 2.45 | -1.1 | 0.41 | 2.26 | -0.7 | 2.24 | -0.7 | -8.37 |
| *** | * | * | * | *** | |||||
| healthcare services | -9.77 | -7.39 | -5.97 | -7.96 | -15.07 | -14.04 | -20.25 | -19.88 | -16.64 |
| *** | *** | *** | *** | *** | *** | *** | *** | *** | |
| quality and space in | -11.33 | -8.41 | -11.59 | -4.93 | -7.76 | -1.76 | -7.64 | -1.64 | -3.23 |
| housing | *** | *** | *** | *** | *** | *** | ** | ||
| basic services in | -19.87 | -20.95 | -20.54 | -19.37 | -18.72 | -14.83 | -18.6 | -14.7 | -16.60 |
| housing | *** | *** | *** | *** | *** | *** | *** | *** | *** |
| food | -11.89 | -16.4 | -14.45 | -9.23 | -7.5 | -8.87 | -8.16 | -10.48 | -17.38 |
| *** | *** | *** | *** | *** | *** | *** | *** | *** | |
| water | -15.75 | -15.05 | -14.19 | -12.16 | -10.48 | -6.83 | -10.39 | -6.73 | -10.77 |
| *** | *** | *** | *** | *** | *** | *** | *** | *** | |
| sewer services | -8.16 | -6.52 | -8.46 | -8.52 | -8.35 | 2.53 | -8.31 | 2.59 | 3.37 |
| *** | *** | *** | *** | *** | * | *** | ** | *** | |
| electricity | -2.54 | -3.21 | 0.7 | 1.94 | 2.3 | 0.41 | 2.36 | 0.44 | 6.28 |
| * | ** | * | * | *** | |||||
Source: Own elaboration based on CONEVAL data (2019, 2021).
Note:
*,
**, and
***indicate significant differences with confidence levels of at least 95, 99, and 99.9 percent, respectively.
CONCLUSIONS
The analysis that has been conducted covers more variables, territories, and years than the research that initially formulated the paradox of border development, those that sought to verify it, or those that uncovered nuances and contradictions within it. The results obtained here indicate that there is no evidence supporting the existence of this paradox.
Urban residents in Mexico’s northern border region enjoy higher income levels, without experiencing significantly greater deficiencies in access to services. On the contrary, the highest percentages of urban population with educational lag, lack of access to healthcare, social security, food, or housing lacking basic services, quality, and space, are found in the rest of the country. This trend also extends to more specific deficiencies like the availability of piped water and sewage in households. Only the lack of electricity service is more pronounced in the border region, but with minimal incidence, as in 2020, it only affected 0.16% of the urban population in the northern border region compared to 0.07% in the non-border area.
The coexistence of higher incomes and improved living conditions in the northern border region dispels the paradox of border development. This finding, contrary to what Guillén (1990, 2007) obtains with data from 1987-88 and 2006 but similar to Vázquez (1996) with information from 1970 and 1990, can be considered robust as it holds true for the general population over more than a decade. This trend persists when comparing income strata or focusing solely on residents in Baja California, a region previously identified as more susceptible to the paradox according to earlier studies. Every year, from 2008 to 2020, the percentages of the population facing social deficiencies and incomes below the poverty and extreme poverty lines are significantly lower in urban areas of the northern border. Nevertheless, it is important to note that there are still individuals living in poverty in these areas, and in some cases, their living conditions can be quite precarious.
Additionally, distinctive factors set this region apart, such as the varying impacts of economic crises, which were more pronounced in 2010 but less severe in 2020. Moreover, differences exist within the urban areas of the border region itself. The publication of new data and more specific analyses will be instrumental in gaining a deeper understanding of these distinctions compared to the rest of the country and within cities and areas within the same border region.
REFERENCES
Anderson, J. B. y Gerber, J. (2008). Fifty years of change on the U.S.-Mexico border: Growth, development, and quality of life. University of Texas Press. https://www.jstor.org/stable/10.7560/717183 [ Links ]
Carrión, V. R. (2008). Exclusión social: aplicación empírica en la zona metropolitana de Tijuana 2005 [Tesis de maestría, El Colegio de la Frontera Norte]. https://www.colef.mx/posgrado/tesis/2006714/ [ Links ]
Castañeda, F. (2016). Evolución de la estructura de la marginación en la frontera norte de México, 1990-2010 [Tesis de maestría, El Colegio de la Frontera Norte]. https://www.colef.mx/posgrado/tesis/20141145/ [ Links ]
Consejo Nacional de Evaluación de la Política de Desarrollo Social (Coneval). (2018). Metodología para la medición multidimensional de la pobreza en México (3ª ed.). Coneval. https://www.coneval.org.mx/InformesPublicaciones/InformesPublicaciones/Documents/Metodologia-medicion-multidimensional-3er-edicion.pdf [ Links ]
Consejo Nacional de Evaluación de la Política de Desarrollo Social (Coneval). (2014). Metodología para la medición multidimensional de la pobreza en México (2ª ed.). Coneval. https://www.coneval.org.mx/Informes/Coordinacion/Publicaciones%20oficiales/MEDICION_MULTIDIMENSIONAL_SEGUNDA_EDICION.pdf [ Links ]
Consejo Nacional de Evaluación de la Política de Desarrollo Social (Coneval). (2019). Programas de cálculo y bases de datos 2008, 2010, 2012, 2014, 2016 y 2018. Coneval. https://www.coneval.org.mx/Medicion/MP/Paginas/Programas_BD_08_10_12_14_16_18.aspx [ Links ]
Consejo Nacional de Evaluación de la Política de Desarrollo Social (Coneval). (2021). Programas de cálculo y bases de datos 2016, 2018 y 2020. Coneval. https://www.coneval.org.mx/Medicion/MP/Paginas/Programas_BD_2016-2020.aspx [ Links ]
Cuadras, C. M., Echeverría, B., Mateo, J. y Sánchez, P. (1996). Fundamentos de estadística: aplicación a las ciencias humanas. Editorial EUB. [ Links ]
Durand, J. y Massey, D. S. (2003). Clandestinos: migración México-Estados Unidos en los albores del siglo XXI. Universidad Autónoma de Zacatecas; Miguel Ángel Porrúa. [ Links ]
Guillén, T. (1990). Servicios públicos y marginalidad social en la frontera norte. Frontera Norte, 2(4), 95-119 . https://fronteranorte.colef.mx/index.php/fronteranorte/article/view/1630 [ Links ]
Guillén, T. (2007). Frontera norte: los contrastes de la calidad de vida. Revista Mexicana de Política Exterior, 81, 9-32. https://revistadigital.sre.gob.mx/index.php/rmpe/article/view/596 [ Links ]
Guillén, T. y Ordóñez, G. (1992). La marginalidad social en la frontera norte: discrepancias empíricas al concepto de marginalidad. Frontera Norte, 4(8), 149-163. https://fronteranorte.colef.mx/index.php/fronteranorte/article/view/1581/0 [ Links ]
Instituto Nacional de Estadística y Geografía (Inegi). (2022). Archivo histórico de localidades geoestadísticas. Inegi. https://www.inegi.org.mx/app/geo2/ahl/#:~:text=Este%20archivo%20forma%20parte%20del,ámbitos%20administrativo%2C%20estadístico%20y%20geográfico [ Links ]
López, J. y Peláez, Ó. (2015). El desigual impacto de la crisis económica de 2008-2009 en los mercados de trabajo de las regiones de México: la frontera norte frente a la región sur. Contaduría y Administración, 60(S2), 195-218 . https://doi.org/10.1016/j.cya.2015.05.004 [ Links ]
Moffat, R. (1996). Population history of western U.S. cities and towns, 1850-1990. Scarecrow Press. [ Links ]
Mungaray Lagarda, A., Escamilla Díaz, A. y García Meneses, E. (2014). Migración por empleo en México. La experiencia de Baja California entre 2008 y 2012. Región y Sociedad, 26(61), 51-85. https://www.scielo.org.mx/scielo.php?script=sci_arttext&pid=S1870-39252014000400002 [ Links ]
Orraca, P. P. (2015). Immigrants and cross-border workers in the U.S.-Mexico border region. Frontera Norte, 27(53), 5-34. https://www.scielo.org.mx/cielo.php?script=sci_arttext&pid=S0187-73722015000100001 [ Links ]
Peach, J. y Molina, D. J. (2002). Income distribution in Mexico’s Northern border states. Journal of Borderlands Studies, 17(2), 1-19. https://doi.org/10.1080/08865655.2002.9695587 [ Links ]
Rhi-Sausi, J. L. y Oddone, N. (2009). Fronteras y cooperación transfronteriza en América Latina: introducción al Proyecto Fronteras Abiertas. En J. L. Rhi-Sausi y D. Conato (Coords.), Cooperación transfronteriza e integración en América Latina: la experiencia del Proyecto Fronteras Abiertas (pp. 5-18). IILA; CeSPI. [ Links ]
Ruiz, B. y Aceves, P. (2000). Pobreza y desigualdad social en Tijuana. El Bordo, 2. https://uia-foundation.org/wp-content/el-bordo/02/Tijuana-00.php [ Links ]
Salazar, E. (2002). Propuesta metodológica para medir la marginación intraurbana en Tijuana, B. C. [Tesis de maestría, El Colegio de la Frontera Norte]. https://www.colef.mx/posgrado/tesis/2000485/ [ Links ]
Tamayo, L. M. O. y Moncada, J. O. (2001). La Comisión de Límites de México y el levantamiento de la línea divisoria entre México y Estados Unidos, 1849-1857. Investigaciones Geográficas, 44, 85-102. https://doi.org/10.14350/rig.59137 [ Links ]
Taylor, L. D. (2003). Los orígenes de la industria maquiladora en México. Comercio Exterior, 53 (11), 1045-1056. http://revistas.bancomext.gob.mx/rce/magazines/59/7/RCE.pdf [ Links ]
Texas State Historical Association (TSHA). (2015). Texas almanac: City population history from 1850-2000. Autor. https://texasalmanac.com/sites/default/files/images/CityPopHist%20web.pdf/ [ Links ]
Vázquez, B. D. (1996). Niveles de bienestar en la frontera norte de México: cálculo de un índice de desarrollo [Tesis de maestría, El Colegio de la Frontera Norte]. https://www.colef.mx/posgrado/tesis/94220/ [ Links ]
Vega, G. (2016). Población commuter de la frontera norte: el caso de Mexicali-Calexico y Tijuana- San Diego. Estudios Demográficos y Urbanos, 31(1), 207-238. https://www.scielo.org.mx/scielo.php?script=sci_arttext&pid=S0186-72102016000100207 [ Links ]
4These municipalities in the northern border are: Mexicali, Tecate, and Tijuana (in Baja California), Acuña, Guerrero, Hidalgo, Jiménez, Nava, Ocampo, and Piedras Negras (in Coahuila), Ascensión, Guadalupe, Janos, Juárez, Manuel Benavides, Ojinaga, and Praxedis G. Guerrero (in Chihuahua), Anáhuac (in Nuevo León), Agua Prieta, Altar, Caborca, Naco, Nogales, Puerto Peñasco, San Luis Río Colorado, Santa Cruz, Sáric, and General Plutarco Elías Calles (in Sonora), Camargo, Guerrero, Gustavo Díaz Ordaz, Matamoros, Mier, Miguel Alemán, Nuevo Laredo, Reynosa, Río Bravo, and Valle Hermoso (in Tamaulipas).
Received: January 21, 2022; Accepted: June 05, 2023
 Este es un artículo publicado en acceso abierto bajo una licencia Creative
Commons
Este es un artículo publicado en acceso abierto bajo una licencia Creative
Commons
